Name
守金均线量化交易策略Trend-Following-Quant-Trading-Strategy-Based-on-Moving-Average
Author
ChaoZhang
Strategy Description
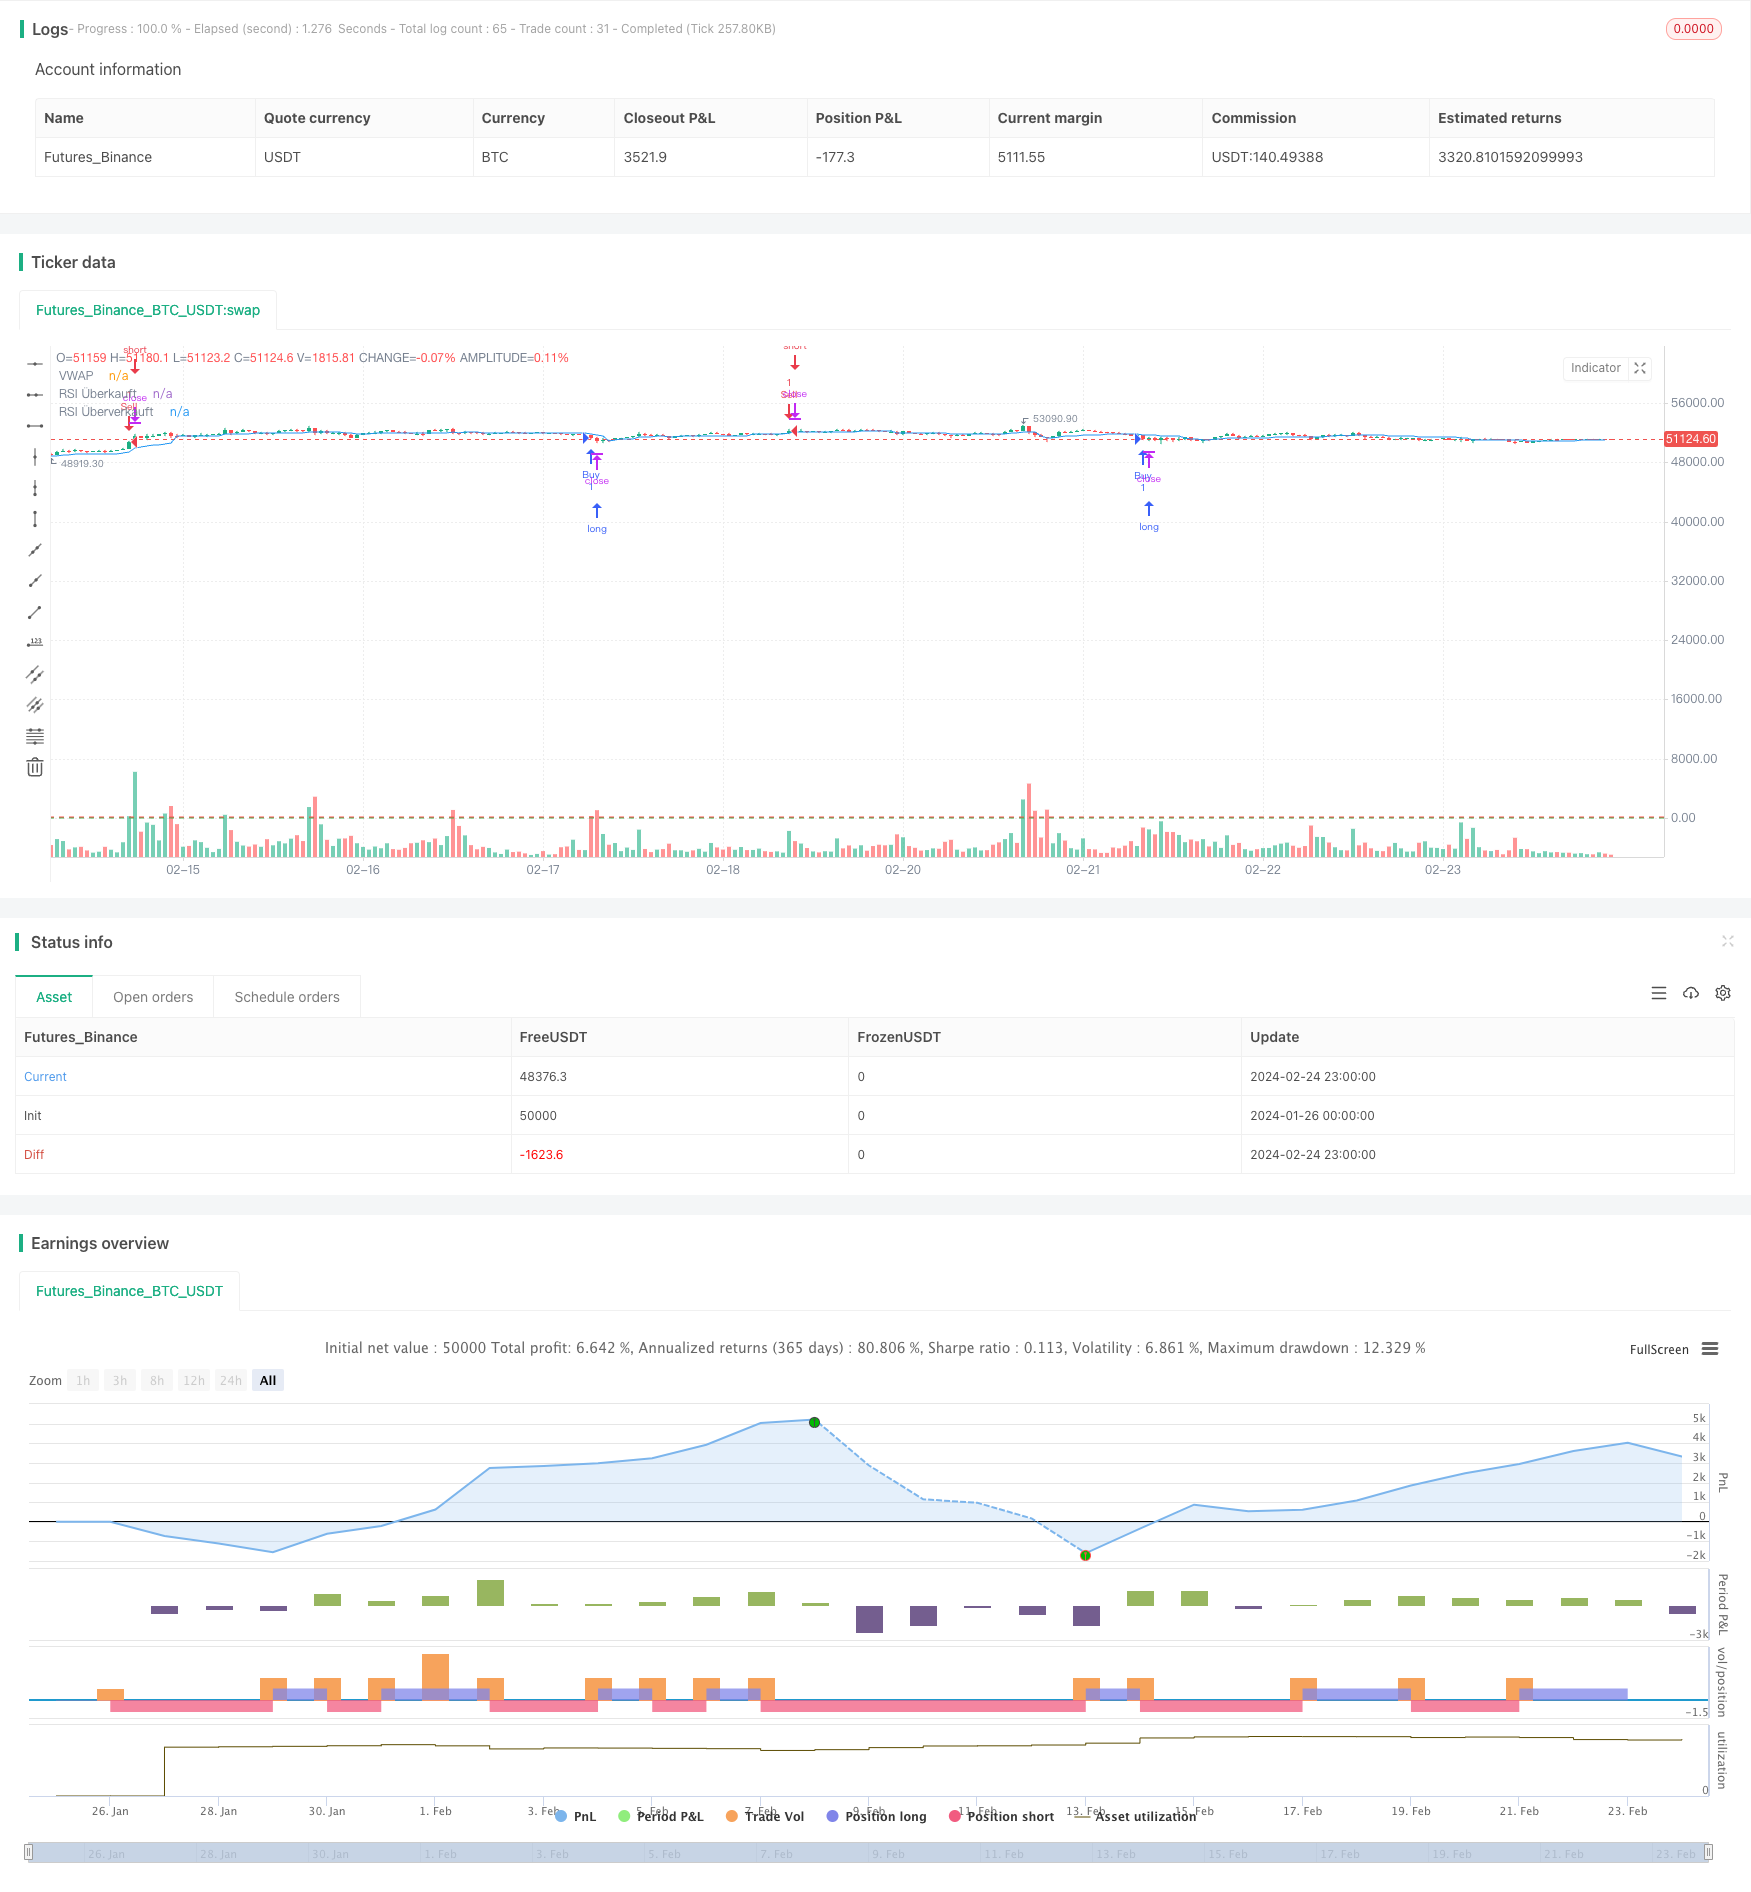
该策略利用移动平均线作为主要技术指标,结合RSI指标作为过滤条件,实现了一个较为简单的趋势跟踪策略。当价格跌破或突破指定周期的移动平均线时产生交易信号。同时,RSI指标可用来判断过度买入或卖出的情况从而避免错误交易。整体来说,该策略适用于追踪中长线趋势,在强势趋势中可以获得较好收益。
本策略主要基于移动平均线和RSI指标。移动平均线被广泛使用来判断价格趋势方向和强度。当价格高于移动平均线时,表示当前处于上升趋势;当价格低于移动平均线时,表示当前处于下降趋势。因此,价格突破移动平均线可以作为产生交易信号的依据。另一方面,RSI指标则可用于判断市场是否处于超买或超卖状态。RSI高于70表示可能超买,低于30表示可能超卖。所以,本策略采用RSI指标对移动平均线产生的交易信号进行过滤,只有在RSI指标显示没有超买超卖的情况下,才会产生真正的交易指令。
具体来说,当价格低于移动平均线且RSI低于30时产生买入信号;当价格高于移动平均线且RSI高于70时产生卖出信号。根据这些交易信号来建立多头或空头仓位。
该策略具有以下优势:
-
操作简单,容易实现。主要依赖移动平均线指标,对交易者技术要求不高。
-
能够有效跟踪价格趋势,特别适合中长线操作。
-
RSI指标的应用可以避免不必要的错误交易,过滤假信号。
-
无需频繁调整参数,降低了过度优化的风险。
-
可扩展性高,可引入更多指标或优化规则来完善。
该策略也存在以下风险:
-
在价格震荡区间内,会产生较多错误信号导致亏损。
-
无法很好判断趋势反转点,可能在市场转势点前后建立错误仓位导致损失。
-
参数设置(如移动平均线周期长度)不当可能影响策略表现。
-
无法适应突发事件造成的剧烈行情。
-
回测数据拟合风险,实盘表现可能与回测结果有差异。
该策略可以从以下几个方面进行优化:
-
增加止损机制。可以设置移动止损或厚度止损来控制单笔亏损风险。
-
增加趋势判断指标。例如MACD,KD等可以帮助判断趋势方向,避免产生错误信号。
-
优化移动平均线参数。可以测试不同周期参数对策略稳定性和收益率的影响。
-
增加交易频率控制。例如只在特定时段或只有较大价格变动时进行交易。
-
引入机器学习技术进行策略优化和训练。
本策略整体而言是一个较为简单实用的趋势跟踪策略。它利用移动平均线判断价格趋势和方向,同时用RSI指标来过滤掉错误信号。策略优点主要有操作简单,容易实现,适合中长线交易等。缺点在于无法很好处理价格震荡和趋势反转。未来优化空间在于增加止损机制,引入更多辅助指标判断趋势,以及参数优化等。
||
This strategy uses moving average as the main technical indicator, combined with RSI indicator as a filter condition, to implement a relatively simple trend following strategy. Trading signals are generated when price crosses below or above the moving average of a specified period. Meanwhile, RSI indicator can be used to determine overbought or oversold situations to avoid wrong trades. Overall, this strategy is suitable for tracking medium to long term trends and can yield good returns in strong trending markets.
This strategy is mainly based on moving average and RSI indicator. Moving average is widely used to determine price trend direction and strength. When price is above moving average, it indicates an upward trend; when price is below moving average, it shows a downward trend. Therefore, the crossing of price and moving average can serve as the basis for generating trading signals. On the other hand, RSI indicator can be used to judge whether the market is in overbought or oversold state. RSI above 70 suggests possible overbought, below 30 suggests possible oversold. So this strategy uses RSI indicator to filter the trading signals generated by moving average line, only when the RSI indicator shows no overbought or oversold will a real trading order be generated.
Specifically, when the price is below the moving average and RSI is below 30, a buy signal is generated; when the price is above the moving average and RSI is above 70, a sell signal is generated. Long or short positions are established based on these trading signals.
The strategy has the following advantages:
-
Simple to operate, easy to implement. Mainly relies on moving average indicator, has low technical requirements for traders.
-
Can effectively track price trends, especially suitable for medium to long term operations.
-
The application of RSI indicator can avoid unnecessary wrong trades and filter out false signals.
-
No need for frequent adjustment of parameters, reducing the risk of over-optimization.
-
High scalability, can introduce more indicators or optimization rules to improve.
The strategy also has the following risks:
-
In the price fluctuation zone, more wrong signals will be generated leading to losses.
-
Unable to well determine trend reversal points, may establish wrong positions before and after market turns resulting in losses.
-
Improper parameter settings (such as moving average period) may affect strategy performance.
-
Unable to adapt to volatile market caused by sudden events.
-
Backtest data overfitting risk, actual performance may differ from backtest results.
The strategy can be optimized in the following aspects:
-
Add stop loss mechanism. Can set trailing stop loss or thick stop loss to control single ticket loss risk.
-
Add trend judgment indicators. Indicators like MACD and KD can help determine trend direction and avoid wrong signals.
-
Optimize moving average parameters. Can test the impact of different cycle parameters on strategy stability and return rate.
-
Add trading frequency control. For example, only trade during specific time periods or only when there is significant price movement.
-
Introduce machine learning techniques for strategy optimization and model training.
In summary, this is a relatively simple and practical trend following strategy. It uses moving average to determine price trend and direction, while using RSI indicator to filter out wrong signals. The main advantages of the strategy are easy operation, easy implementation, suitable for medium and long term trading, etc. The disadvantages lie in the inability to properly handle price fluctuations and trend reversals. Future optimization space includes adding stop loss mechanisms, introducing more auxiliary indicators to judge trends, parameter optimization and so on.
[/trans]
Strategy Arguments
| Argument | Default | Description |
|---|---|---|
| v_input_1 | 5 | VWAP Länge |
| v_input_2 | 3 | Standardabweichungs-Multiplikator |
| v_input_3 | 25 | SMA Länge für Trendfilter |
| v_input_4 | 8 | RSI Periode |
| v_input_5 | 70 | RSI Überkauft-Schwelle |
| v_input_6 | 30 | RSI Überverkauft-Schwelle |
Source (PineScript)
/*backtest
start: 2024-01-26 00:00:00
end: 2024-02-25 00:00:00
period: 1h
basePeriod: 15m
exchanges: [{"eid":"Futures_Binance","currency":"BTC_USDT"}]
*/

//@version=5
strategy("Verbesserte VWAP Strategie mit RSI Filter", overlay=true)

// Eingabeparameter
length = input(5, title="VWAP Länge")
multiplier = input(3.0, title="Standardabweichungs-Multiplikator")
smaLength = input(25, title="SMA Länge für Trendfilter")
rsiPeriod = input(8, title="RSI Periode")
rsiOverbought = input(70, title="RSI Überkauft-Schwelle")
rsiOversold = input(30, title="RSI Überverkauft-Schwelle")

// VWAP, Standardabweichung und RSI
vwapValue = ta.vwap(hlc3, length)
rsi = ta.rsi(close, rsiPeriod)

// Signale mit RSI Filter
buySignal = close < vwapValue and rsi < rsiOversold
sellSignal = close > vwapValue and rsi > rsiOverbought

// Strategie-Logik
if (buySignal)
    strategy.entry("Buy", strategy.long)

if (sellSignal)
    strategy.entry("Sell", strategy.short)

// Zeichnen
plot(vwapValue, color=color.blue, title="VWAP")
hline(rsiOverbought, "RSI Überkauft", color=color.red)
hline(rsiOversold, "RSI Überverkauft", color=color.green)
Detail
https://www.fmz.com/strategy/442832
Last Modified
2024-02-26 13:45:49
