Name
布林带下叉RSI回调交易策略Trading-Strategy-of-Short-Selling-When-Bollinger-Band-Crosses-Below-Price-with-RSI-Callback
Author
ChaoZhang
Strategy Description
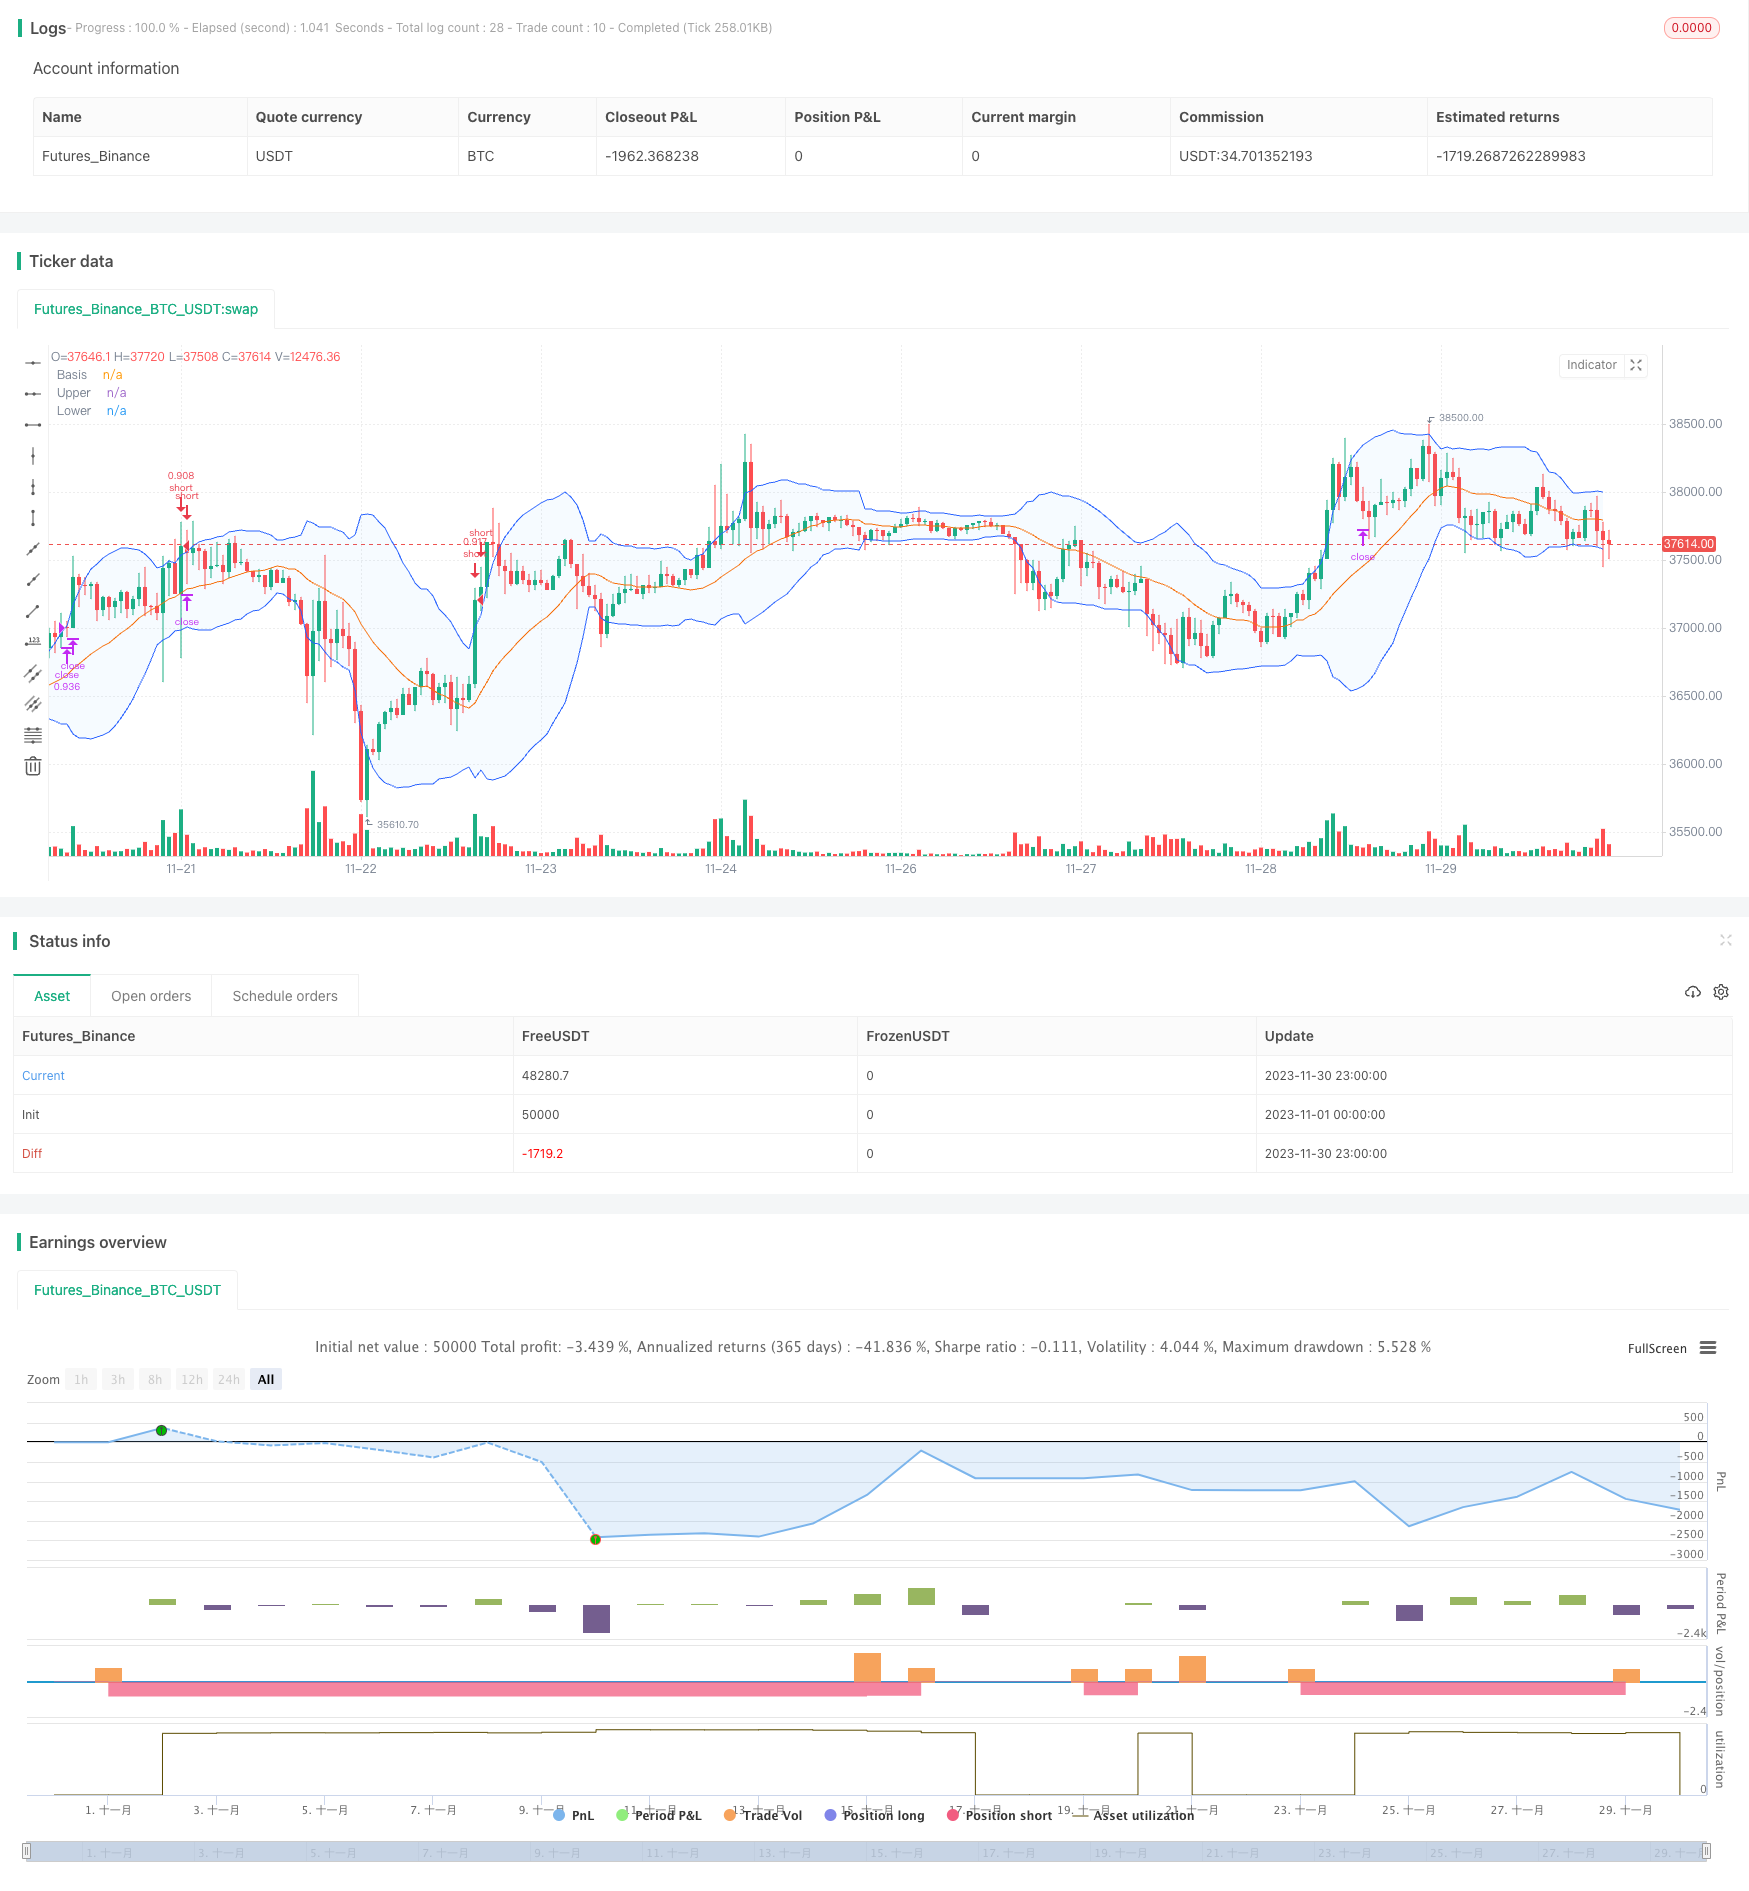
该策略利用布林带指标判断价格是否进入超买超卖区域,结合RSI指标判断是否存在回调机会,在超买区形成死叉时做空,在价格上涨超过布林带上轨时止损。
该策略主要基于以下原理:
- 当收盘价格上穿布林带上轨时,表示资产进入超买区域,存在回调机会
- RSI指标可以有效判断超买超卖区域,RSI>70为超买区
- 当收盘价格从上轨下穿时,做空头仓
- 当RSI从超买区回落或止损点触发时,平仓止损
该策略具有以下优势:
- 利用布林带判断超买超卖区域,提高 trades的成功率
- 结合RSI指标过滤假突破的机会,避免不必要的 loss
- 损益比高,最大程度控制风险
该策略存在以下风险:
- 突破上轨后继续上涨导致 loss 进一步扩大
- RSI未能及时回落,loss 进一步扩大
- 单边持仓,无法交易盘整市
可以通过以下方法降低风险:
- 适当调整止损点,及时止损
- 组合其他指标判断RSI回落信号
- 结合均线指标,判断是否进入盘整
该策略可以从以下方面进行优化:
- 优化布林带参数,适应更多交易品种
- 优化 RSI 参数,提高指标效果
- 增加其他指标组合,判断趋势反转点
- 增加多头交易逻辑
- 结合止损策略,动态调整止损点
该策略整体来说是一种典型的超买区快速短线交易策略。利用布林带判断买卖点,RSI过滤信号。通过合理止损来控制风险水平。可以通过参数优化,组合指标,增加开仓逻辑等方式进行效果提升。
||
This strategy utilizes Bollinger Bands to determine if price has entered the overbought area and combines RSI indicator to identify callback opportunities. It goes short when a death cross is formed in the overbought area and stops out when price rises back above the Bollinger Upper Band.
The strategy is based on the following principles:
- When close price crosses above Bollinger Upper Band, it indicates the asset has entered overbought territory and a callback is likely
- RSI indicator effectively determines overbought/oversold levels. RSI > 70 is considered overbought
- Go short when close price crosses below Upper Band
- Close position when RSI pulls back from overbought zone or stop loss is triggered
Advantages of this strategy:
- Bollinger Bands determine overbought/oversold levels accurately, improving trade success rate
- RSI filters out false breakout signals, avoiding unnecessary losses
- High risk to reward ratio obtained by effectively controlling risk
Risks in this strategy:
- Price may continue going up after breaking above Upper Band, leading to further losses
- Failure of timely RSI pullback results in loss amplification
- Unidirectional short position leaves no room for trading in consolidation
Risks can be minimized by:
- Adjusting stop loss properly for timely stop out
- Adding indicators to confirm RSI callback
- Using moving averages to determine consolidation
This strategy can be improved on:
- Optimizing Bollinger parameters for more assets
- Fine tuning RSI parameters for better signals
- Adding more indicators to pinpoint trend reversal points
- Incorporating long trade logic
- Implement dynamic stop loss based on volatility
In summary, this is a typical overbought quick short scalping strategy. It capitalizes on Bollinger Bands for trade entries and RSI to filter signals. Risk is managed through prudent stop loss placement. Further enhancements can come from parameter tuning, adding indicators, expanding trade logic etc.
[/trans]
Strategy Arguments
| Argument | Default | Description |
|---|---|---|
| v_input_1 | true | Show Date Range |
| v_input_int_1 | 20 | length |
| v_input_2_close | 0 | Source: close |
| v_input_float_1 | 2 | StdDev |
| v_input_int_2 | false | Offset |
| v_input_float_2 | 3 | Trail Long Loss (%) |
| v_input_float_3 | 3 | Trail Short Loss (%) |
Source (PineScript)
/*backtest
start: 2023-11-01 00:00:00
end: 2023-11-30 23:59:59
period: 1h
basePeriod: 15m
exchanges: [{"eid":"Futures_Binance","currency":"BTC_USDT"}]
*/

//@version=5
// This source code is subject to the terms of the Mozilla Public License 2.0 at https://mozilla.org/MPL/2.0/
// © Coinrule


strategy("Bollinger Band Below Price with RSI",
         overlay=true,
         initial_capital=1000,
         process_orders_on_close=true,
         default_qty_type=strategy.percent_of_equity,
         default_qty_value=70,
         commission_type=strategy.commission.percent,
         commission_value=0.1)

showDate = input(defval=true, title='Show Date Range')
timePeriod = time >= timestamp(syminfo.timezone, 2022, 1, 1, 0, 0)
notInTrade = strategy.position_size <= 0

//Bollinger Bands Indicator
length = input.int(20, minval=1)
src = input(close, title="Source")
mult = input.float(2.0, minval=0.001, maxval=50, title="StdDev")
basis = ta.sma(src, length)
dev = mult * ta.stdev(src, length)
upper = basis + dev
lower = basis - dev
offset = input.int(0, "Offset", minval = -500, maxval = 500)
plot(basis, "Basis", color=#FF6D00, offset = offset)
p1 = plot(upper, "Upper", color=#2962FF, offset = offset)
p2 = plot(lower, "Lower", color=#2962FF, offset = offset)
fill(p1, p2, title = "Background", color=color.rgb(33, 150, 243, 95))

// RSI inputs and calculations
lengthRSI = 14
RSI = ta.rsi(close, lengthRSI)


// Configure trail stop level with input options
longTrailPerc = input.float(title='Trail Long Loss (%)', minval=0.0, step=0.1, defval=3) * 0.01
shortTrailPerc = input.float(title='Trail Short Loss (%)', minval=0.0, step=0.1, defval=3) * 0.01

// Determine trail stop loss prices
//longStopPrice = 0.0
shortStopPrice = 0.0

//longStopPrice := if strategy.position_size > 0
    //stopValue = close * (1 - longTrailPerc)
    //math.max(stopValue, longStopPrice[1])
//else
    //0

shortStopPrice := if strategy.position_size < 0
    stopValue = close * (1 + shortTrailPerc)
    math.min(stopValue, shortStopPrice[1])
else
    999999


//Entry and Exit
strategy.entry(id="short", direction=strategy.short, when=ta.crossover(close, upper) and RSI < 70 and timePeriod and notInTrade)

if (ta.crossover(upper, close) and RSI > 70 and timePeriod)
    strategy.exit(id='close', limit = shortStopPrice)
Detail
https://www.fmz.com/strategy/436618
Last Modified
2023-12-26 12:08:44
