Name
布林带突破动量策略Bollinger-Momentum-Breakout-Strategy
Author
ChaoZhang
Strategy Description
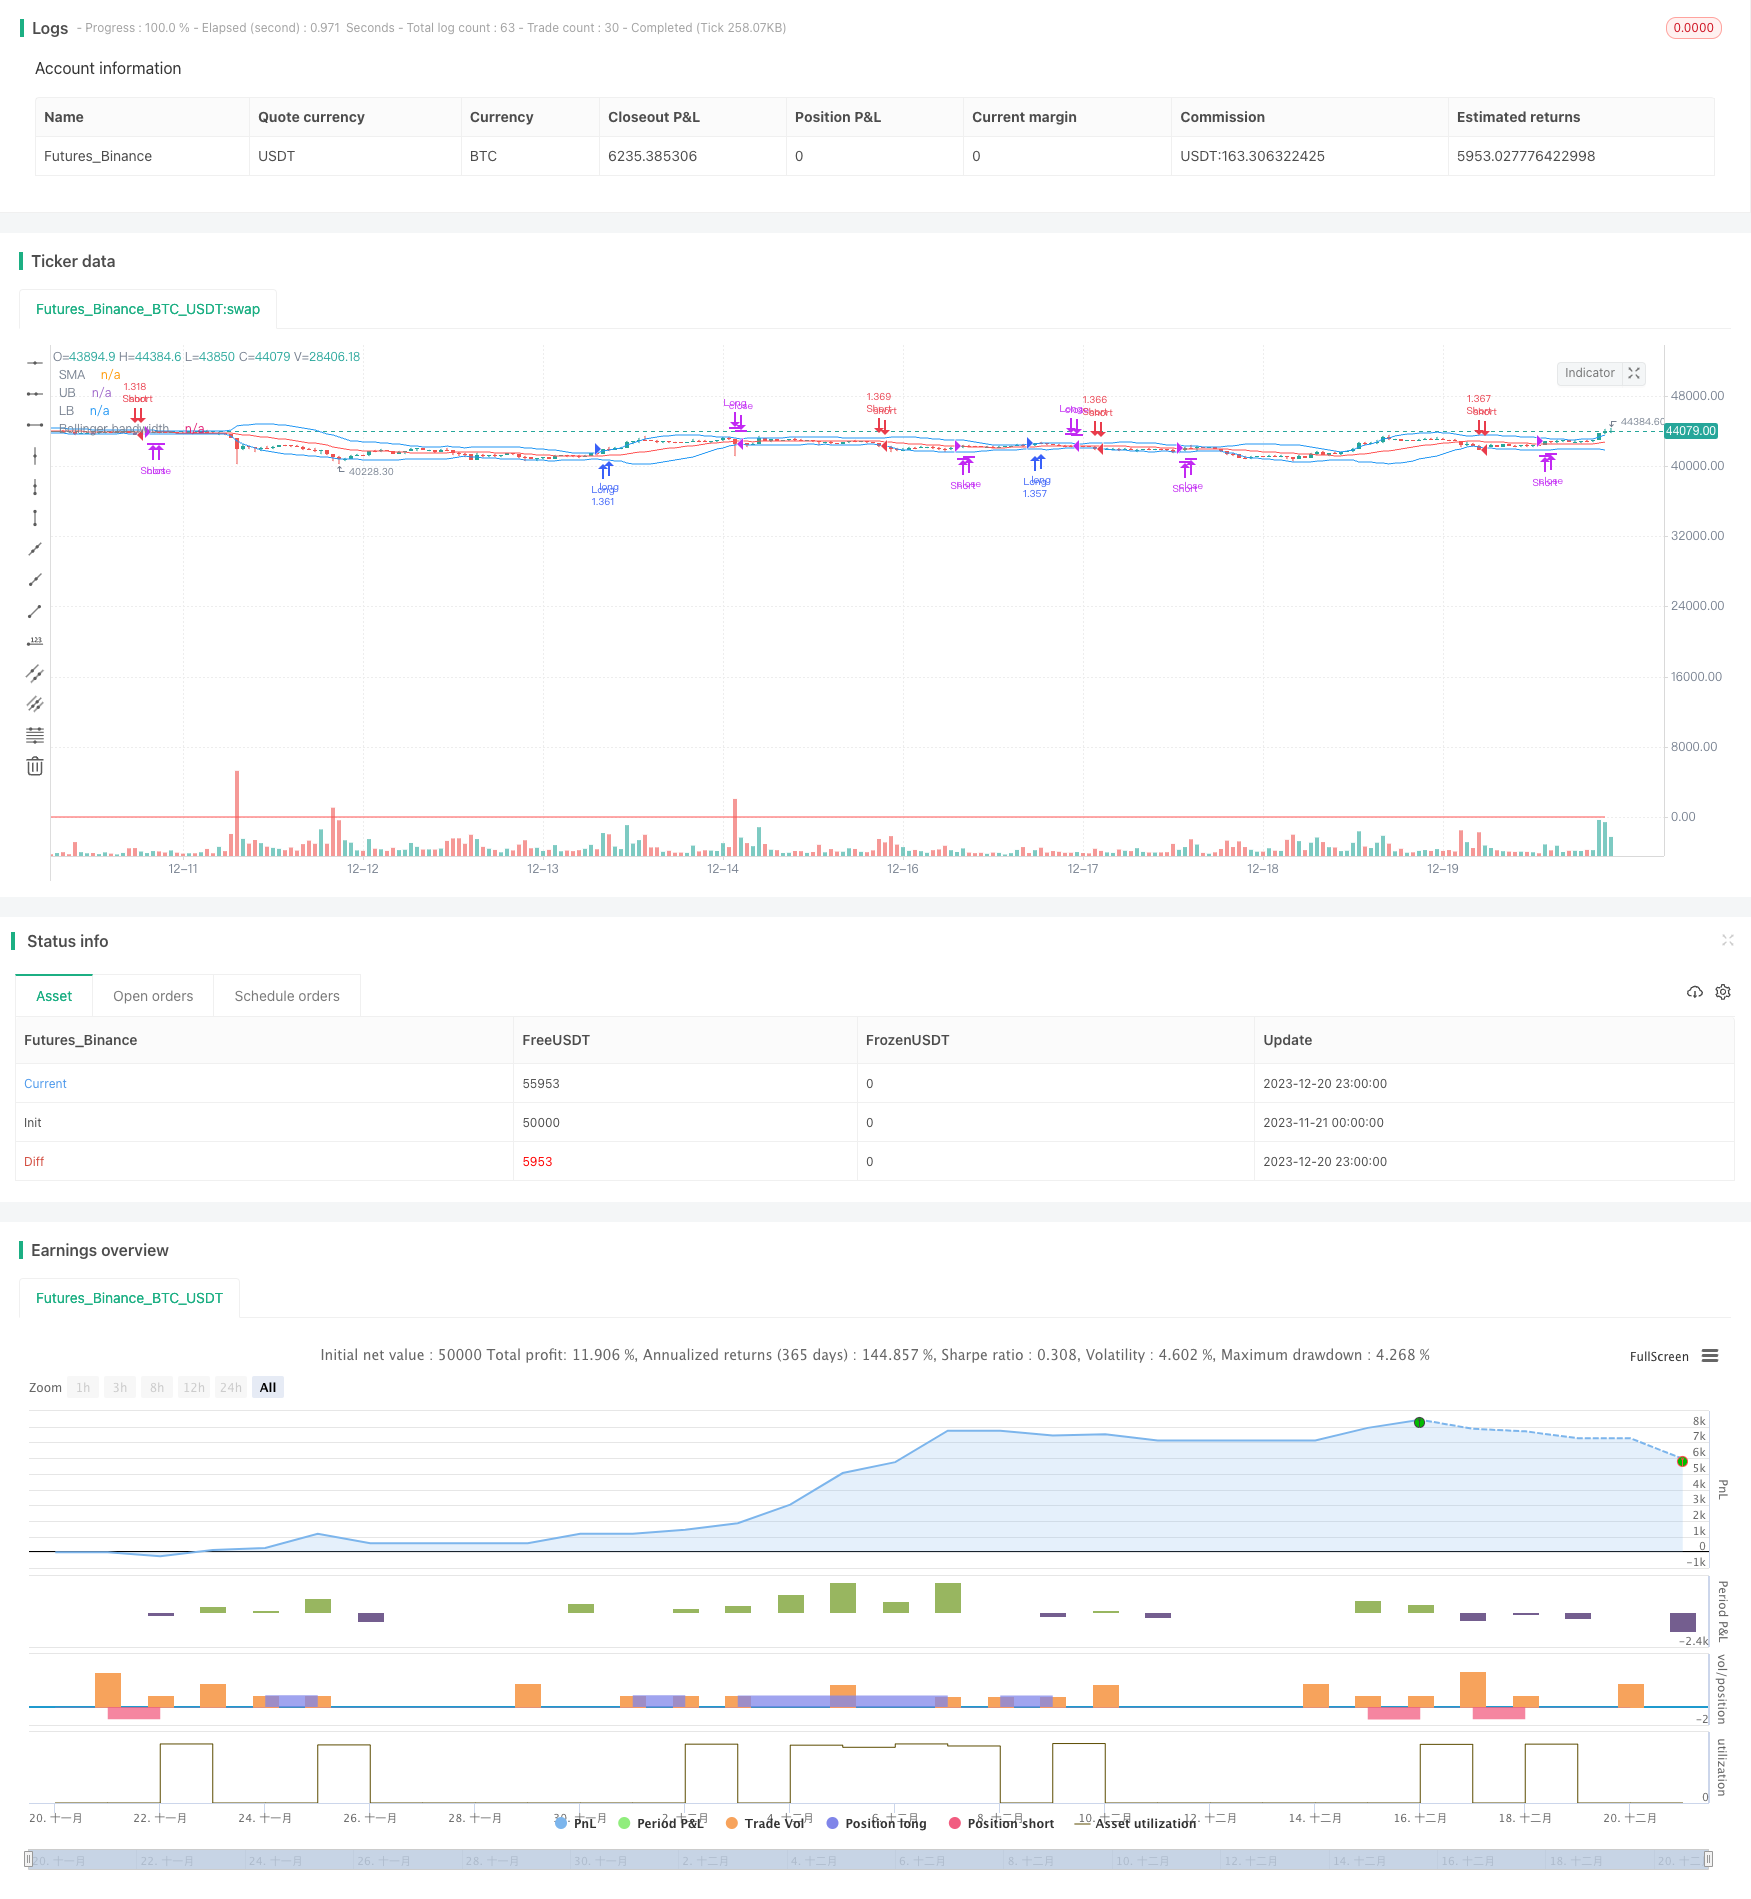
该策略通过布林带指标判断市场趋势方向,结合RSI指标过滤阳离子信号,实现追涨杀跌的动量突破操作。其基本思路是:当价格突破布林带上轨时看涨入场,当价格突破布林带下轨时看跌入场。
-
布林带指标判断价格突破上轨时,表示市场进入看涨行情,这时用RSI指标过滤,RSI大于60时产生买入信号;布林带指标判断价格突破下轨时,表示市场进入看跌行情,这时用RSI指标过滤,RSI小于40时产生卖出信号。
-
入场后设置止损,避免亏损扩大。
-
出场条件为价格重新跌破布林中轨时平买单,价格重新涨破布林中轨时平卖单。
-
布林带指标可以判断市场主要趋势,捕捉行情转折点。结合RSI指标过滤可以提高信号的可靠性。
-
追涨杀跌的操作方式可以实现超额收益。
-
设置止损点可以控制风险。
-
布林带指标对于盘整行情判断效果不佳,容易产生假信号。
-
止损点设置不当可能造成亏损扩大。
-
交易频繁,易受交易费用和滑点的影响。
-
突破信号判断需要及时更新,否则可能错过最佳入场时机。
-
结合其他指标判断布林带指标突破信号的可靠性。例如成交量,移动平均线等。
-
动态调整布林带参数,优化指标性能。
-
优化止损位置。如跟踪止损,百分比止损等方法。减少无谓损失。
该策略整体思路清晰,通过布林带判断市场趋势和RSI指标过滤,实现动量式的趋势追踪。具有如下特点:操作频繁,盈亏快速,追求超额收益的交易者比较适合。但交易频繁也增加了交易成本,对资金管理和心态控制要求较高。通过参数优化,止损策略优化,可以进一步提高策略的稳定性和盈利能力。
||
This strategy uses Bollinger Bands to determine market trend direction combined with RSI indicator to filter bullish signals, implementing momentum breakout operations to chase rises and kill falls. The basic idea is: when the price breaks through the Bollinger upper band, go long; when the price breaks through the Bollinger lower band, go short.
-
When Bollinger Bands indicator determines the price breaks through the upper band, it indicates the market enters a bullish trend. At this time, use RSI indicator for filtration. Generate buy signal when RSI is greater than 60. When BB indicator determines the price breaks through the lower band, it indicates the market enters a bearish trend. At this time, use RSI indicator for filtration. Generate sell signal when RSI is less than 40.
-
Set stop loss after entering the market to avoid further losses.
-
Exit criteria is closing long position when price breaks back below BB middle band, and closing short position when price breaks back above BB middle band.
-
Bollinger Bands indicator can determine major market trend and capture inflection points. Combining with RSI filter can improve signal reliability.
-
Chase rises and kill falls operation can achieve excess returns.
-
Setting stop loss can control risks.
-
BB indicator is not effective in judging sideways markets, which can generate false signals.
-
Improper stop loss setting may lead to further losses.
-
High trading frequency is impacted by trading costs and slippage.
-
Breakout signals need timely update, otherwise best entry opportunities may be missed.
-
Combine with other indicators to judge reliability of BB breakout signals, such as volume, moving averages etc.
-
Dynamically adjust BB parameters to optimize indicator performance.
-
Optimize stop loss position, such as trailing stop loss, percentage stop loss to reduce unnecessary losses.
The strategy has a clear logic to determine market trend through BB and filter signals with RSI for momentum trend chasing. It features high operation frequency, fast profit/loss cycles, more suitable for traders pursuing excess returns. However, high trading frequency also increases transaction costs and requires strict capital management and emotional control. Further performance and stability improvement can be achieved through parameter optimization and stop loss optimization.
[/trans]
Strategy Arguments
| Argument | Default | Description |
|---|---|---|
| v_input_1 | 20 | Period |
| v_input_2 | 2 | Standard Deviation |
Source (PineScript)
/*backtest
start: 2023-11-21 00:00:00
end: 2023-12-21 00:00:00
period: 1h
basePeriod: 15m
exchanges: [{"eid":"Futures_Binance","currency":"BTC_USDT"}]
*/


//@version=4
strategy(title="Bollinger Band Breakout", shorttitle = "BB-Stoxguru",default_qty_type = strategy.percent_of_equity,default_qty_value = 100, overlay=true)
source = close
start = timestamp (2007, 1,1,0,0)
end = timestamp (2021,11,05,0,0)
stop_level = (high[1]-low[1])
profit_level = (high[1]-low[1])
length = input(20, minval=1, title = "Period") //Length of the Bollinger Band
mult = input(2, minval=0.001, maxval=50, title = "Standard Deviation")

basis = sma(source, length)
dev = mult * stdev(source, length)

upper = basis + dev
lower = basis - dev
band=upper-lower
stop_loss=low-atr(14)
if time >= start
// and time < end
    strategy.entry("Long", strategy.long, when = crossover(source, upper) and rsi(close,14)>=60 and rsi(close,14)<=70)
    // strategy.entry("Long", strategy.long, when = crossover(source, upper) and rsi(close,14)>60 and band<200)
    // strategy.exit("SL", "Long", stop=stop_loss)
    strategy.close(id="Long", when=crossunder(close, basis))
    strategy.entry("Short", strategy.short, when = crossunder(source, lower) and rsi(close,14)<=40 and rsi(close,14)>=35)
    strategy.close(id="Short", when=crossover(close, basis))
    // strategy.entry("Short", strategy.short, when = crossunder(source, lower) and rsi(close,14)<40 and band<200)
    // plot(upper-lower, color=color.purple,title= "DIFF",style=plot.style_linebr)
plot(basis, color=color.red,title= "SMA")
p1 = plot(upper, color=color.blue,title= "UB")
p2 = plot(lower, color=color.blue,title= "LB")
// fill(p1, p2)
BW = ((upper - lower)) / basis * 100

plot(BW, title="Bollinger bandwidth", color=color.red)
Detail
https://www.fmz.com/strategy/436226
Last Modified
2023-12-22 13:09:32
