Name
强势趋势突破策略Strong-Trend-Breakout-Strategy
Author
ChaoZhang
Strategy Description
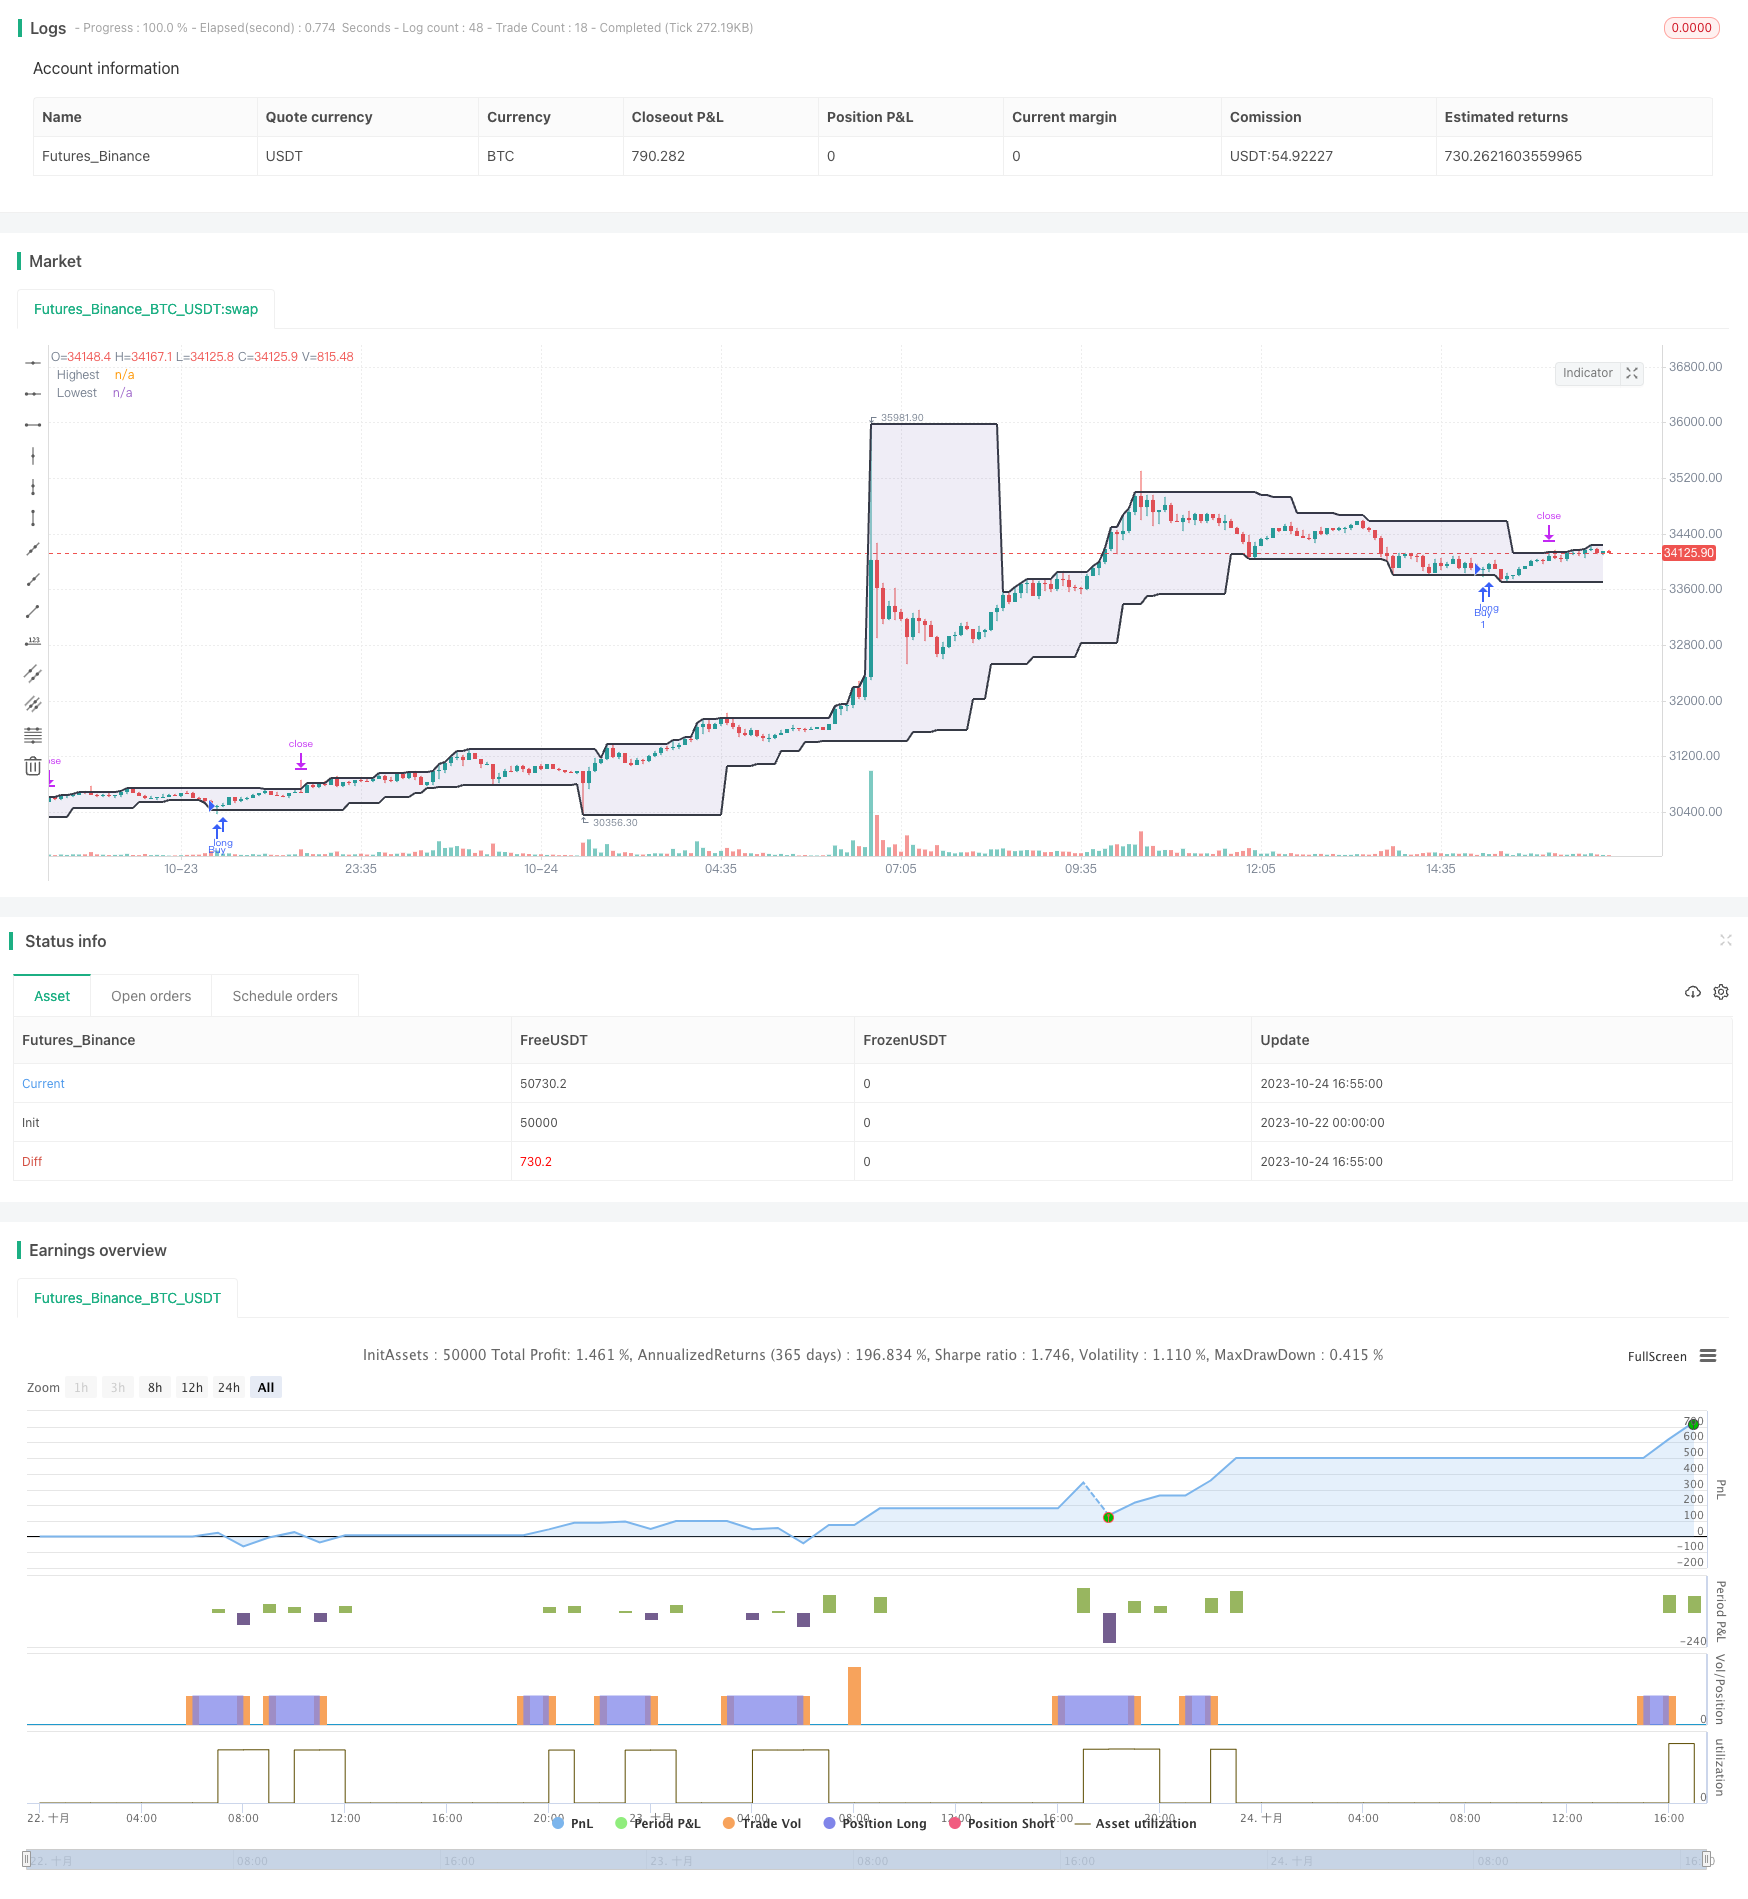
该策略通过计算一定周期内的最高价和最低价,形成上下轨,并在价格突破上轨时做多,在价格跌破下轨时平仓。该策略捕捉趋势的强势阶段,通过趋势突破来判断入场时机。
该策略首先计算过去20根K线的最高价和最低价,形成上轨和下轨。当当前K线收盘价高于上轨时,做多;当价格跌破下轨时,平仓止损。
具体来说,策略通过highest和lowest函数计算最近20根K线的最高价和最低价,形成范围。然后判断当前K线收盘价是否高于上轨,如果是则做多;如果价格跌破下轨,则平仓止损。
该策略依靠趋势突破来判断入场时机,属于趋势跟踪策略。它只做多不做空,适用于具有明显趋势特征的品种。
该策略具有以下优势:
-
策略思路简单清晰,容易理解实现。
-
利用趋势突破来判断入场时机,可捕捉趋势的强势阶段。
-
采用移动止损来控制风险,可有效限制单笔损失。
-
只做多不做空,适用于趋势明显的品种。
-
可自定义参数,调整周期长度和止损幅度。
该策略也存在以下风险:
-
无法判断趋势反转,可能造成追高杀入。
-
止损位置容易被瞬间大幅度价格跳空触发。
-
趋势变化时,可能产生多个小止损。
-
只做多不做空,无法利用下行趋势获利。
-
参数设置不当可能导致过于敏感或迟钝。
该策略可以从以下几个方面进行优化:
-
增加趋势判断指标,避免在趋势反转时仍然做多。例如加入MACD等指标判断趋势方向。
-
优化移动止损策略,设置风险控制更合理。例如采用随价格波动的移动止损。
-
增加空头策略,在下行趋势中也可以开仓做空获利。
-
对参数进行测试优化,找到最优参数组合。
-
增加自动参数优化功能,根据市场情况动态调整参数。
-
结合多个时间周期进行策略判断,避免被单一周期误导。
该策略整体思路清晰易懂,利用趋势突破来判断入场时机,可捕捉趋势的强势阶段。同时采用移动止损来控制风险。但该策略也存在一些风险,如趋势判断不准、止损被突破等问题。我们可以从优化趋势判断、止损策略、空头策略等方面进行改进,使策略更全面和稳定。
||
This strategy calculates the highest high and lowest low over a certain period to form upper and lower bands. It goes long when the price breaks above the upper band and closes the position when the price breaks below the lower band. The strategy aims to capture the strong trending phases by trading trend breakouts.
The strategy first calculates the highest high and lowest low over the past 20 bars to form the upper and lower bands. When the closing price of the current bar is above the upper band, it goes long. When the price breaks below the lower band, it closes the position.
Specifically, the strategy uses the highest and lowest functions to calculate the highest high and lowest low over the past 20 bars, forming a range. It then checks if the closing price of the current bar is above the upper band. If yes, it goes long. If the price breaks below the lower band, it exits the position.
The strategy relies on trend breakouts to determine entry signals. It is a trend following system that only goes long and does not short. It is suitable for strongly trending instruments.
The strategy has the following advantages:
-
The strategy logic is simple and easy to understand.
-
It captures strong trending phases by trading trend breakouts.
-
It uses a moving stop loss to control risks and limit losses.
-
It only goes long and does not short, suitable for trending markets.
-
Customizable parameters for period length and stop loss.
The strategy also has the following risks:
-
It cannot identify trend reversals and may result in buying at the top.
-
Stop loss can be easily triggered by large instant price gaps.
-
It may generate multiple small losses when the trend changes.
-
It only goes long and cannot profit from downtrends.
-
Improper parameter settings may cause oversensitivity or sluggishness.
The strategy can be improved in the following aspects:
-
Add trend identification indicators to avoid trading against reversals. E.g. MACD.
-
Optimize the stop loss strategy for better risk control. E.g. trailing stop loss.
-
Add short position logic to profit from downtrends.
-
Backtest and optimize parameters to find the best combination.
-
Add dynamic parameter optimization based on market conditions.
-
Incorporate analysis across multiple timeframes to avoid misleading by a single timeframe.
The strategy has clear and simple logic, capturing strong trends through breakouts. It controls risk via stop loss. However, it also has some weaknesses like inaccurate trend judgment and stop loss being triggered. We can improve it by enhancing trend identification, stop loss strategy, short positions, and parameter optimization to make the strategy more robust.
[/trans]
Strategy Arguments
| Argument | Default | Description |
|---|---|---|
| v_input_1 | 20 | Length |
| v_input_2 | true | Stop Loss Percentage |
Source (PineScript)
/*backtest
start: 2023-10-22 00:00:00
end: 2023-10-24 17:00:00
period: 5m
basePeriod: 1m
exchanges: [{"eid":"Futures_Binance","currency":"BTC_USDT"}]
*/

//@version=4
strategy("Donchian Wicks Strategy - Long Only with Customizable Donchian Exit and Stop Loss", "DWS", overlay = true)

// INPUTS
iLength = input(20, "Length", minval = 1)
stopLossPercent = input(1.0, "Stop Loss Percentage", type=input.float) / 100

// SETTING
float up = na
up := close > open ? high : nz(up[1])
float down = na
down := close < open ? low : nz(down[1])

highest = highest(up, iLength)
lowest = lowest(down, iLength)

// PLOT
p1 = plot(highest, "Highest", color.black, 2)
p2 = plot(lowest, "Lowest", color.black, 2)
fill(p1, p2, color.new(color.navy, 90), title="Range")

// ENTRY SIGNALS
wickDown = low < lowest

// STRATEGY IMPLEMENTATION
strategy.entry("Buy", strategy.long, when = wickDown)
strategy.exit("Sell at Donchian High", from_entry="Buy", limit=highest)

// Customizable Stop Loss
stopLossLevel = close * (1 - stopLossPercent)
strategy.exit("Stop Loss", from_entry="Buy", stop=stopLossLevel)
Detail
https://www.fmz.com/strategy/430573
Last Modified
2023-10-30 14:53:32
