Name
指数均线交叉策略Exponential-Moving-Average-Crossover-Strategy
Author
ChaoZhang
Strategy Description
指数均线交叉策略是一种追踪价格趋势的简单量化交易策略。它利用两个不同参数设置的指数移动平均线之间的交叉作为买入和卖出信号。当短期均线上穿长期均线时产生买入信号;当短期均线下穿长期均线时产生卖出信号。
该策略的核心逻辑基于均线理论。指数移动平均线能够有效平滑价格波动,判断价格趋势方向。快速均线能够快速响应价格变化;慢速均线提供价格趋势方向参考。当快速均线上穿慢速均线时,表示价格开始上涨,产生买入信号。当快速均线下穿慢速均线时,表示价格开始下跌,产生卖出信号。
具体来说,该策略首先定义两个指数移动平均线:fib_level和fib_price。 fib_level由用户输入设置,fib_price根据最近100个bar的最高价和最低价计算。当close价格上穿或下穿fib_price时,分别产生买入和卖出信号。同时设置止损点为近10个bar的最高价和最低价。
- 利用双均线系统判断价格趋势方向,避免产生错误信号
- 根据用户自行设置参数,可自定义策略
- 设置止损点有利于风险控制
- 均线产生滞后,可能错过价格反转点
- 双均线交叉次数多,会增加交易成本和滑点损失
- 止损点设置不当,可能过早止损或损失过大
可以通过优化均线参数,使用三均线系统,或结合其他指标判断来减少错误信号。同时适当宽松止损点,防止过于频繁止损。
该策略可以从以下几个方面进行优化:
-
优化均线周期参数设置。测试不同长度周期的参数组合,寻找最佳参数。
-
增加Volume等指标过滤。当Volume上涨时产生买入信号,Volume下跌时产生卖出信号,可以避免在价格剧烈波动时产生错误signals。
-
利用机器学习算法自动优化参数。将历史数据输入模型,训练得到更好的参数组合。
-
在止损位置加入移动止损机制。让止损线随着利润增加而上移,防止止损过早。
指数均线交叉策略整体来说是一个较为简单实用的量化交易策略。它利用均线的优势判断价格趋势,并设定止损来控制风险。该策略容易理解,参数设置灵活,适用于不同品种的量化交易。通过继续优化参数设置、增加过滤条件以及设置移动止损等,可以获得更好的策略效果。
||
The exponential moving average crossover strategy is a simple quantitative trading strategy that tracks price trends. It uses crosses of two exponential moving averages with different parameter settings as buy and sell signals. When the short-term EMA crosses above the long-term EMA, a buy signal is generated. When the short-term EMA crosses below the long-term EMA, a sell signal is generated.
The core logic of this strategy is based on the EMA theory. Exponential moving averages can effectively smooth price fluctuations and determine the direction of the price trend. The fast EMA responds quickly to price changes while the slow EMA provides a reference for the price trend direction. When the fast EMA crosses above the slow EMA, it indicates that prices have started to rise and a buy signal is generated. When the fast EMA crosses below the slow EMA, it indicates that prices have started to fall and a sell signal is generated.
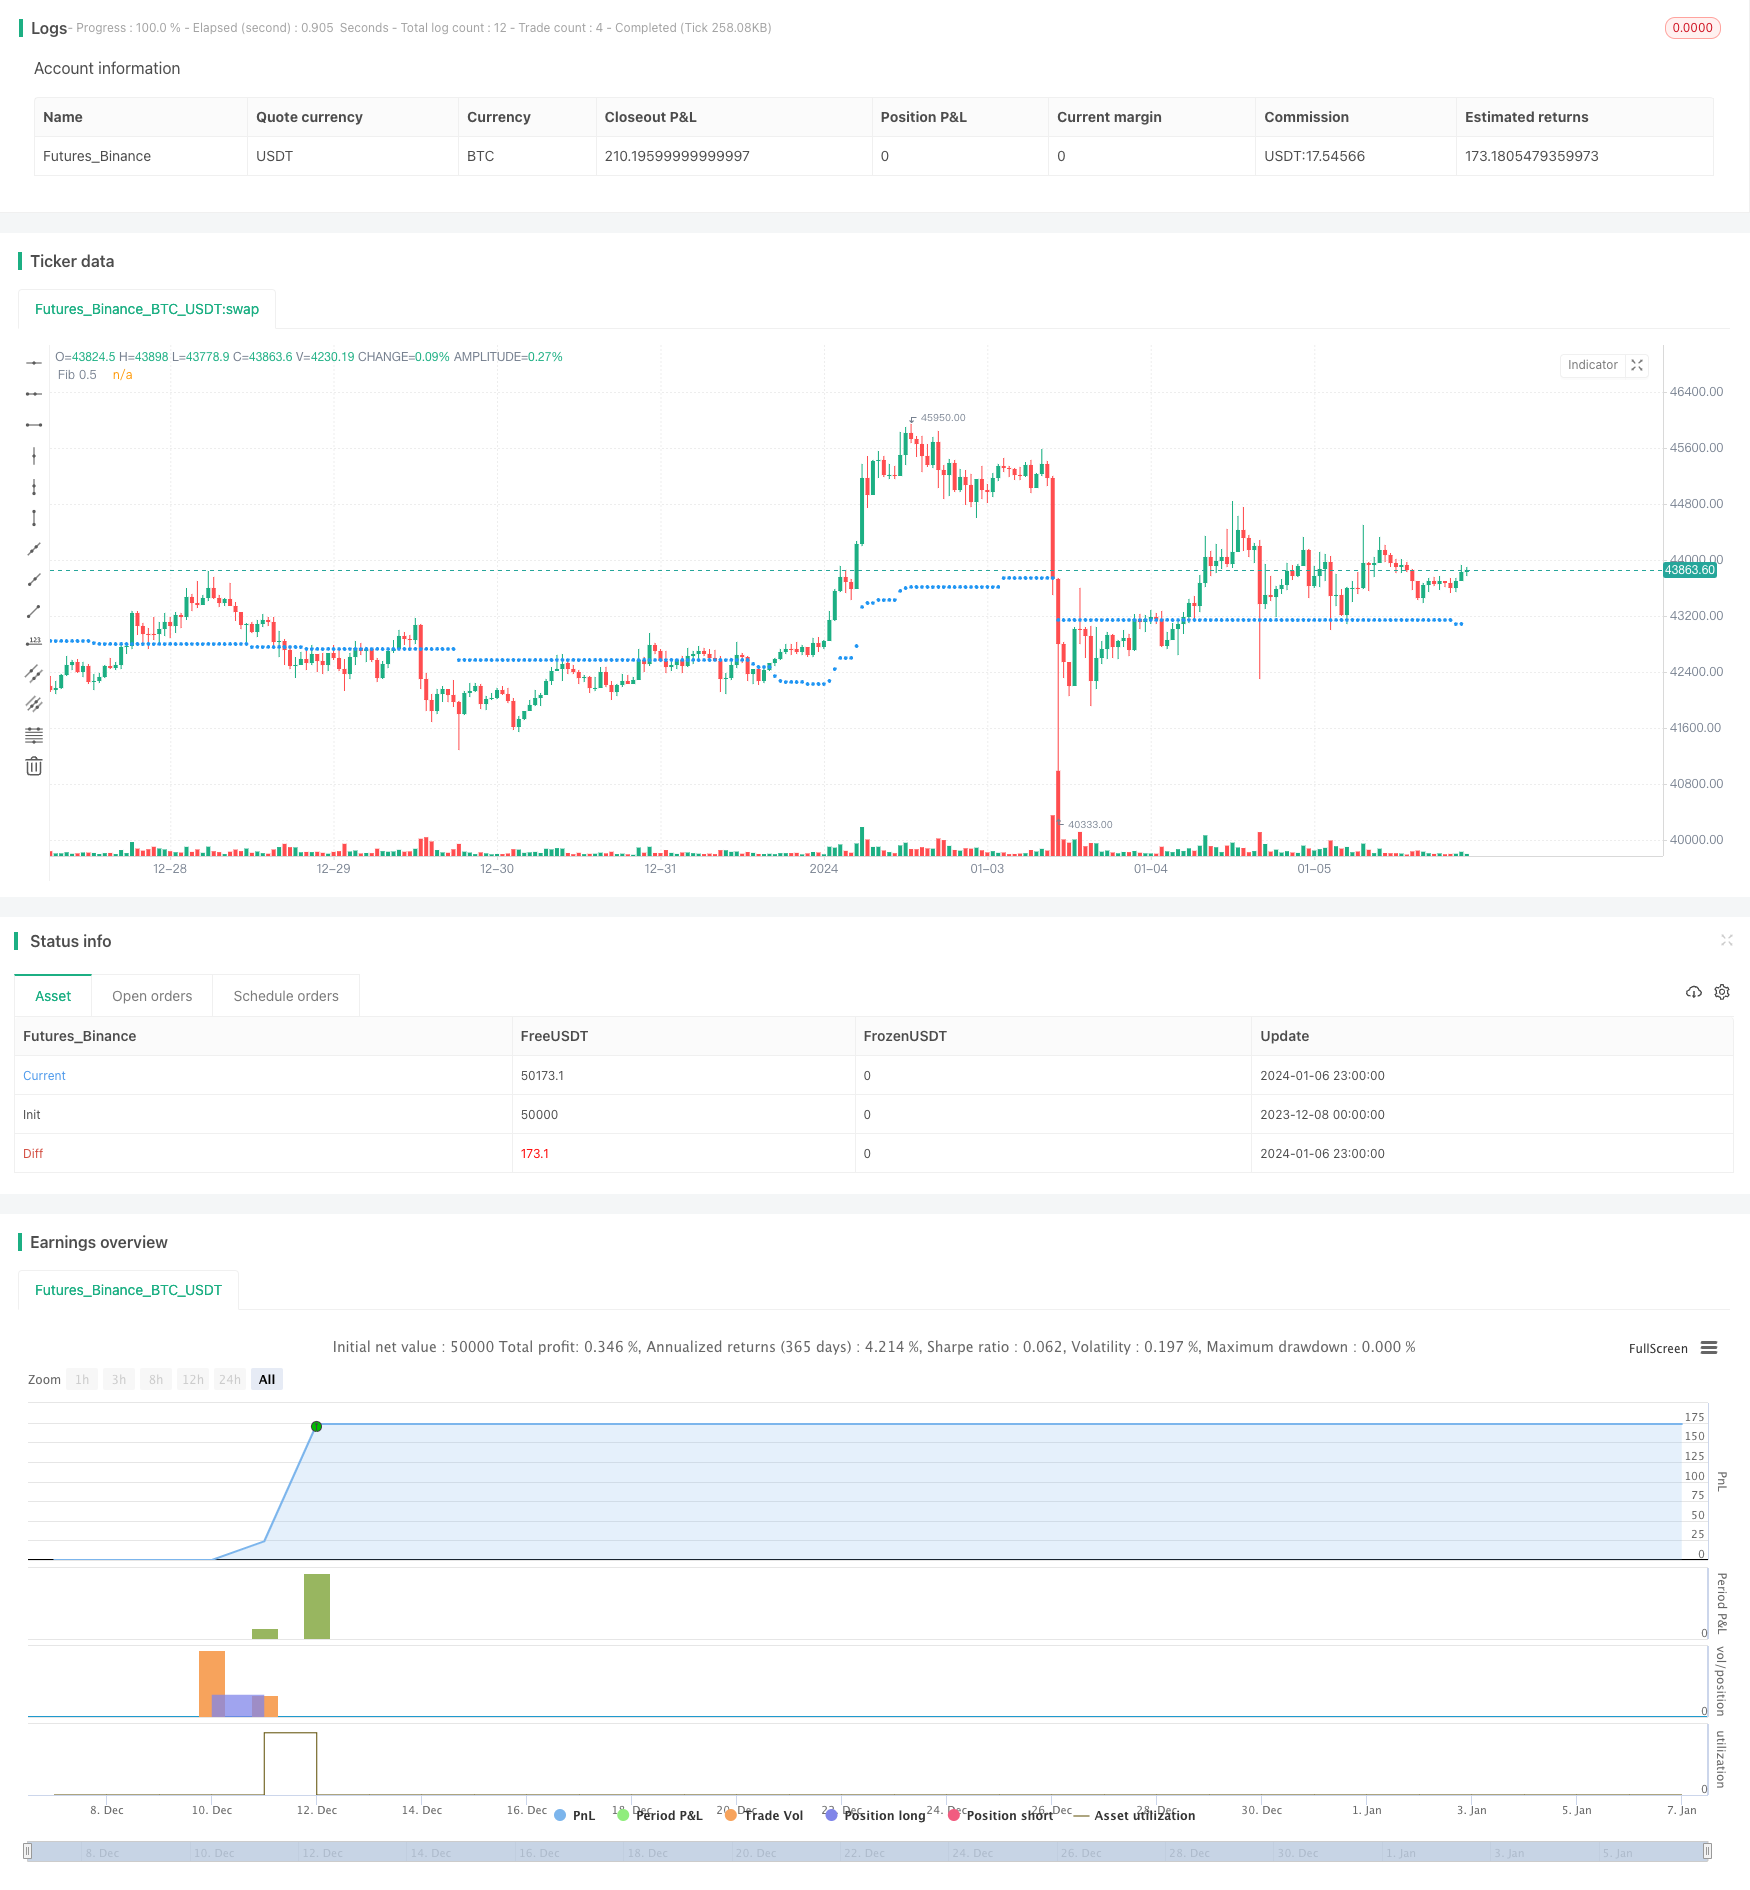
Specifically, this strategy first defines two exponential moving averages: fib_level and fib_price. fib_level is set by user input, and fib_price is calculated based on the highest and lowest prices of the most recent 100 bars. When the close price crosses above or below fib_price, buy and sell signals are generated, respectively. At the same time, the stop loss is set to the highest and lowest prices of the most recent 10 bars.
- Utilize dual EMA system to determine price trend direction and avoid wrong signals
- Customizable strategy with user-defined parameters
- Setting stop loss is beneficial for risk control
- EMA lag may miss price reversal points
- Frequent EMA crosses increase transaction costs and slippage losses
- Improper stop loss setting may cause premature stop loss or excessive losses
Risks can be reduced by optimizing EMA parameters, using triple EMA system, or combining with other indicators for signal confirmation. Also loosen the stop loss appropriately to prevent excessive early stop outs.
This strategy can be optimized from the following aspects:
-
Optimize EMA period parameters. Test different period combinations to find the best parameters.
-
Add Volume and other filters. Generate buy signals when Volume rises and sell signals when Volume falls to avoid wrong signals during sharp price spikes.
-
Utilize machine learning algorithms to automatically optimize parameters based on historical data.
-
Add trailing stop mechanism to stop loss placement. Move up stop loss line with increased profits to prevent premature stop out.
The exponential moving average crossover strategy is an easy-to-use quantitative trading strategy overall. It leverages the strengths of EMAs to determine price trends and sets stops to control risks. The strategy is easy to understand, flexible in parameters, and applicable for quantitative trading across different products. Further optimizations in parameter tuning, additional filters, and trailing stops can lead to even better strategy performance.
[/trans]
Strategy Arguments
| Argument | Default | Description |
|---|---|---|
| v_input_1 | 0.5 | Fibonacci Level |
Source (PineScript)
/*backtest
start: 2023-12-08 00:00:00
end: 2024-01-07 00:00:00
period: 1h
basePeriod: 15m
exchanges: [{"eid":"Futures_Binance","currency":"BTC_USDT"}]
*/

//@version=5
strategy("Fibonacci Strategy", overlay=true)

// Define Fibonacci 0.5 level
fib_level = input(0.5, title="Fibonacci Level")

// Calculate Fibonacci 0.5 level price
fib_price = ta.lowest(low, 100) + (ta.highest(high, 100) - ta.lowest(low, 100)) * fib_level

// Define entry and exit conditions
long_condition = ta.crossover(close, fib_price)
short_condition = ta.crossunder(close, fib_price)

// Set exit points (using previous high or low)
long_exit = ta.highest(high, 10)
short_exit = ta.lowest(low, 10)

// Plot Fibonacci 0.5 level
plot(fib_price, "Fib 0.5", color=color.blue, linewidth=1, style=plot.style_circles)

// Initialize variables
var inLong = false
var inShort = false

// Set trading signals
if (long_condition)
    if not inLong
        strategy.entry("Buy", strategy.long)
        inLong := true
    strategy.exit("Exit", "Buy", limit=long_exit)

if (short_condition)
    if not inShort
        strategy.entry("Sell", strategy.short)
        inShort := true
    strategy.exit("Exit", "Sell", limit=short_exit)

if (ta.crossover(close, long_exit) or ta.crossunder(close, short_exit))
    inLong := false
    inShort := false
Detail
https://www.fmz.com/strategy/438021
Last Modified
2024-01-08 11:30:21
