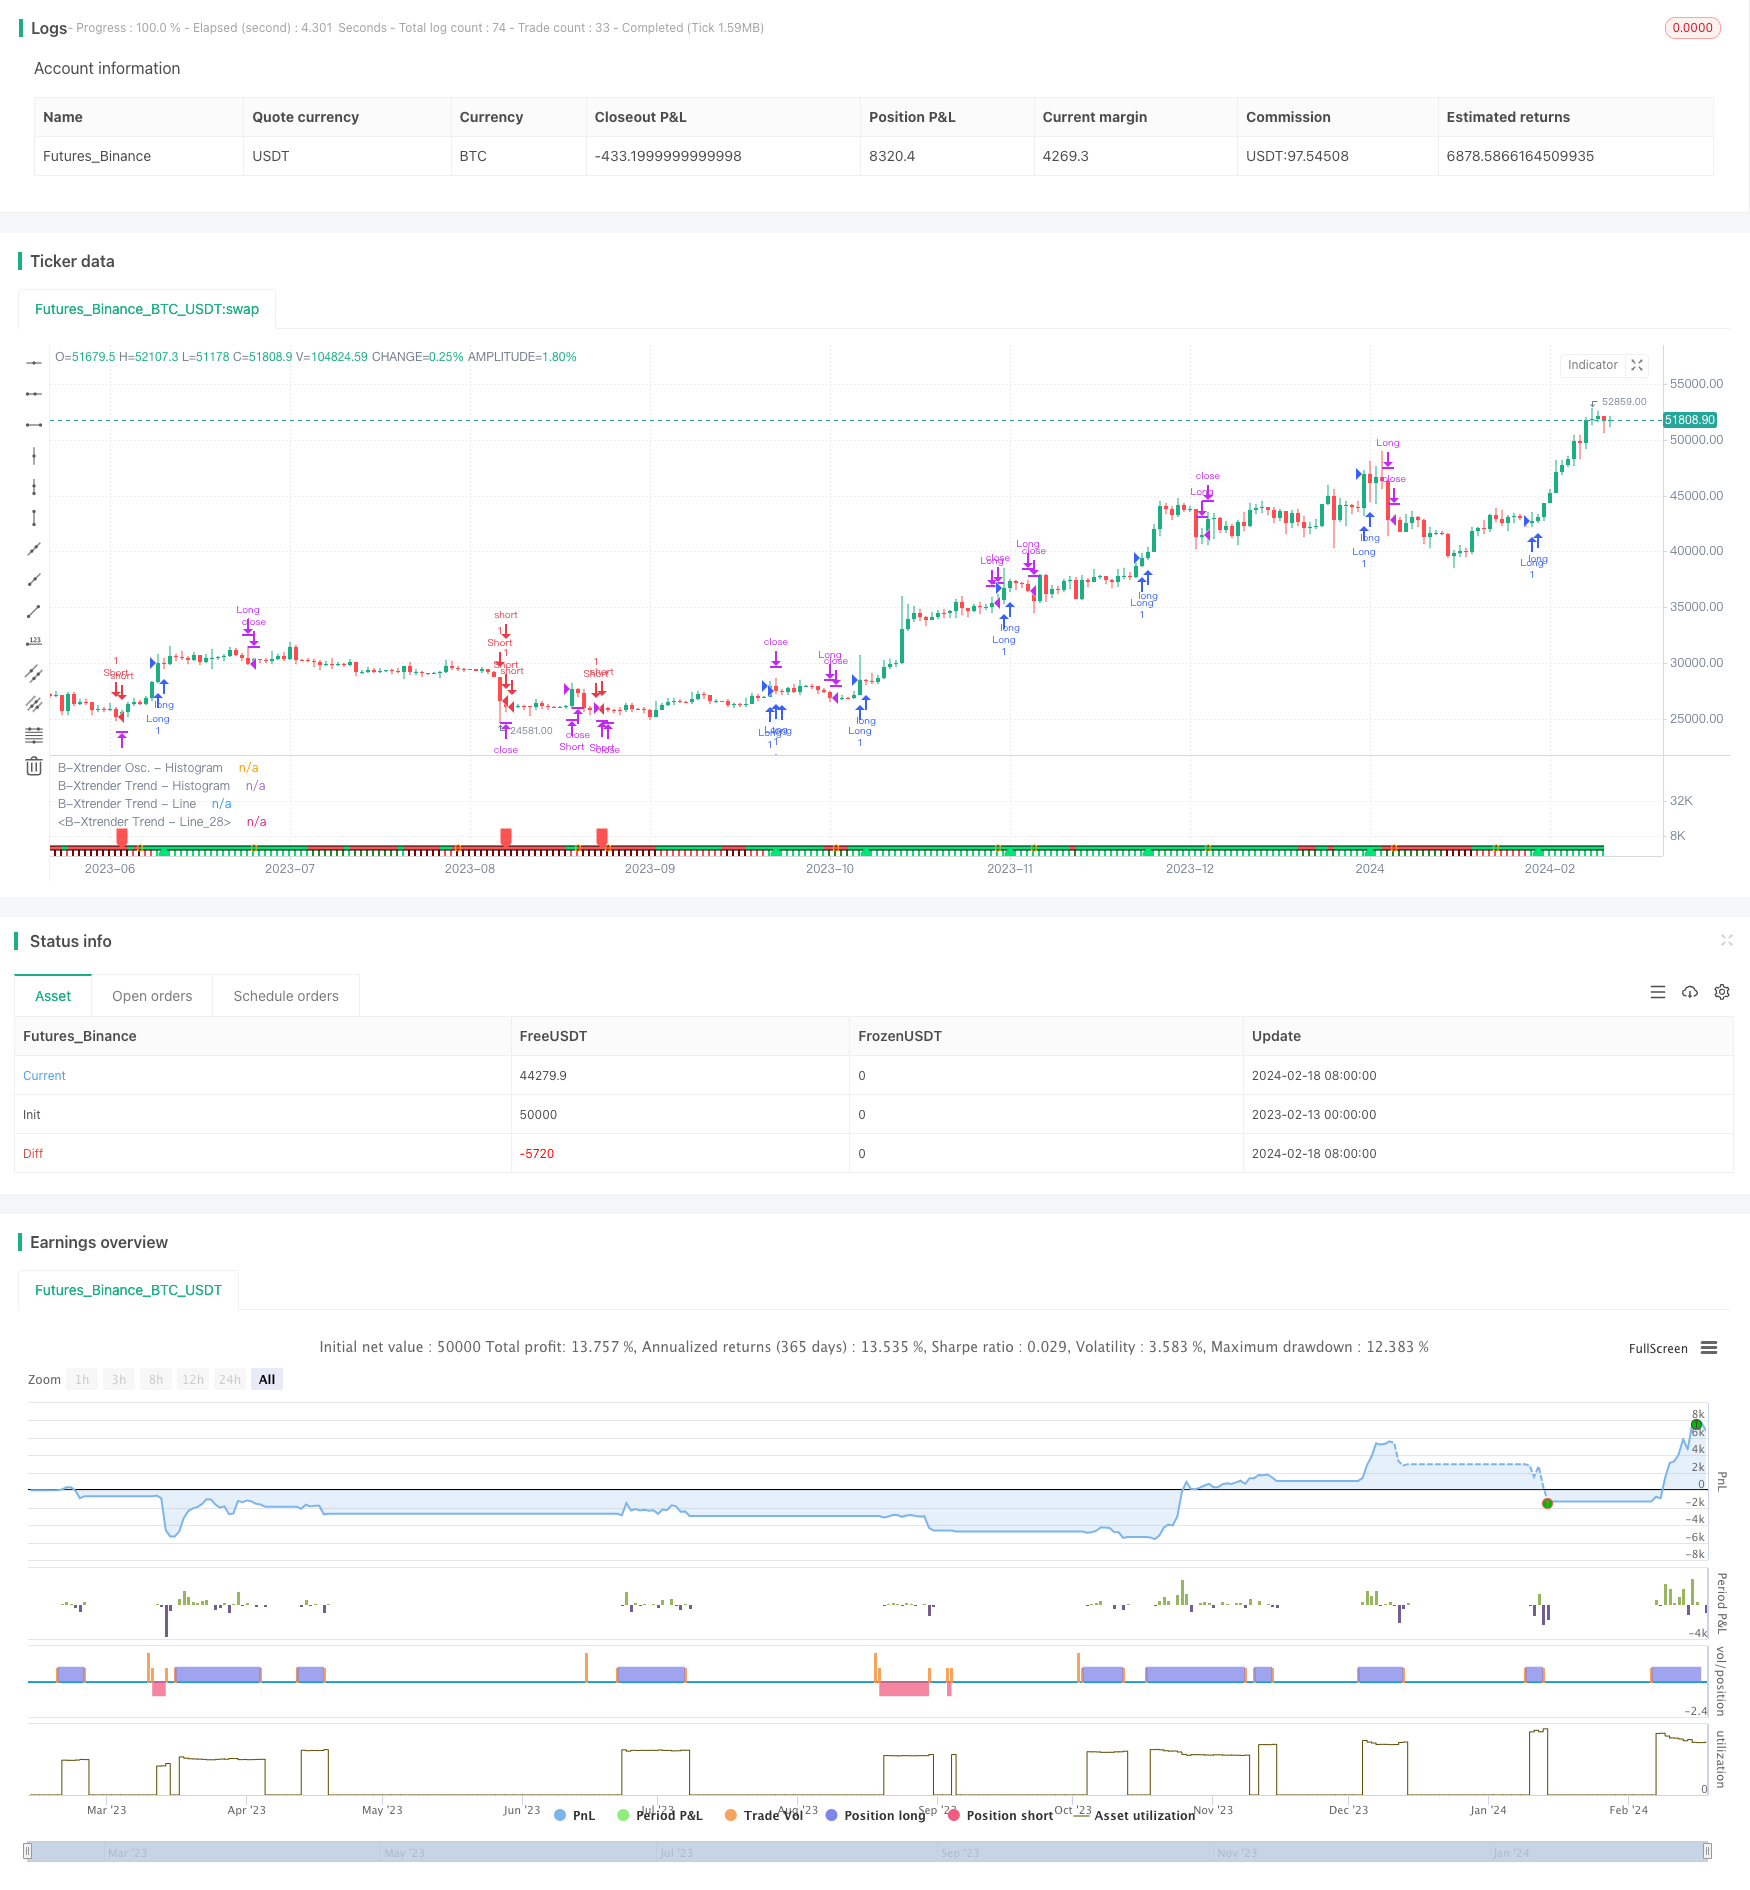
Name
指数均线交叉B-Xtrender策略B-Xtrender-Exponential-Moving-Average-Crossover-Strategy
Author
ChaoZhang
Strategy Description
该策略是一个基于指数均线交叉原理的交易策略。它同时结合了RSI指标和均线过滤器,形成了一套较为完整的趋势跟踪和反转交易体系。
- 利用指数移动平均线的快慢交叉形成交易信号。快线参数为5和20日线的EMA交叉,慢线参数为20和15日线的EMA交叉。
- 快线上穿慢线时做多,快线下穿慢线时做空。采用RSI指标进行二次验证,只有当RSI也同向交叉时才证实交易信号的有效性。
- 加入200日移动平均线作为过滤器,只有价格突破该均线时才会发出交易信号,从而避免了震荡行情下的多次虚假交叉。
- 双EMA交叉结合RSI指标,大幅提高信号的可靠性,降低了虚假信号率。
- 通过快慢EMA参数的搭配,既考虑了交易信号的灵敏度,也确保了信号的稳定性。
- 均线过滤器的加入,可有效过滤震荡行情下的噪音,避免不必要的交易。
- EMA是一种滞后指标,在价格剧烈变动时会有明显的滞后。这会导致亏损加大或信号被漏掉的风险。
- RSI参数设置不当也会导致信号产生滞后。
- 均线过滤虽然可避免震荡市,但在趋势开始阶段也可能会过滤掉早期entry机会。
- 动态调整EMA参数,在不同周期选择最优参数组合。
- 尝试其他指标如MACD等与RSI进行组合。
- 优化均线过滤器参数,在去噪与获取机会之间找到平衡。
该策略总体来说是一个打造较为完备的指数移动平均线交易体系。它在获取交易信号的基础上,额外引入RSI指标进行多层验证。这无疑可大幅提高信号质量,是一个值得学习与优化的策略。当然由于本身指标滞后的特点,也应注意防范止损不及时等风险。
||
This is a trading strategy based on the exponential moving average (EMA) crossover principle. It also incorporates the RSI indicator and moving average filters to form a relatively complete trend following and reversal trading system.
- Generate trading signals through fast and slow EMA crossovers. The fast line uses 5 and 20-day EMA crossover while the slow line uses 20 and 15-day EMA crossover.
- Go long when the fast line crosses above the slow line, and go short when the fast line crosses below. Use RSI for secondary confirmation, only taking signals when RSI also crosses over in the same direction.
- Add 200-day moving average filter to avoid signals during choppy periods. Trades are only taken when price breaks through this baseline MA first.
- RSI confirmation significantly enhances signal reliability and lowers false signals.
- EMA parameter selection balances sensitivity and stability.
- MA filter removes noise to avoid unnecessary trades.
- EMA has lagging issues on sharp price swings, increasing losses or missing signals.
- Poor RSI settings could also introduce signal lags.
- MA filter may filter out early trend signals.
- Dynamically optimize EMA parameters across cycles.
- Experiment with other indicators like MACD to combine with RSI.
- Fine tune MA filter parameter for optimal noise reduction and opportunity capture.
This is an overall solid strategy in building a complete EMA trading system, with additional RSI confirmation to boost signal quality. It's worth studying and optimizing. However, inherent indicator lag risks should also be managed through proper stop loss.
[/trans]
Strategy Arguments
| Argument | Default | Description |
|---|---|---|
| v_input_1 | 5 | [Short] L1 |
| v_input_2 | 20 | [Short] L2 |
| v_input_3 | 15 | [Short] L3 |
| v_input_4 | 20 | [Long] L1 |
| v_input_5 | 15 | [Long] L2 |
| v_input_6 | true | [MA Filter] Yes/No |
| v_input_7 | 200 | [MA Filter] length |
| v_input_8 | 0 | [MA Filter] type: EMA |
| v_input_9 | 20 | [TSL-%] Percent |
Source (PineScript)
/*backtest
start: 2023-02-13 00:00:00
end: 2024-02-19 00:00:00
period: 1d
basePeriod: 1h
exchanges: [{"eid":"Futures_Binance","currency":"BTC_USDT"}]
*/

// This source code is subject to the terms of the Mozilla Public License 2.0 at https://mozilla.org/MPL/2.0/
// © QuantTherapy
//@version=4
strategy("B-Xtrender [Backtest Edition] @QuantTherapy")

i_short_l1  = input(5 , title="[Short] L1")
i_short_l2  = input(20, title="[Short] L2")
i_short_l3  = input(15, title="[Short] L3")

i_long_l1   = input(20, title="[Long] L1")
i_long_l2   = input(15, title="[Long] L2")

i_ma_use    = input(true , title="[MA Filter] Yes/No" )
i_ma_len    = input(200  , title="[MA Filter] length" )
i_ma_type   = input("EMA", title="[MA Filter] type", options = ["SMA", "EMA"])

shortTermXtrender = rsi( ema(close, i_short_l1) - ema(close, i_short_l2), i_short_l3 ) - 50
longTermXtrender  = rsi( ema(close, i_long_l1), i_long_l2 ) - 50

shortXtrenderCol = shortTermXtrender > 0 ? shortTermXtrender > shortTermXtrender[1] ? color.lime : #228B22 : shortTermXtrender > shortTermXtrender[1] ? color.red : #8B0000
plot(shortTermXtrender, color=shortXtrenderCol, style=plot.style_columns, linewidth=1, title="B-Xtrender Osc. - Histogram", transp = 40)

longXtrenderCol   = longTermXtrender> 0 ? longTermXtrender > longTermXtrender[1] ? color.lime : #228B22 : longTermXtrender > longTermXtrender[1] ? color.red : #8B0000
macollongXtrenderCol =  longTermXtrender > longTermXtrender[1] ? color.lime : color.red
plot(longTermXtrender , color=longXtrenderCol, style=plot.style_columns, linewidth=2, title="B-Xtrender Trend - Histogram", transp = 90)

plot(longTermXtrender , color=#000000             , style=plot.style_line, linewidth=5, title="B-Xtrender Trend - Line", transp = 100)
plot(longTermXtrender , color=macollongXtrenderCol, style=plot.style_line, linewidth=3, title="B-Xtrender Trend - Line", transp = 100)

// --- Initialize MA Filter
ma = i_ma_type == "EMA" ? ema(close, i_ma_len) : sma(close, i_ma_len)
maFilterLong = true
maFilterShort = true
if i_ma_use
    maFilterLong  := close > ma ? true : false
    maFilterShort := close < ma ? true : false

long  = shortTermXtrender > 0 and longTermXtrender > 0 and maFilterLong
closeLong = shortTermXtrender < 0 or longTermXtrender < 0
short = shortTermXtrender < 0 and longTermXtrender < 0 and maFilterShort
closeShort = shortTermXtrender > 0 or longTermXtrender > 0

plotshape(long[1]==true  and long[2]==false  ? 0 : na , location=location.absolute, style=shape.labelup  , color=color.lime, size=size.small, transp=10)
plotshape(short[1]==true and short[2]==false ? 0 : na, location=location.absolute, style=shape.labeldown, color=color.red , size=size.small, transp=10)
plotshape(closeLong[1]==true and closeLong[2]==false
 or closeShort[1]==true and closeShort[2]==false ? 0 : na, location=location.absolute, style=shape.circle, color=color.orange , size=size.small)

i_perc     = input(defval = 20.0, title = "[TSL-%] Percent"  , minval = 0.1 )
i_src = close // constant for calculation
sl_val = i_src * i_perc / 100

strategy.entry("Long", strategy.long, when = long )
strategy.close("Long", when = closeLong)

strategy.entry("Short", strategy.short, when = short)
strategy.close("Short", when = closeShort)

// Calculate SL
longStopPrice = 0.0, shortStopPrice = 0.0
longStopPrice := if (strategy.position_size > 0)
    stopValue = close - sl_val
    max(stopValue, longStopPrice[1])
else
    0

shortStopPrice := if (strategy.position_size < 0)
    stopValue = close + sl_val
    min(stopValue, shortStopPrice[1])
else
    syminfo.mintick*1000000

// For TSL Visualisation on Chart
// plot(series=(strategy.position_size > 0) ? longStopPrice : na,
//      color=color.fuchsia, style = plot.style_circles,
//      linewidth=1, title="Long Trail Stop")

// plot(series=(strategy.position_size < 0) ? shortStopPrice : na,
//      color=color.fuchsia, style = plot.style_circles,
//      linewidth=1, title="Short Trail Stop")

if (strategy.position_size > 0)
    strategy.exit(id="TSL Long", stop=longStopPrice)

if (strategy.position_size < 0)
    strategy.exit(id="TSL Short", stop=shortStopPrice)
Detail
https://www.fmz.com/strategy/442236
Last Modified
2024-02-20 14:45:17
