Name
指数移动平均交叉策略Exponential-Moving-Average-Crossover-Strategy
Author
ChaoZhang
Strategy Description
[trans]
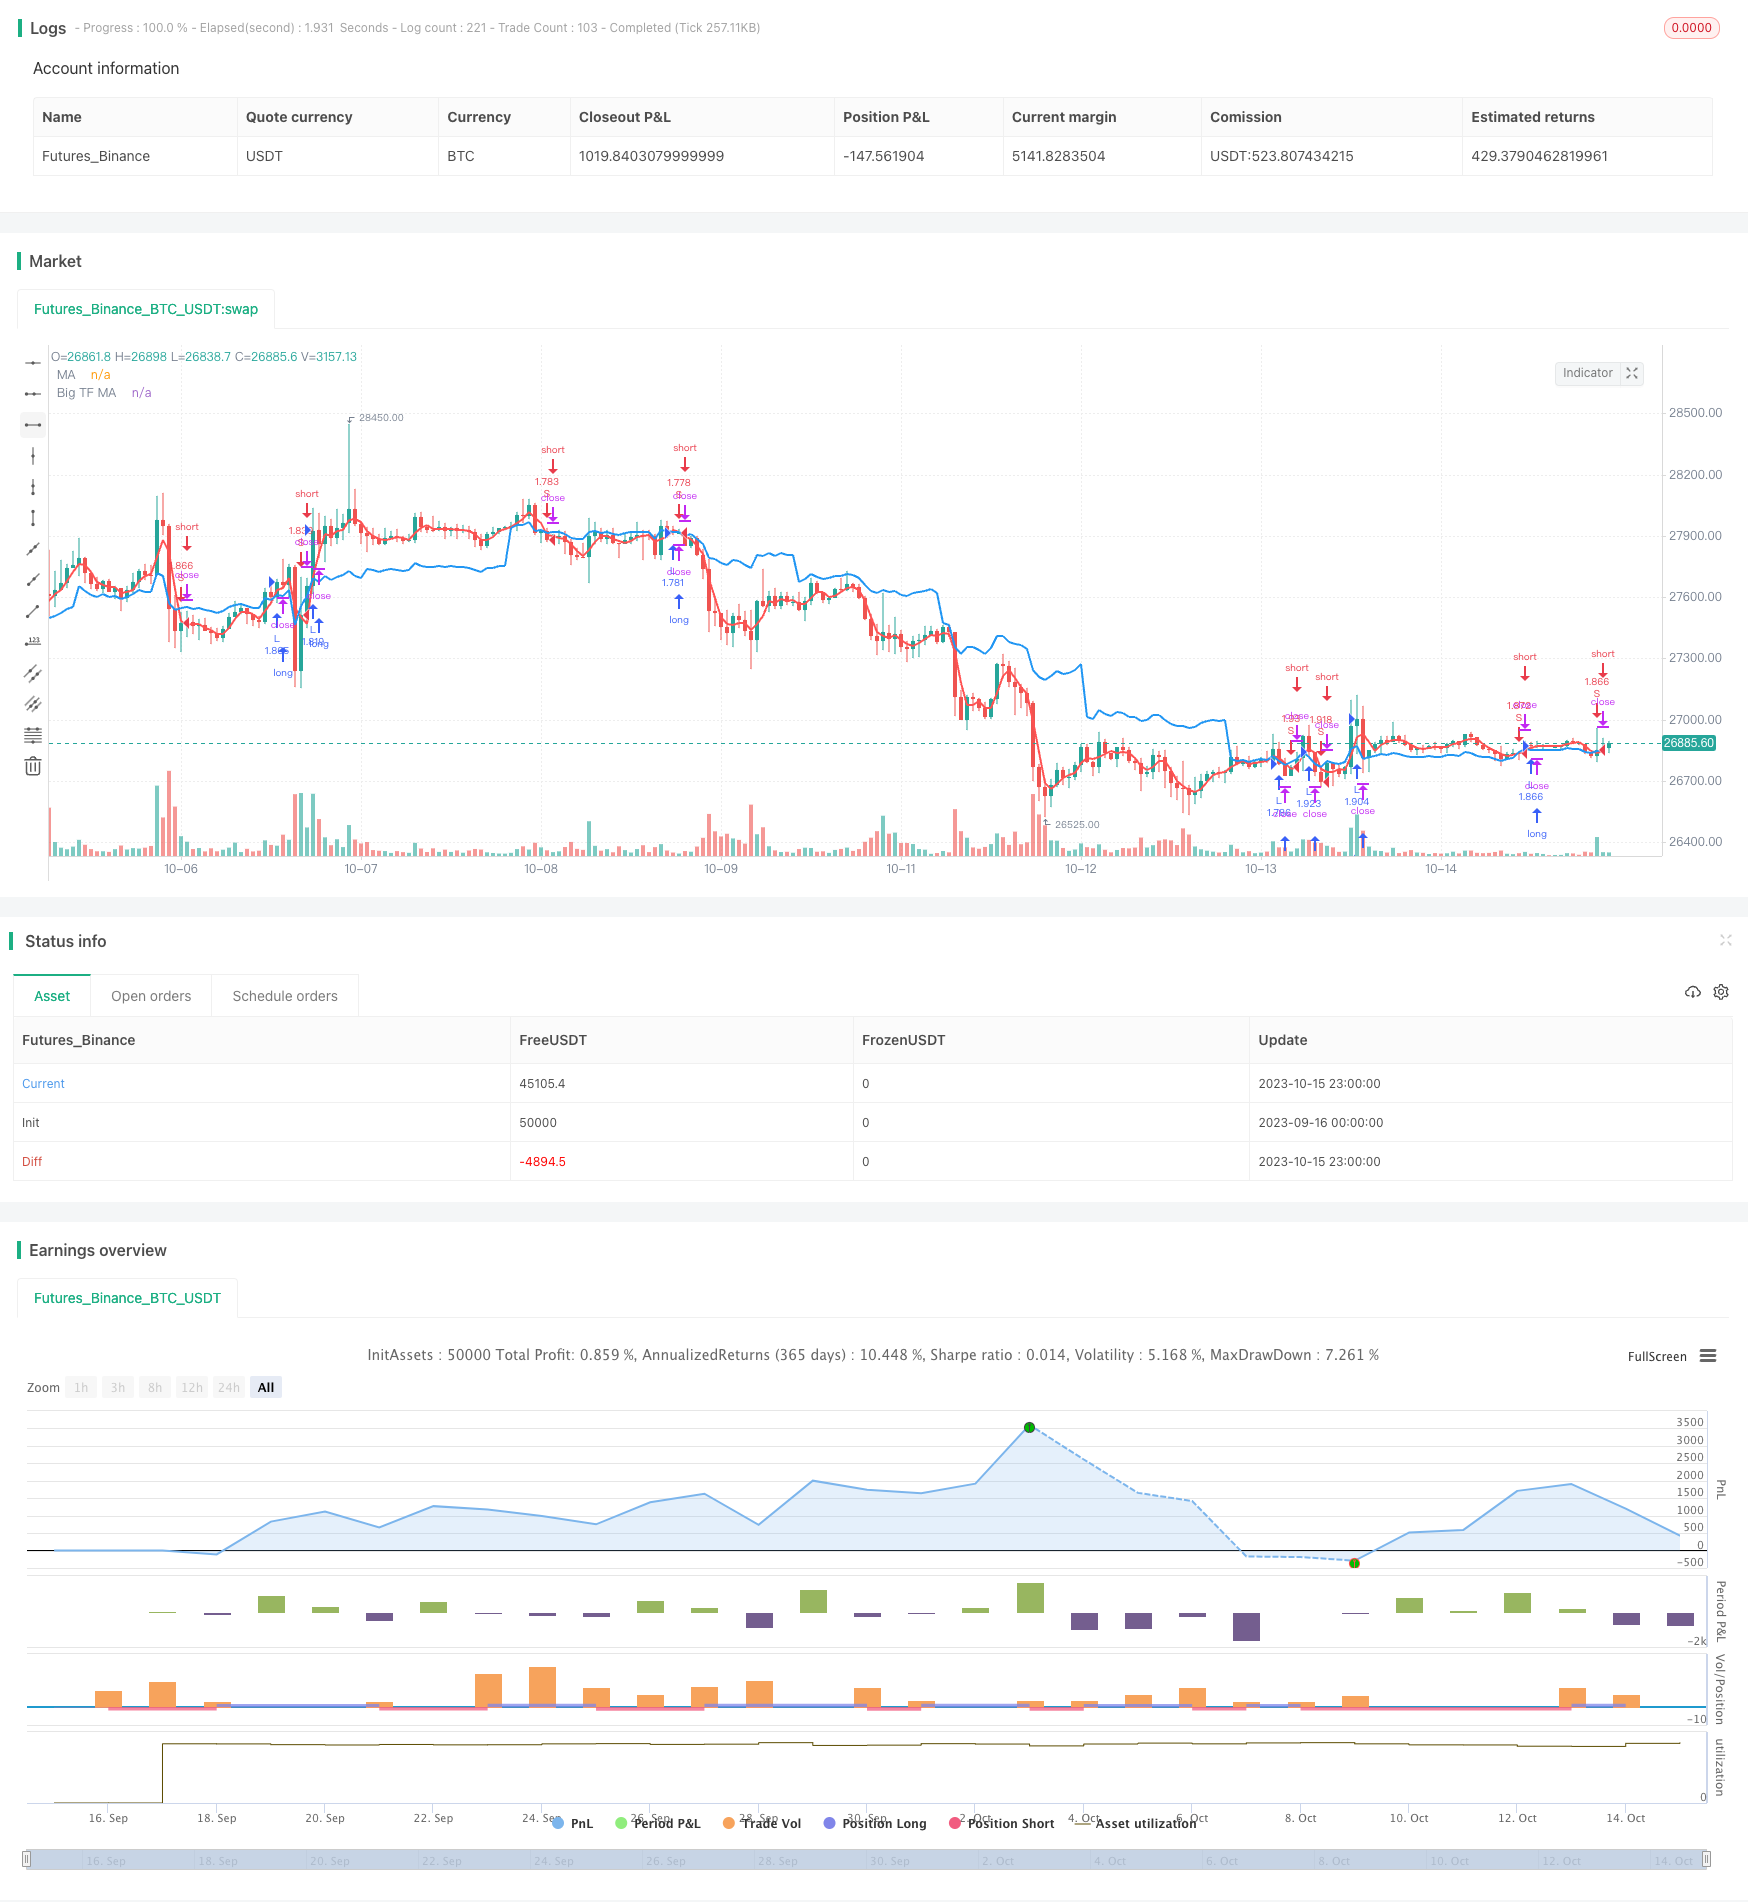
这是一个基于两个不同时间周期的指数移动平均线交叉做多空的自动交易策略。它使用简单的技术指标,非常适合新手学习和实践。
该策略使用两个指数移动平均线,一个是大时间周期的均线,一个是当前周期的均线。当当前周期的均线上穿大周期的均线时,做多;当当前周期的均线下穿大周期的均线时,做空。
具体来说,策略首先定义两个均线参数:
- tf - 大时间周期,默认为日线
- len - 均线周期长度,默认为3
然后分别计算出两个EMA:
- ma1 - 大周期日线上的3日EMA
- ma2 - 当前周期的3日EMA
最后,进入交易逻辑:
- 当ma2 > ma1时,做多
- 当ma2 < ma1时,做空
这样,通过不同时间周期均线的交叉来判断趋势方向,进行自动交易。
该策略具有以下优势:
- 原理简单,容易理解和实现,非常适合新手学习。
- 顺势交易,遵循趋势,可以获得较好的盈利。
- 采用指数移动平均线,对价格变化更敏感,可以及时捕捉趋势转折。
- 不同周期均线组合,可以发挥各自的优势,提高系统稳定性。
- 无需过多参数,容易测试和优化,实盘运作方便。
该策略也存在一些风险:
- 跟踪趋势性不强,可能因震荡市场而被套牢。
- 双均线交叉存在时滞,可能错过部分机会。
- 无法有效过滤两均线交叉乱序的情况。
- 仅基于简单均线,对复杂市场难以适应。
可以通过设置止损,优化参数组合,或加入其它指标等方式来降低风险。
该策略可以从以下几个方面进行优化:
- 测试不同的大周期均线参数,找出最佳组合。
- 增加成交量指标过滤,避免虚假信号。
- 结合趋势指标,提高持仓力度和操作效率。
- 设置自适应止损点,以控制单笔损失。
- 优化仓位管理,根据市场调整仓位大小。
- 加入机器学习模型,使策略更智能化。
该指数移动平均交叉策略运用简单指标捕捉趋势,适合新手学习实践。优化空间较大,可以引入更多技术指标和模型进行改进,开发出具有更强效果的量化交易策略。
||
This is an automatic trading strategy that goes long or short based on the crossover of two exponential moving averages (EMAs) with different time periods. It uses simple technical indicators and is very suitable for beginners to learn and practice.
The strategy uses two EMAs, one is the EMA on a bigger time frame, and the other is the EMA on the current time frame. When the current EMA crosses above the bigger EMA, it goes long. When the current EMA crosses below the bigger EMA, it goes short.
Specifically, the strategy first defines two EMA parameters:
- tf - The bigger time frame, default daily.
- len - The EMA period length, default 3.
Then it calculates two EMAs:
- ma1 - 3-day EMA on the daily time frame.
- ma2 - 3-day EMA on the current time frame.
Finally, it enters trades based on:
- When ma2 > ma1, it goes long.
- When ma2 < ma1, it goes short.
By judging the trend direction through crossovers between two EMAs of different periods, it automates trading.
The strategy has the following advantages:
- Simple principle, easy to understand and implement, very suitable for beginners.
- Trend following, obeying the trend, can make decent profits.
- Using EMAs, more sensitive to price changes, can timely capture trend reversals.
- Combination of EMAs of different periods can utilize their respective strengths and improve system stability.
- No need for too many parameters, easy to test and optimize, convenient for live trading.
The strategy also has some risks:
- Weak trend following ability, may be whipsawed in ranging markets.
- Lagging in double EMA crossovers, may miss some opportunities.
- Cannot effectively filter disorderly crossovers between two EMAs.
- Relies merely on simple EMAs, hard to adapt to complex markets.
Risks can be reduced by setting stop loss, optimizing parameters, adding other indicators etc.
The strategy can be optimized in the following aspects:
- Test different big period EMA parameters to find the optimal combination.
- Add volume filter to avoid false signals.
- Incorporate trend indicators to increase position sizing and efficiency.
- Set adaptive stop loss to control single trade loss.
- Optimize position sizing according to market conditions.
- Add machine learning models to make the strategy more intelligent.
The EMA crossover strategy captures trends with simple indicators, suitable for beginners to learn and practice. Has large room for optimization by introducing more technical indicators and models to develop more effective quantitative trading strategies.
[/trans]
Strategy Arguments
| Argument | Default | Description |
|---|---|---|
| v_input_1 | true | Long |
| v_input_2 | true | Short |
| v_input_3 | 100 | Lot |
| v_input_4 | D | Big Timeframe |
| v_input_5 | 3 | MA length |
| v_input_6_close | 0 | MA Source: close |
| v_input_7 | 1900 | From Year |
| v_input_8 | 2100 | To Year |
| v_input_9 | true | From Month |
| v_input_10 | 12 | To Month |
| v_input_11 | true | From day |
| v_input_12 | 31 | To day |
Source (PineScript)
/*backtest
start: 2023-09-16 00:00:00
end: 2023-10-16 00:00:00
period: 1h
basePeriod: 15m
exchanges: [{"eid":"Futures_Binance","currency":"BTC_USDT"}]
*/

//@version=3
strategy("Noro's Singapore Strategy", shorttitle = "Singapore str", overlay = true, default_qty_type = strategy.percent_of_equity, default_qty_value = 100, pyramiding = 0)

//Settings
needlong = input(true, defval = true, title = "Long")
needshort = input(true, defval = true, title = "Short")
capital = input(100, defval = 100, minval = 1, maxval = 10000, title = "Lot")
tf = input("D", title = "Big Timeframe")
len = input(3, minval = 1, title = "MA length")
src = input(close, title = "MA Source")
fromyear = input(1900, defval = 1900, minval = 1900, maxval = 2100, title = "From Year")
toyear = input(2100, defval = 2100, minval = 1900, maxval = 2100, title = "To Year")
frommonth = input(01, defval = 01, minval = 01, maxval = 12, title = "From Month")
tomonth = input(12, defval = 12, minval = 01, maxval = 12, title = "To Month")
fromday = input(01, defval = 01, minval = 01, maxval = 31, title = "From day")
today = input(31, defval = 31, minval = 01, maxval = 31, title = "To day")

//MAs
ma1 = request.security(syminfo.tickerid, tf, sma(src, len))
ma2 = sma(src, len)
plot(ma1, linewidth = 2, color = blue, title = "Big TF MA")
plot(ma2, linewidth = 2, color = red, title = "MA")

//Trading
size = strategy.position_size
lot = 0.0
lot := size != size[1] ? strategy.equity / close * capital / 100 : lot[1]

if ma2 > ma1
    strategy.entry("L", strategy.long, needlong ? lot : 0, when = (time > timestamp(fromyear, frommonth, fromday, 00, 00) and time < timestamp(toyear, tomonth, today, 23, 59)))
if ma2 < ma1
    strategy.entry("S", strategy.short, needshort ? lot : 0, when = (time > timestamp(fromyear, frommonth, fromday, 00, 00) and time < timestamp(toyear, tomonth, today, 23, 59)))
if time > timestamp(toyear, tomonth, today, 23, 59)
    strategy.close_all()
Detail
https://www.fmz.com/strategy/429502
Last Modified
2023-10-17 16:55:10
