Name
振荡平衡策略Oscillation-Balance-Strategy
Author
ChaoZhang
Strategy Description
[trans]
振荡平衡策略是一种利用加权移动平均线和基本回看期来预测下一时刻价格走势的简单策略。它通过计算当前收盘价相对开盘价的位置比例,然后计算不同周期的指数移动平均线,最后结合历史数据判断价格的大概走势。
该策略首先计算收盘价相对开盘价的位置比例:BoP = (close - open) / (high - low),然后分别计算3、6、9、12、18周期的指数移动平均线。
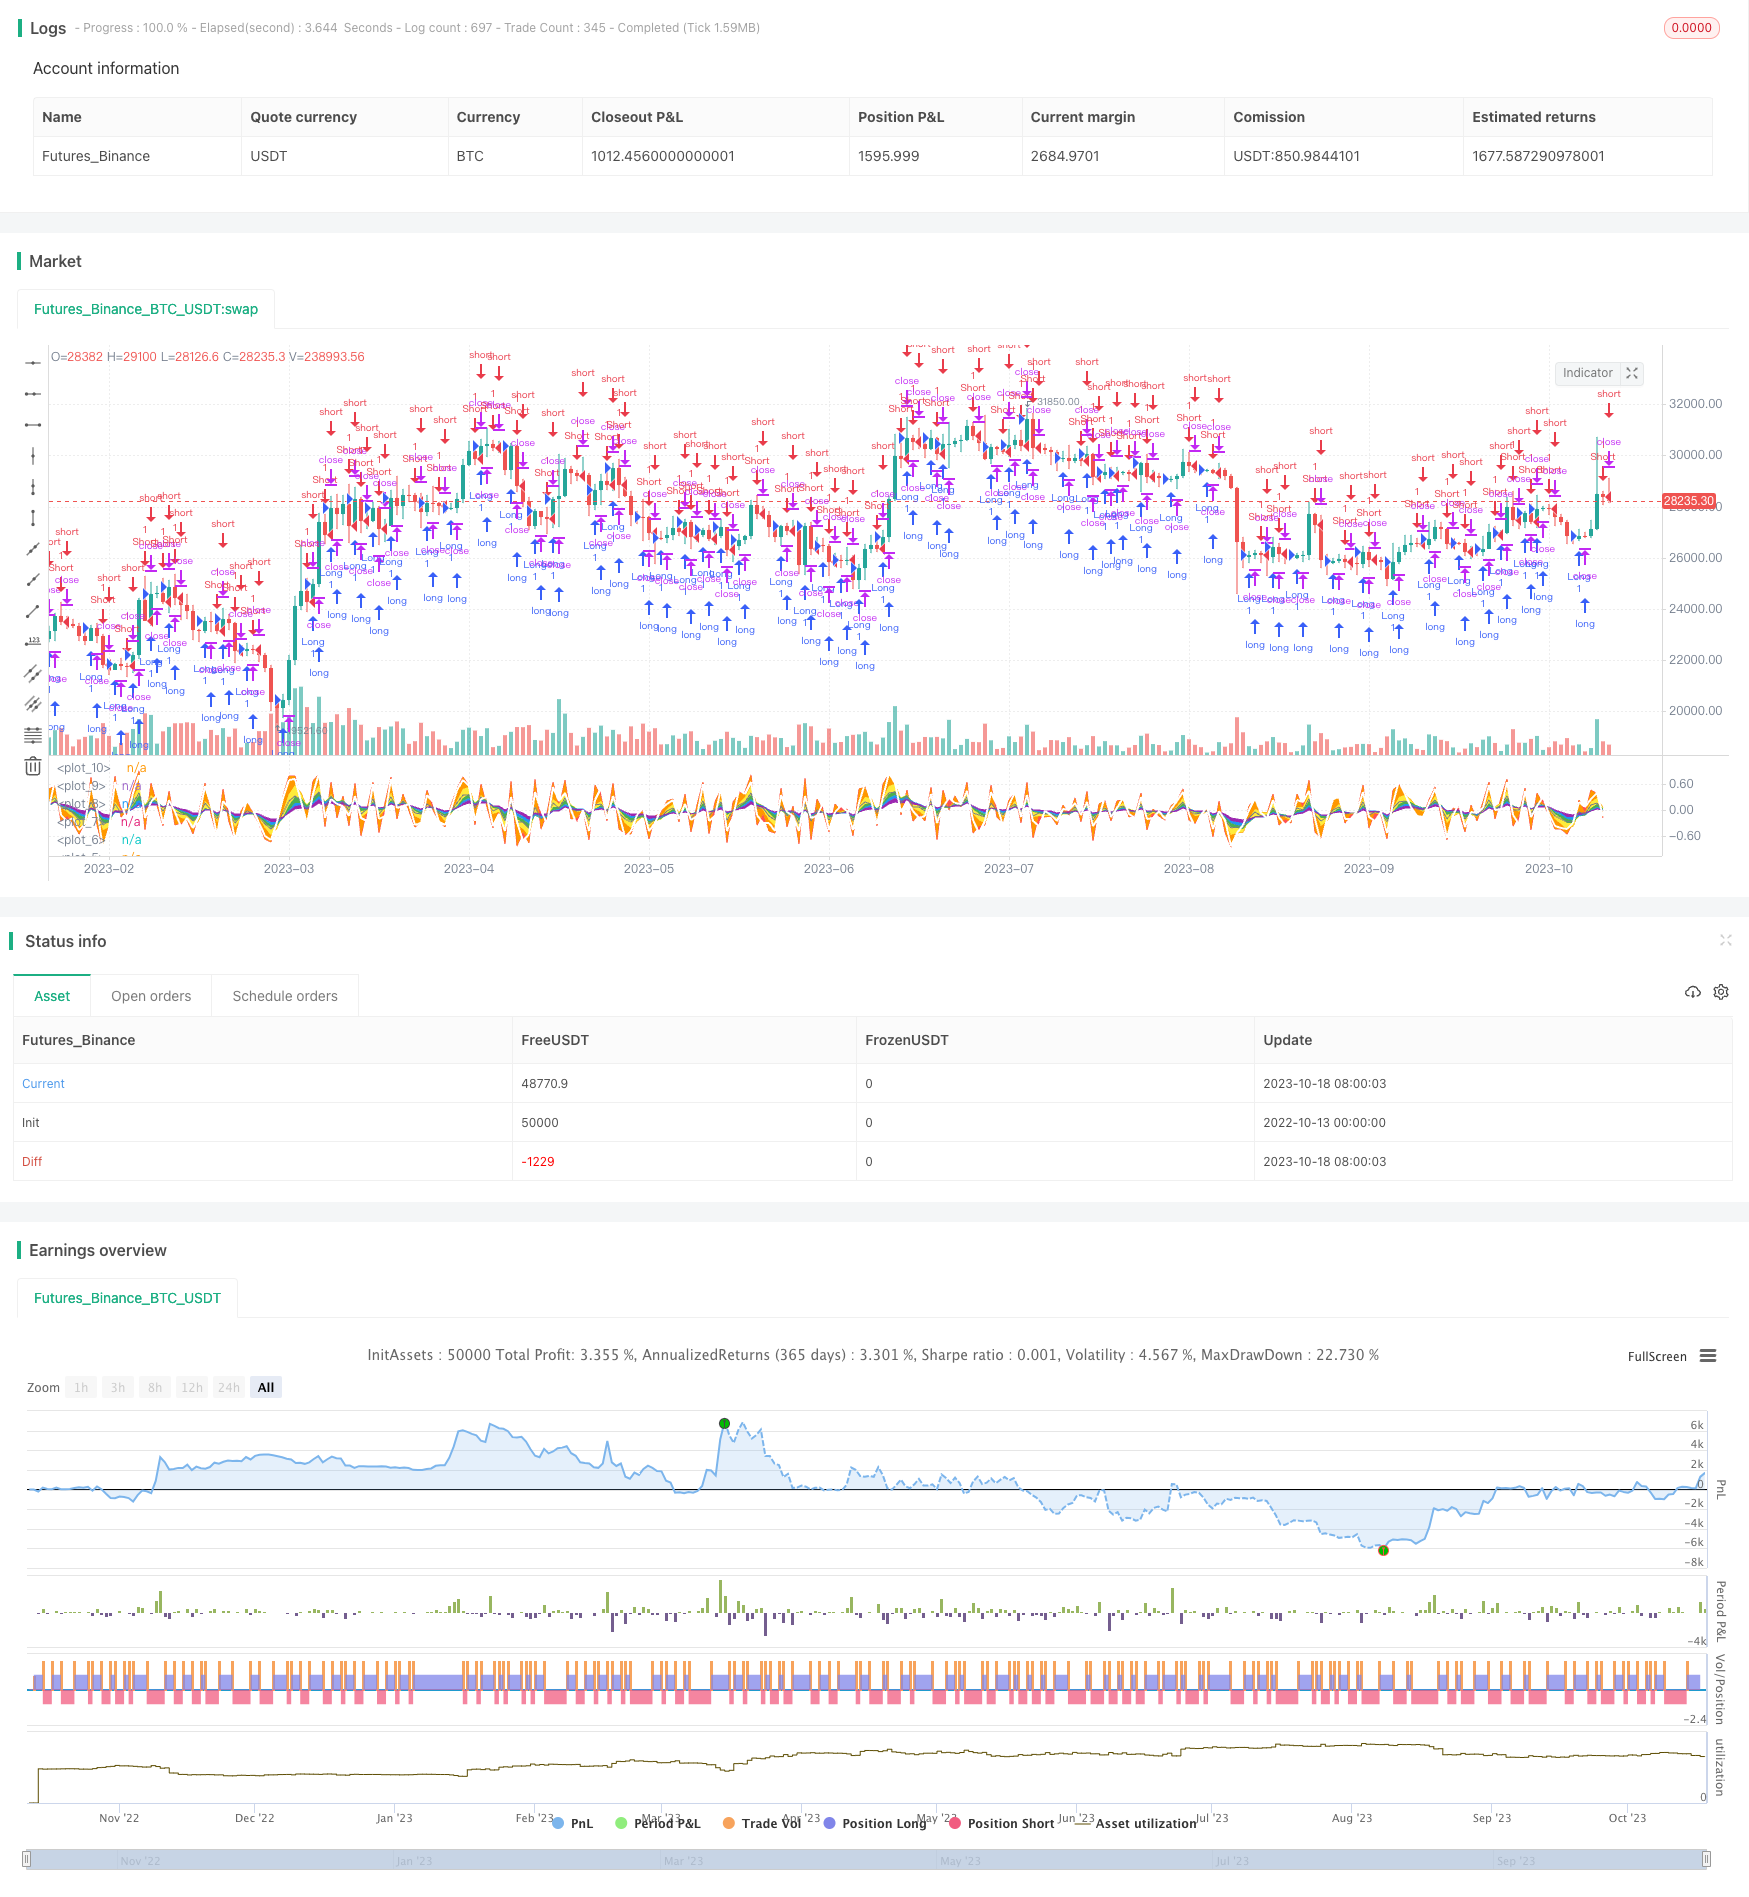
通过绘制不同颜色的移动平均线,可以看到短周期线优先发生方向转换,长周期线提供支持和阻力。填充不同移动平均线之间的区域,可以更直观地看到价格在不同均线之间的振荡。
再计算这些均线的算术平均值,得到一个综合均线。然后看这个综合均线在过去两个周期的变化,预测它在下个周期的走势。如果综合均线上涨,那么可以做多;如果下跌,可以做空。
这样,就利用历史数据计算出一个大概的未来走势预测。虽然非常简单,但结合视觉上的均线和填充,可以直观地看到价格的振荡情况。
该策略有以下优势:
-
原理简单,容易理解和实现。
-
将复杂的价格历史聚合到简单的综合均线上,通过均线的方向判断买卖点。
-
多种周期的均线组合,提供更全面的参考。短周期线确定具体买卖时机,长周期线决定大趋势。
-
通过填充均线之间的区域,形成直观的视觉效果,可以清晰看到价格的振荡。
-
不需要设置止损和止盈,避免过多无谓交易。
该策略也存在以下风险:
-
预测仅基于过去数据,无法确定未来必然发生。需要结合趋势和关键价位进行验证。
-
若突发事件导致价格急速变动,预测结果会不准确。需要做好风险控制。
-
多种均线可能产生混乱信号,需要优化权重。
-
交易频率可能过高,需要控制interval来减少不必要交易。
-
策略信号发生滞后,可能导致进入过晚和止损过早。
该策略可以从以下几个方面进行优化:
-
对均线的权重进行优化,使得信号更清晰。例如增大中长线周期均线的权重。
-
添加趋势指标的确认,避免逆势交易。例如使用ADX判断趋势强弱。
-
在关键支撑阻力区域添加过滤条件,减少错误信号。
-
优化买卖条件,避免无谓开仓。可以设置趋势过滤或者增加volume确认。
-
优化止损方式,例如采用曲线止损或ATR止损。
-
添加情绪指标避免追高杀跌。例如看多空指标、资金流向等。
-
控制interval,降低交易频率。或优化交易次数,避免过多交易。
振荡平衡策略通过计算价格的振荡指标,结合多周期均线的视觉效果,形成简单直观的买卖点判断方法。虽然存在预测滞后和判错风险,但可通过添加过滤条件、止损方式等进行优化,在趋势交易时提供辅助REFERENCE。该策略适合短线频繁交易,以及视觉形态分析者。
||
The Oscillation Balance strategy is a simple strategy that uses weighted moving averages and basic lookback periods to predict price movement in the next tick. It calculates the current close position relative to the open based on high and low, then computes exponential moving averages of different periods, and finally judges the general price trend based on historical data.
The strategy first calculates the close position relative to open: BoP = (close - open) / (high - low). Then it calculates the EMAs of periods 3, 6, 9, 12, and 18.
Drawing EMAs in different colors shows that shorter period lines change direction first, while longer period lines provide support and resistance. Filling the areas between EMAs makes it more intuitive to see the price oscillation between the lines.
It further takes the arithmetic mean of these EMAs to get a comprehensive line. Looking at the change of this line in the past two periods, it predicts the trend in the next period. If the comprehensive line rises, go long. If it falls, go short.
This way, it estimates a general future trend based on historical data. Although very simple, the visual EMAs and fillings clearly show the price oscillation.
The advantages of this strategy include:
-
The principle is simple and easy to understand and implement.
-
It aggregates complex price history into a simple comprehensive line for judging entry and exit points by direction.
-
The combination of multiple period EMAs provides more comprehensive references. Short period lines determine specific entry while long period ones decide general trend.
-
Filling between EMAs forms an intuitive visual effect for seeing clear price oscillation.
-
No need to set stop loss or take profit, avoiding unnecessary trades.
The risks of this strategy include:
-
The prediction is solely based on past data, not ensuring future occurrence. It needs confirmation with trends and key levels.
-
Sudden price changes from events may render inaccurate predictions. Proper risk control is required.
-
Multiple EMAs can generate confused signals. Weights need to be optimized.
-
High trading frequency may happen and interval control is needed to reduce unnecessary trading.
-
The strategy signals lag, possibly causing late entry and premature stop loss.
The strategy can be optimized in the following aspects:
-
Optimize the EMA weights for clearer signals. For example, increase weights for medium and long term EMAs.
-
Add trend indicator confirmation to avoid counter trend trades. Such as using ADX to determine trend strength.
-
Add filters at key support and resistance levels to reduce false signals.
-
Optimize entry rules to avoid unnecessary opening positions. Trend filter or volume confirmation can be added.
-
Optimize stop loss methods like curve stop loss or ATR stop loss.
-
Add sentiment indicators to avoid chasing tops and bottoms. For example, long/short ratio and fund flow.
-
Control interval to lower trading frequency. Or optimize number of trades to avoid overtrading.
The Oscillation Balance strategy judges entry and exit points simply and intuitively by calculating price oscillation and visualizing EMAs of multiple periods. Although risks like prediction lag and wrong signals exist, it can be optimized by adding filters, stop loss methods etc. It provides useful references when trend trading. This strategy suits frequent short-term traders and visual pattern analyzers.
[/trans]
Source (PineScript)
/*backtest
start: 2022-10-13 00:00:00
end: 2023-10-19 00:00:00
period: 1d
basePeriod: 1h
exchanges: [{"eid":"Futures_Binance","currency":"BTC_USDT"}]
*/

//@version=4
strategy(title="Balance of Power", format=format.price, precision=2)

BoP = (close - open) / (high - low)
p1 = plot(ema(BoP,18),color=color.purple)
p2 = plot(ema(BoP,12),color=color.blue)
p3 = plot(ema(BoP,9),color=color.green)
p4 = plot(ema(BoP,6),color=color.yellow)
p5 = plot(ema(BoP,3),color=color.orange)
p6 = plot(BoP, color=color.red)


sumEMA = (avg(BoP,ema(BoP,3),ema(BoP,6),ema(BoP,9),ema(BoP,12),ema(BoP,18)))
plot(sumEMA,color=color.gray)

fill(p1,p2,color.purple)
fill(p2,p3,color.blue)
fill(p3,p4,color.green)
fill(p4,p5,color.yellow)
fill(p5,p6,color.orange)


projected = sumEMA + (sumEMA - sumEMA[2])
p7 = plot(projected, linewidth=2, color=color.white)
fill(p6,p7,color.red)

//strategy.exit("exitx","Exit",when=cross(projected,0))

strategy.entry("Long",true,1,when=crossover(projected,0))
strategy.entry("Short",false,0,when=crossunder(projected,0))
Detail
https://www.fmz.com/strategy/429780
Last Modified
2023-10-20 17:03:08
