Name
支撑阻力趋势追踪策略Support-and-Resistance-Trend-Tracking-Strategy
Author
ChaoZhang
Strategy Description
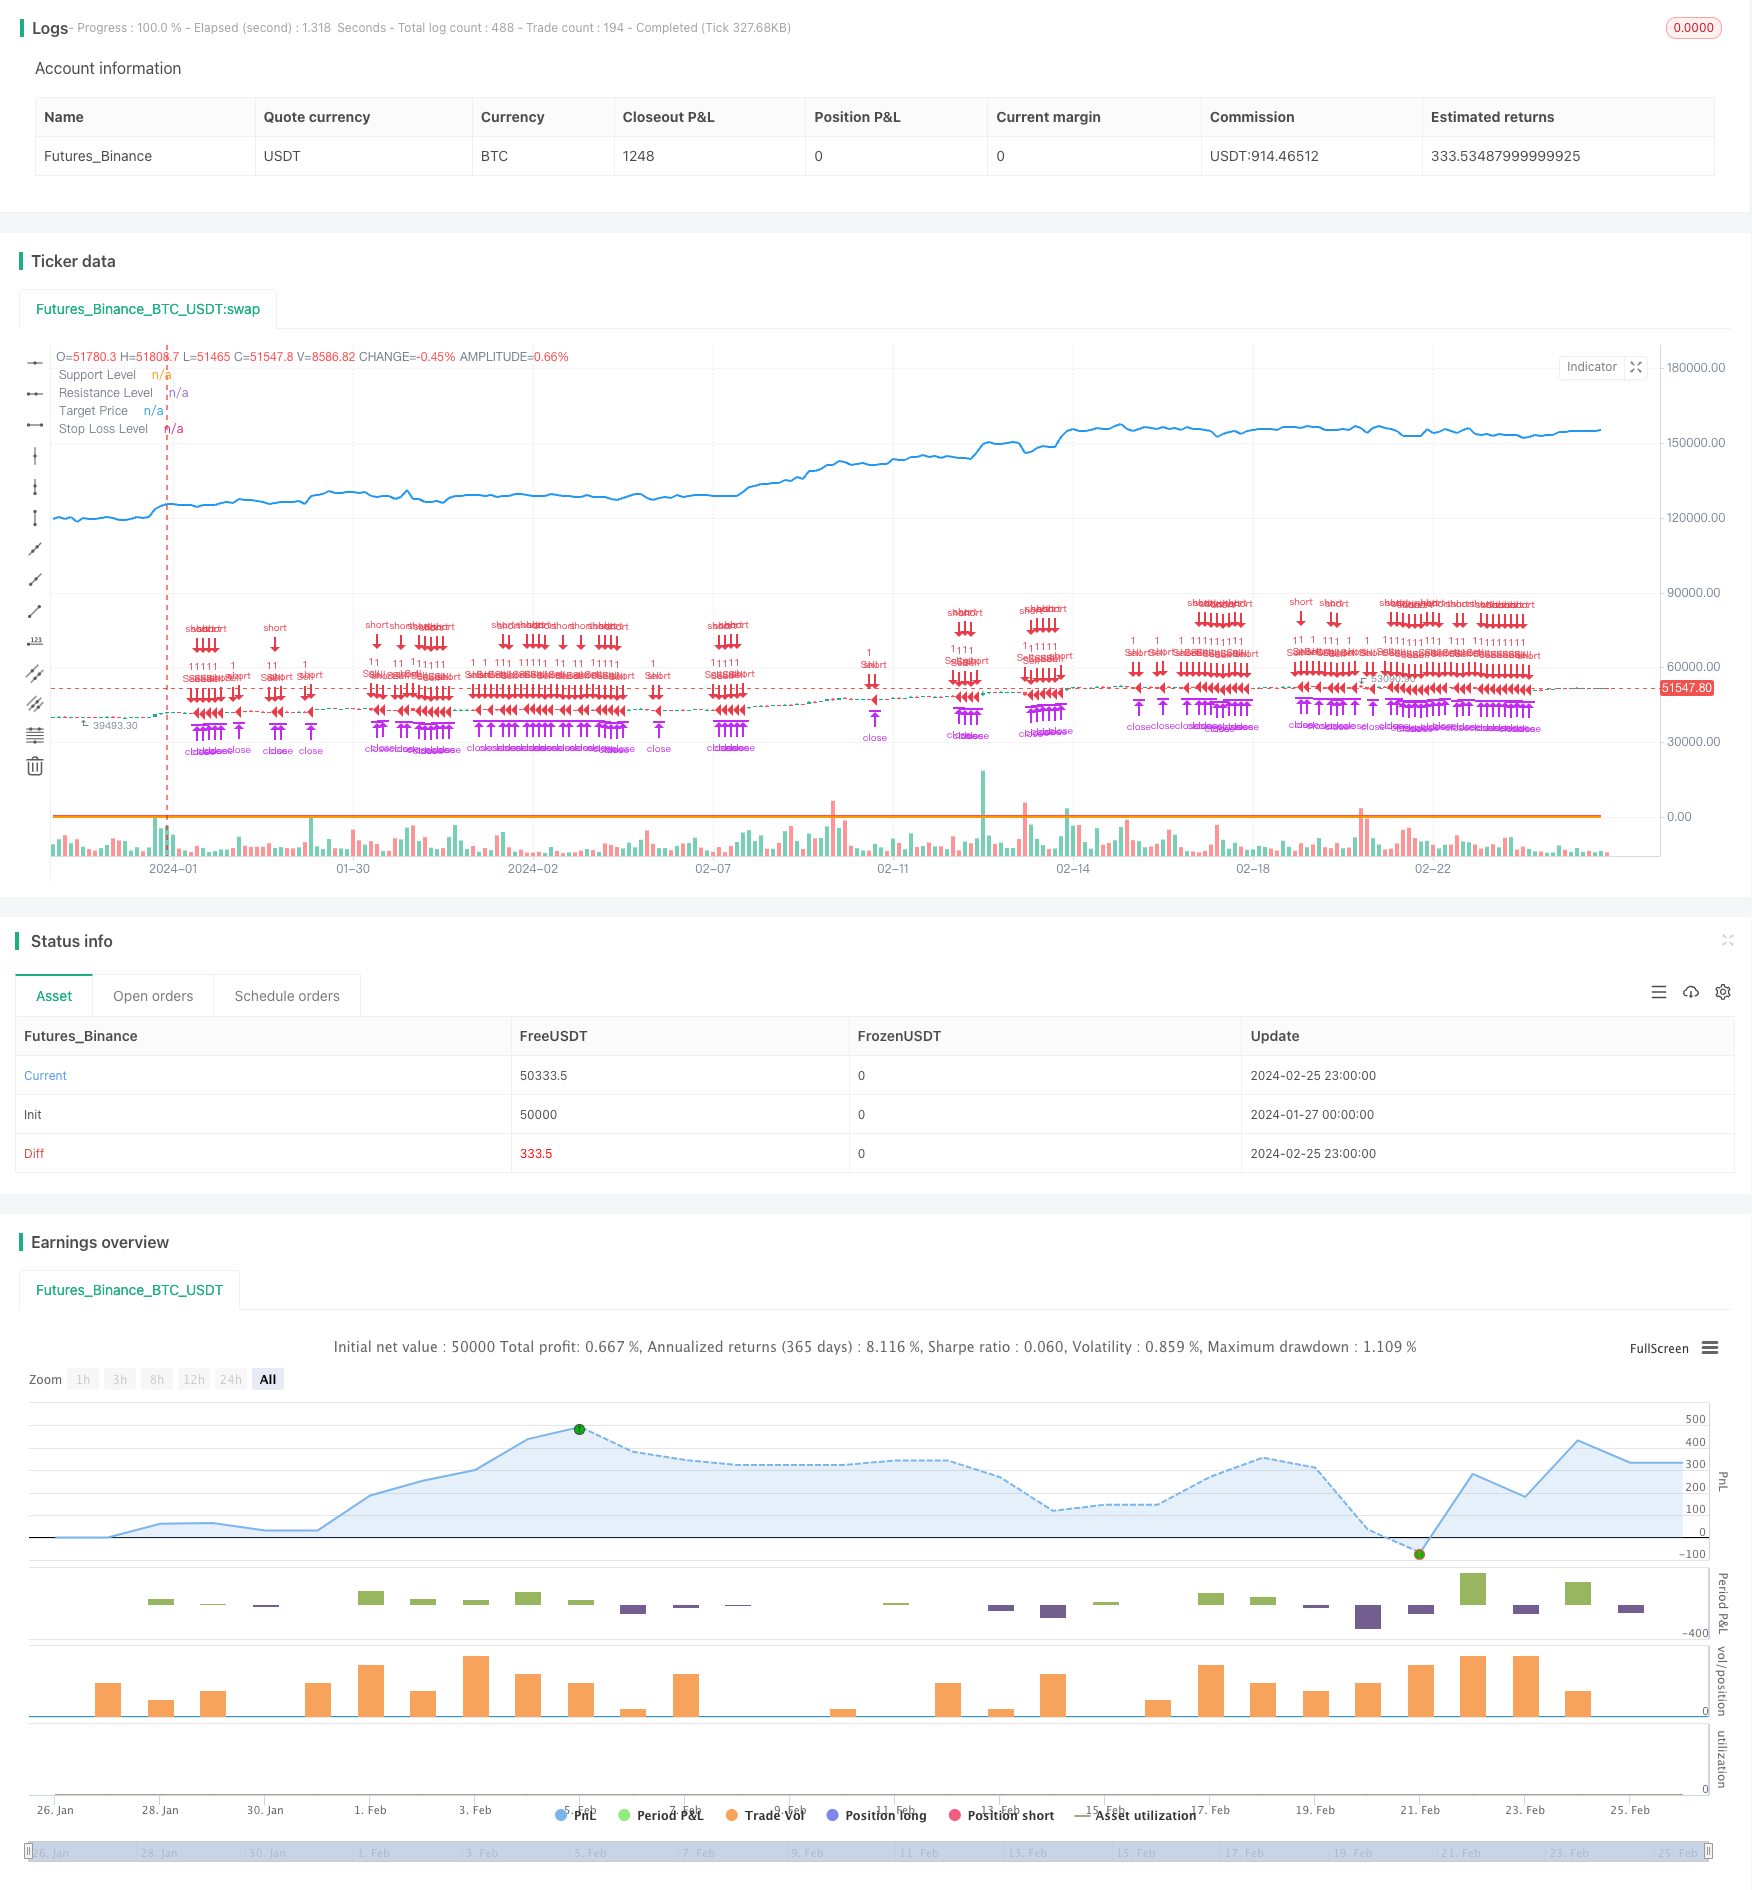
该策略运用支撑、阻力以及趋势线这三个技术指标来自动化入场和止损。策略首先识别关键的支撑和阻力位,然后结合趋势方向判断入场时机。
- 识别关键支撑位和阻力位。
- 利用趋势线判断市场趋势方向。当价格高于昨日收盘价时定义为上涨趋势,否则为下跌趋势。
- 当价格接近支撑位且属于上涨趋势时,发出买入信号。
- 当价格接近阻力位且属于下跌趋势时,发出卖出信号。
- 止盈目标根据风险回报比例计算,止损位设置在支撑位附近。
- 可选择使用跟踪止损来锁定利润。
- 充分利用支撑、阻力和趋势三个强大指标的优势。
- 自动判断入场时机,避免主观错误。
- 风险可控,止损控制在关键支撑位附近。
- 可选跟踪止损锁定利润,避免盈利回吐。
- 突破失败风险。价格突破支撑或阻力位后可能再次回调,造成钝化。
- 趋势判断失败风险。使用趋势线判断趋势方向可能会有错误。
- 止损被打破风险。尽管止损距离支撑位不远,但在剧烈波动中仍可能被直接推破。
应对方法:
- 适当放宽支撑阻力判定幅度。
- 采用多种指标验证趋势判断。
- 采用范围止损或及时人工干预。
- 加入更多指标验证入场信号,提高准确率。例如量价指标、移动平均线等。
- 优化支撑阻力位和止损位的设置。可以测试不同参数对结果的影响。
- 尝试机器学习方法自动优化参数。
本策略整合多种技术指标的优势,在合理参数设置的前提下,可以获得较好的回报风险比。关键是参数设置和入场顺序的优化。总体而言,该策略框架合理,有很大的改进空间。
||
This strategy utilizes three technical indicators - support, resistance and trendlines - to automate entries and stop losses. It first identifies key support and resistance levels, then combines trend direction to determine entry timing.
- Identify key support and resistance levels.
- Use trendlines to determine market trend direction. An uptrend is defined when price is higher than previous close, otherwise it's a downtrend.
- When price approaches support level and there is an uptrend, a buy signal is triggered.
- When price approaches resistance level and there is a downtrend, a sell signal is triggered.
- Take profit target is calculated based on risk-reward ratio, stop loss is set near support level.
- Trailing stop loss can be used to lock in profits.
- Fully utilizes the power of support, resistance and trend - three strong technical indicators.
- Automated entry timing eliminates subjective errors.
- Controllable risk with stop loss near key support levels.
- Optional trailing stop loss to avoid giving back profits.
- Failed breakout risk - price may retest the broken support or resistance level after initial breakout.
- Trend misjudgement risk - using trendlines alone may result in inaccurate trend bias.
- Stop loss being taken out risk - stop loss can still be hit by volatile price swings despite close distance from support.
Solutions:
- Allow wider range for support/resistance validation.
- Employ multiple indicators to confirm trend bias.
- Adopt range-based stop loss or timely manual intervention.
- Add more indicators to confirm entry signals, e.g. volume-based indicators, moving averages etc. This can improve accuracy.
- Optimize support, resistance and stop loss levels by testing different parameters.
- Try machine learning methods to auto-optimize parameters.
This strategy combines the power of multiple technical tools. With proper parameter tuning, it can achieve good risk-adjusted returns. The key is to optimize the parameters and entry sequence. Overall the strategy framework is sound and has lots of potential for improvements.\
[/trans]
Strategy Arguments
| Argument | Default | Description |
|---|---|---|
| v_input_1 | 100 | Support Level |
| v_input_2 | 200 | Resistance Level |
| v_input_3 | 2 | Risk-Reward Ratio |
| v_input_4 | true | Use Trailing Stop Loss |
Source (PineScript)
/*backtest
start: 2024-01-27 00:00:00
end: 2024-02-26 00:00:00
period: 3h
basePeriod: 15m
exchanges: [{"eid":"Futures_Binance","currency":"BTC_USDT"}]
*/

//@version=5
strategy("Support Resistance Trend Strategy", overlay=true)

// Input parameters
supportLevel = input(100, title="Support Level")
resistanceLevel = input(200, title="Resistance Level")
riskRewardRatio = input(2, title="Risk-Reward Ratio")
trailStopLoss = input(true, title="Use Trailing Stop Loss")

// Calculate trend direction based on trend lines
trendUp = close > request.security(syminfo.tickerid, "D", close[1])
trendDown = close < request.security(syminfo.tickerid, "D", close[1])

// Buy signal condition
buySignal = close < supportLevel and trendUp

// Sell signal condition
sellSignal = close > resistanceLevel and trendDown

// Entry point and exit conditions
strategy.entry("Buy", strategy.long, when=buySignal)
strategy.entry("Sell", strategy.short, when=sellSignal)

// Calculate targets and stop-loss levels
targetPrice = close + (close - supportLevel) * riskRewardRatio
stopLossLevel = supportLevel

// Plot support and resistance levels
plot(supportLevel, color=color.green, linewidth=2, title="Support Level")
plot(resistanceLevel, color=color.red, linewidth=2, title="Resistance Level")

// Plot targets and stop-loss levels
plot(targetPrice, color=color.blue, linewidth=2, title="Target Price")
plot(stopLossLevel, color=color.orange, linewidth=2, title="Stop Loss Level")

// Trailing stop-loss
strategy.exit("Take Profit/Stop Loss", from_entry="Buy", loss=stopLossLevel, profit=targetPrice)
strategy.exit("Take Profit/Stop Loss", from_entry="Sell", loss=targetPrice, profit=stopLossLevel)

// Plot trail stop loss
if (trailStopLoss)
    strategy.exit("Trailing Stop Loss", from_entry="Buy", loss=stopLossLevel)
    strategy.exit("Trailing Stop Loss", from_entry="Sell", loss=stopLossLevel)
Detail
https://www.fmz.com/strategy/442940
Last Modified
2024-02-27 15:11:04
