Name
改进波浪跟踪策略Improved-Wave-Trend-Tracking-Strategy
Author
ChaoZhang
Strategy Description
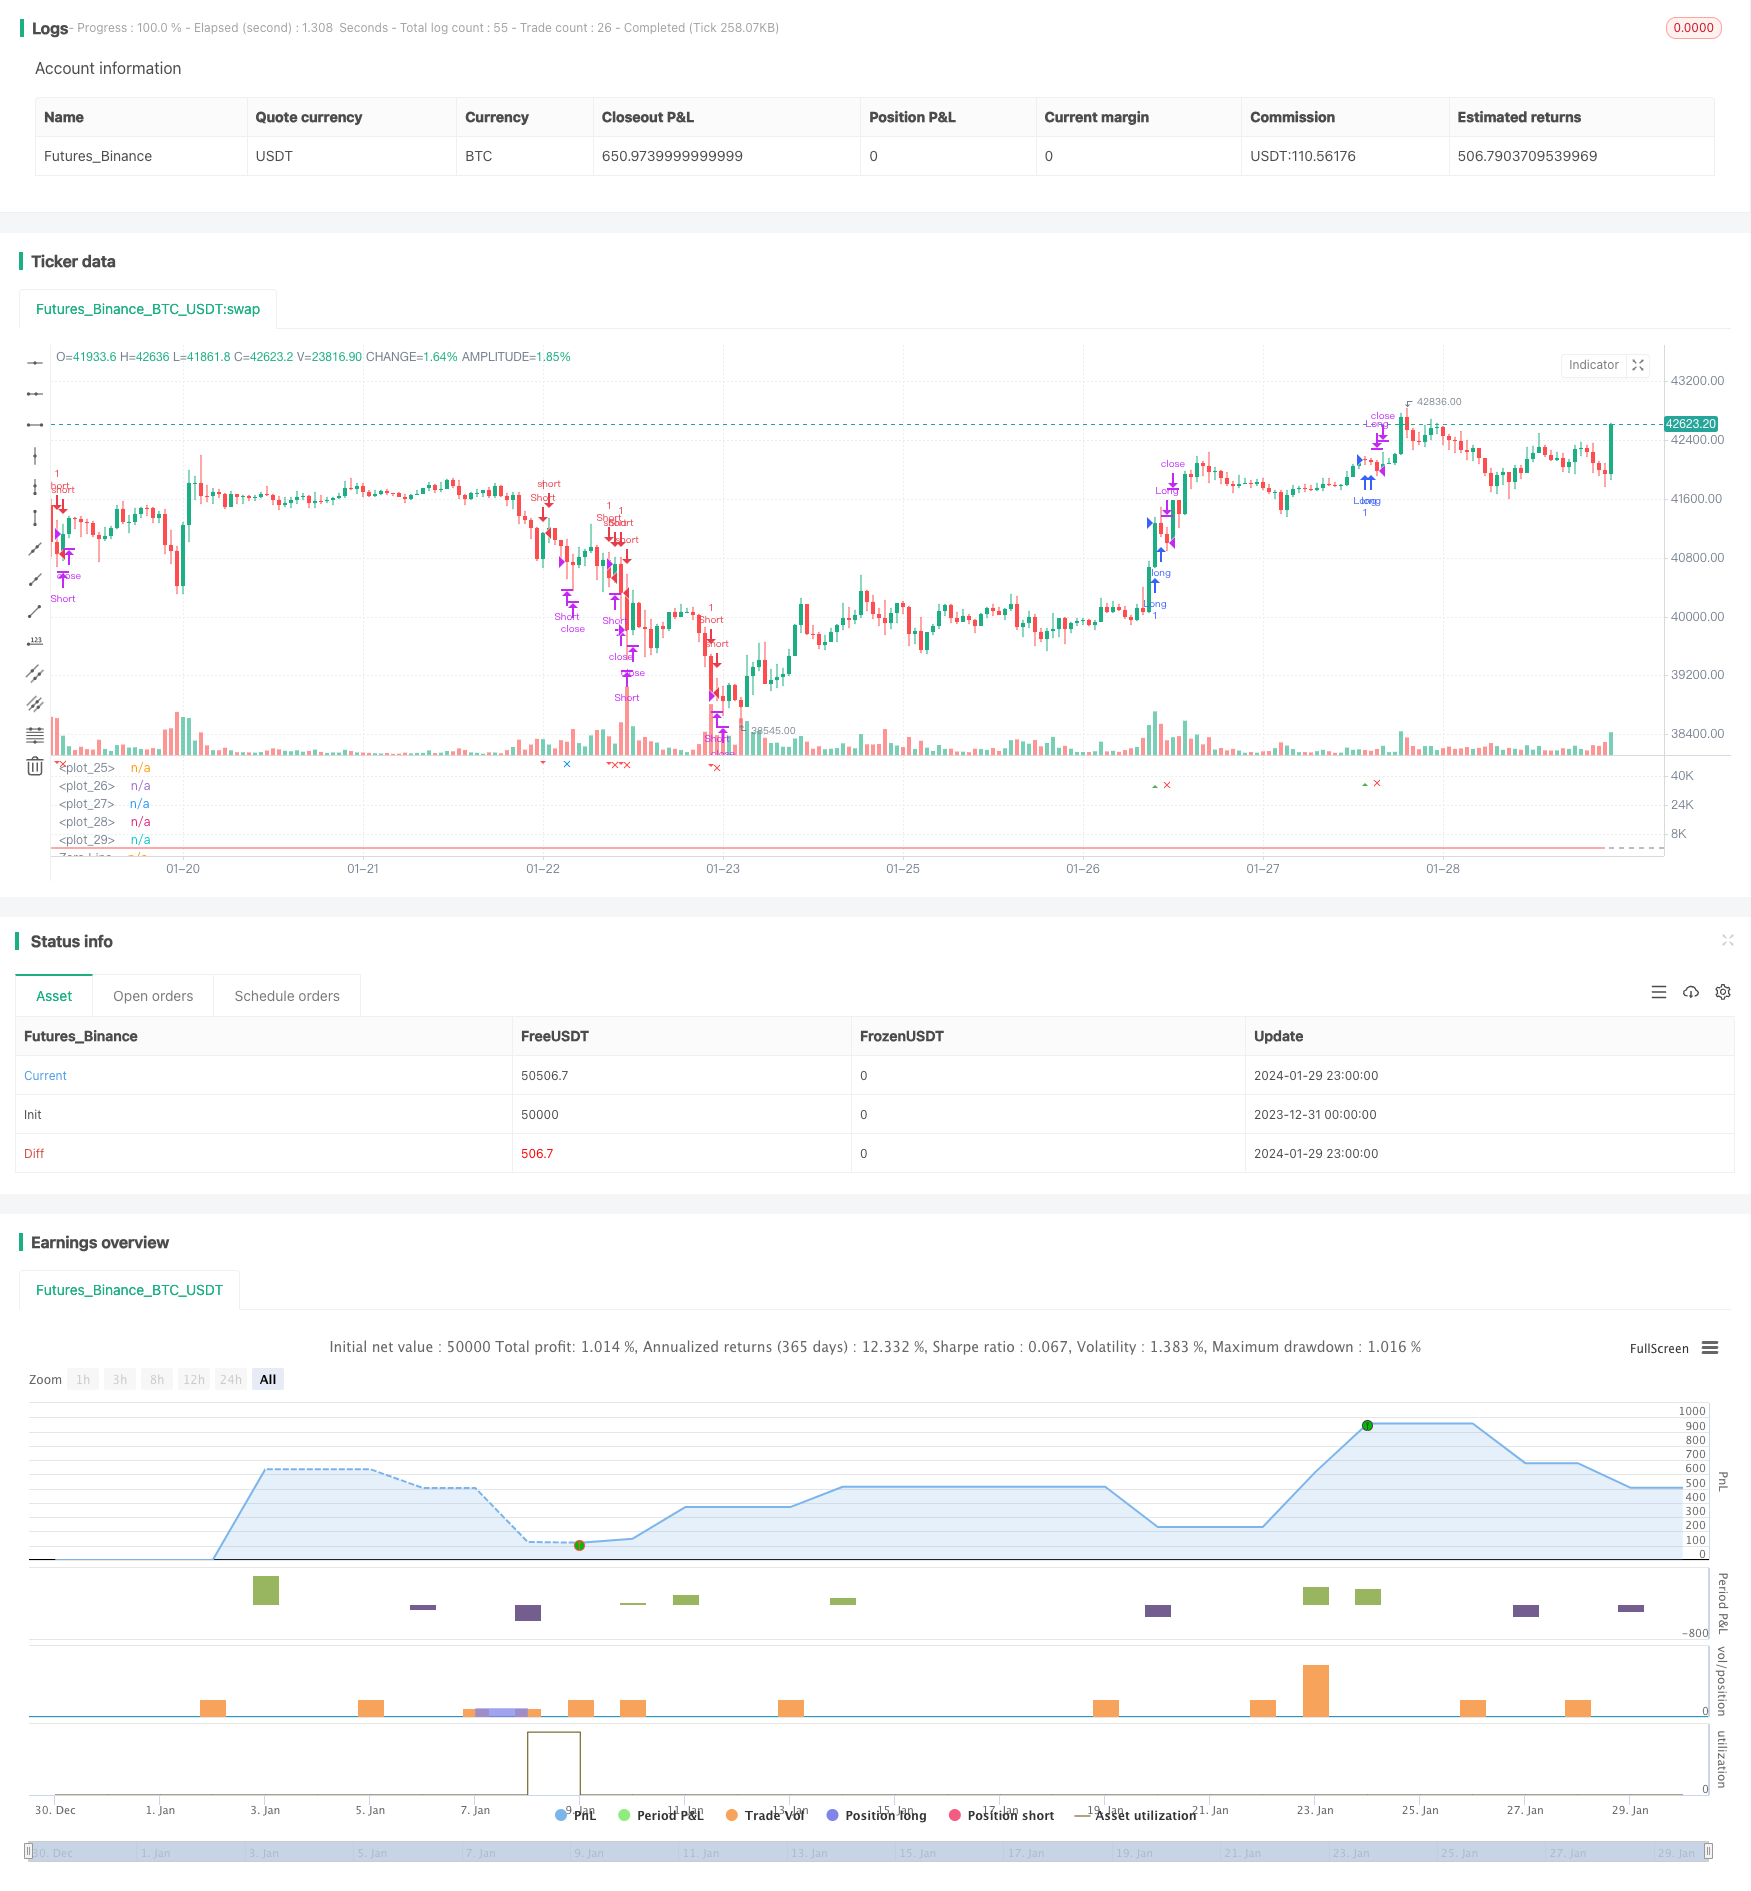
概述:这是一个应用波浪指标识别趋势的跟踪策略。它通过计算平均价格的指数移动平均线和绝对价格差的移动平均线,得到一波浪线。策略通过监控波浪线与超买超卖区域的交叉,产生交易信号。同时结合均线过滤和交易量过滤来避免错误信号。
策略原理:
-
计算平均价格ap=(最高价+最低价+收盘价)/3
-
计算n1周期的ap的EMA,得到esa
-
计算ap与esa的绝对差值的n1周期EMA,得到d
-
计算波浪线:ci=(ap-esa)/(0.015*d)
-
计算n2周期ci的EMA,得到终极波浪线tci,即wt1
-
计算wt1的4周期SMA,得到wt2
-
绘制超买区和超卖区的水平线obLevel1/2和osLevel1/2
-
当wt1上穿obLevel2线时产生买入信号;当wt1下穿osLevel2线时产生卖出信号
-
添加均线emaFilter和交易量volumeFilter作为过滤条件,避免错误信号
-
入场后设置止盈止损比例,退出持仓
优势分析:
-
波浪线比较好地处理了多空转换,可以有效捕捉趋势
-
结合均线和交易量双重过滤,可靠性较高
-
采用多组参数计算,避免了单一指标的局限性
-
设置止盈止损,可以锁定部分利润,有效控制风险
风险与缺陷:
-
参数的选择在某些情况下可能导致性能不佳或过度拟合
-
没有关于最优参数选择的明确指导,需要试错
-
未将更广泛的市场条件纳入信号中
-
如果在范围受限或波动市场中使用,存在鞭炮效应的风险
-
除了获利/止损之外,缺乏退出规则
优化方向:
-
在各种时间框架和资产上测试参数集,以找到最优值
-
结合波动性指标,避免在低波动性时期出现信号
-
添加补充指标如RSI以提高信号准确度
-
构建一个机器学习模型,寻找针对特定资产的最优参数
-
通过添加跟踪止损或基于突然的波动性扩张事件的退出来增强退出
总结:
这是一个结合波浪线和辅助指标设计的策略。它利用波浪线有效识别趋势转换的特点,辅以均线和交易量过滤来避免错误信号,能够获取大部分中长线趋势。同时采用止盈止损来控制风险。优化空间还很大,通过调整参数组合,结合更多指标,以及机器学习等方式不断改进,可以使策略在更多品种和时间周期上表现更好。
||
Overview: This is a trend following strategy that utilizes the Wave Trend oscillator to identify trends. It calculates exponential moving averages of the average price and absolute price difference to plot a Wave Trend line. Trading signals are generated when the Wave Trend line crosses overbought/oversold zones. Additional filters on moving average and volume avoid false signals.
Strategy Logic:
-
Calculate average price ap = (high + low + close)/3
-
Compute n1-period EMA of ap to get esa
-
Compute n1-period EMA of absolute difference between ap and esa to get d
-
Compute Wave Trend line: ci = (ap - esa)/(0.015*d)
-
Compute n2-period EMA of ci to get final wave trend line tci, i.e. wt1
-
Compute 4-period SMA of wt1 to get wt2
-
Plot overbought/oversold level lines obLevel1/2 and osLevel1/2
-
Generate buy signal when wt1 crosses over obLevel2; generate sell signal when wt1 crosses below osLevel2
-
Add moving average emaFilter and volume filter volumeFilter as filters to avoid false signals
-
Set take profit/stop loss after entry to exit positions
Advantages:
-
Wave Trend line handles trend/counter-trend transitions well
-
Reliability improved through dual filters of moving average and volume
-
Multiple parameters avoid limitations of single indicator
-
Take profit/stop loss locks in profits and controls risk
Risks and Limitations:
-
Choice of parameters can lead to poor performance or overfitting
-
No definitive guidance on optimal parameters
-
Ignores broader market conditions
-
Risk of whip-saws in range-bound/choppy markets
-
Lack of exit rules besides take profit/stop loss
Enhancement Opportunities:
-
Test parameters across timeframes/assets to find optimal values
-
Incorporate volatility metrics to avoid low volatility regimes
-
Add indicators like RSI to improve signal accuracy
-
Build machine learning model to find optimal tailored parameters
-
Enhance exits with trailing stops or volatility event based exits
Conclusion:
This is a trend following strategy incorporating the Wave Trend indicator with additional filters. It capitalizes on the Wave Trend line's ability to identify trend transitions, uses moving average and volume filters to avoid false signals, and aims to capture most medium/long term trends. Take profit/stop loss is used to control risk. Significant opportunity exists to improve performance across more instruments and timeframes by optimizing parameters, adding more indicators, and techniques like machine learning.
[/trans]
Strategy Arguments
| Argument | Default | Description |
|---|---|---|
| v_input_1 | 10 | Channel Length |
| v_input_2 | 21 | Average Length |
| v_input_3 | 60 | Over Bought Level 1 |
| v_input_4 | 53 | Over Bought Level 2 |
| v_input_5 | -65 | Over Sold Level 1 |
| v_input_6 | -60 | Over Sold Level 2 |
| v_input_7 | true | Take Profit (%) |
| v_input_8 | 0.5 | Stop Loss (%) |
Source (PineScript)
/*backtest
start: 2023-12-31 00:00:00
end: 2024-01-30 00:00:00
period: 1h
basePeriod: 15m
exchanges: [{"eid":"Futures_Binance","currency":"BTC_USDT"}]
*/

//@version=5
strategy("Bush Strategy test", shorttitle="Nique Audi", overlay=false)

// Paramètres
n1 = input(10, title="Channel Length")
n2 = input(21, title="Average Length")
obLevel1 = input(60, title="Over Bought Level 1")
obLevel2 = input(53, title="Over Bought Level 2")
osLevel1 = input(-65, title="Over Sold Level 1")
osLevel2 = input(-60, title="Over Sold Level 2")
takeProfitPercentage = input(1, title="Take Profit (%)")
stopLossPercentage = input(0.50, title="Stop Loss (%)")

// Calculs
ap = hlc3
esa = ta.ema(ap, n1)
d = ta.ema(math.abs(ap - esa), n1)
ci = (ap - esa) / (0.015 * d)
tci = ta.ema(ci, n2)

wt1 = tci
wt2 = ta.sma(wt1, 4)

// Tracé des lignes
plot(0, color=color.gray)
plot(obLevel1, color=color.red)
plot(osLevel1, color=color.green)
plot(obLevel2, color=color.red, style=plot.style_line)
plot(osLevel2, color=color.green, style=plot.style_line)

plot(wt1, color=color.green)
plot(wt2, color=color.red, style=plot.style_line)

// Tracé de la différence entre wt1 et wt2 en bleu
hline(0, "Zero Line", color=color.gray)

// Conditions d'entrée long et court
longCondition = ta.crossover(wt1, obLevel2)
shortCondition = ta.crossunder(wt1, osLevel2)

// Tracé des signaux d'achat et de vente
plotshape(series=longCondition, style=shape.triangleup, location=location.belowbar, color=color.green, size=size.small, title="Buy Signal")
plotshape(series=shortCondition, style=shape.triangledown, location=location.abovebar, color=color.red, size=size.small, title="Sell Signal")

// Conditions d'entrée et de sortie
strategy.entry("Long", strategy.long, when=longCondition)
strategy.entry("Short", strategy.short, when=shortCondition)

// Niveaux de prise de profit pour les positions longues et courtes
longTakeProfitLevel = strategy.position_avg_price * (1 + takeProfitPercentage / 100)
shortTakeProfitLevel = strategy.position_avg_price * (1 - takeProfitPercentage / 100)

// Vérification si les niveaux de prise de profit sont atteints
longTakeProfitReached = strategy.position_size > 0 and high >= longTakeProfitLevel
shortTakeProfitReached = strategy.position_size < 0 and low <= shortTakeProfitLevel

// Tracé des formes de prise de profit
plotshape(series=longTakeProfitReached, style=shape.xcross, location=location.belowbar, color=color.blue, size=size.small, title="Take Profit Long")
plotshape(series=shortTakeProfitReached, style=shape.xcross, location=location.abovebar, color=color.blue, size=size.small, title="Take Profit Short")

// Niveaux de stop loss pour les positions longues et courtes
longStopLossLevel = strategy.position_avg_price * (1 - stopLossPercentage / 100)
shortStopLossLevel = strategy.position_avg_price * (1 + stopLossPercentage / 100)

// Vérification si les niveaux de stop loss sont atteints
longStopLossReached = strategy.position_size > 0 and low <= longStopLossLevel
shortStopLossReached = strategy.position_size < 0 and high >= shortStopLossLevel

// Tracé des formes de stop loss
plotshape(series=longStopLossReached, style=shape.xcross, location=location.belowbar, color=color.red, size=size.small, title="Stop Loss Long")
plotshape(series=shortStopLossReached, style=shape.xcross, location=location.abovebar, color=color.red, size=size.small, title="Stop Loss Short")

// Fermeture des positions en cas de prise de profit ou de stop loss
strategy.close("Long", when=longTakeProfitReached or longStopLossReached)
strategy.close("Short", when=shortTakeProfitReached or shortStopLossReached)
Detail
https://www.fmz.com/strategy/440548
Last Modified
2024-01-31 15:35:41
