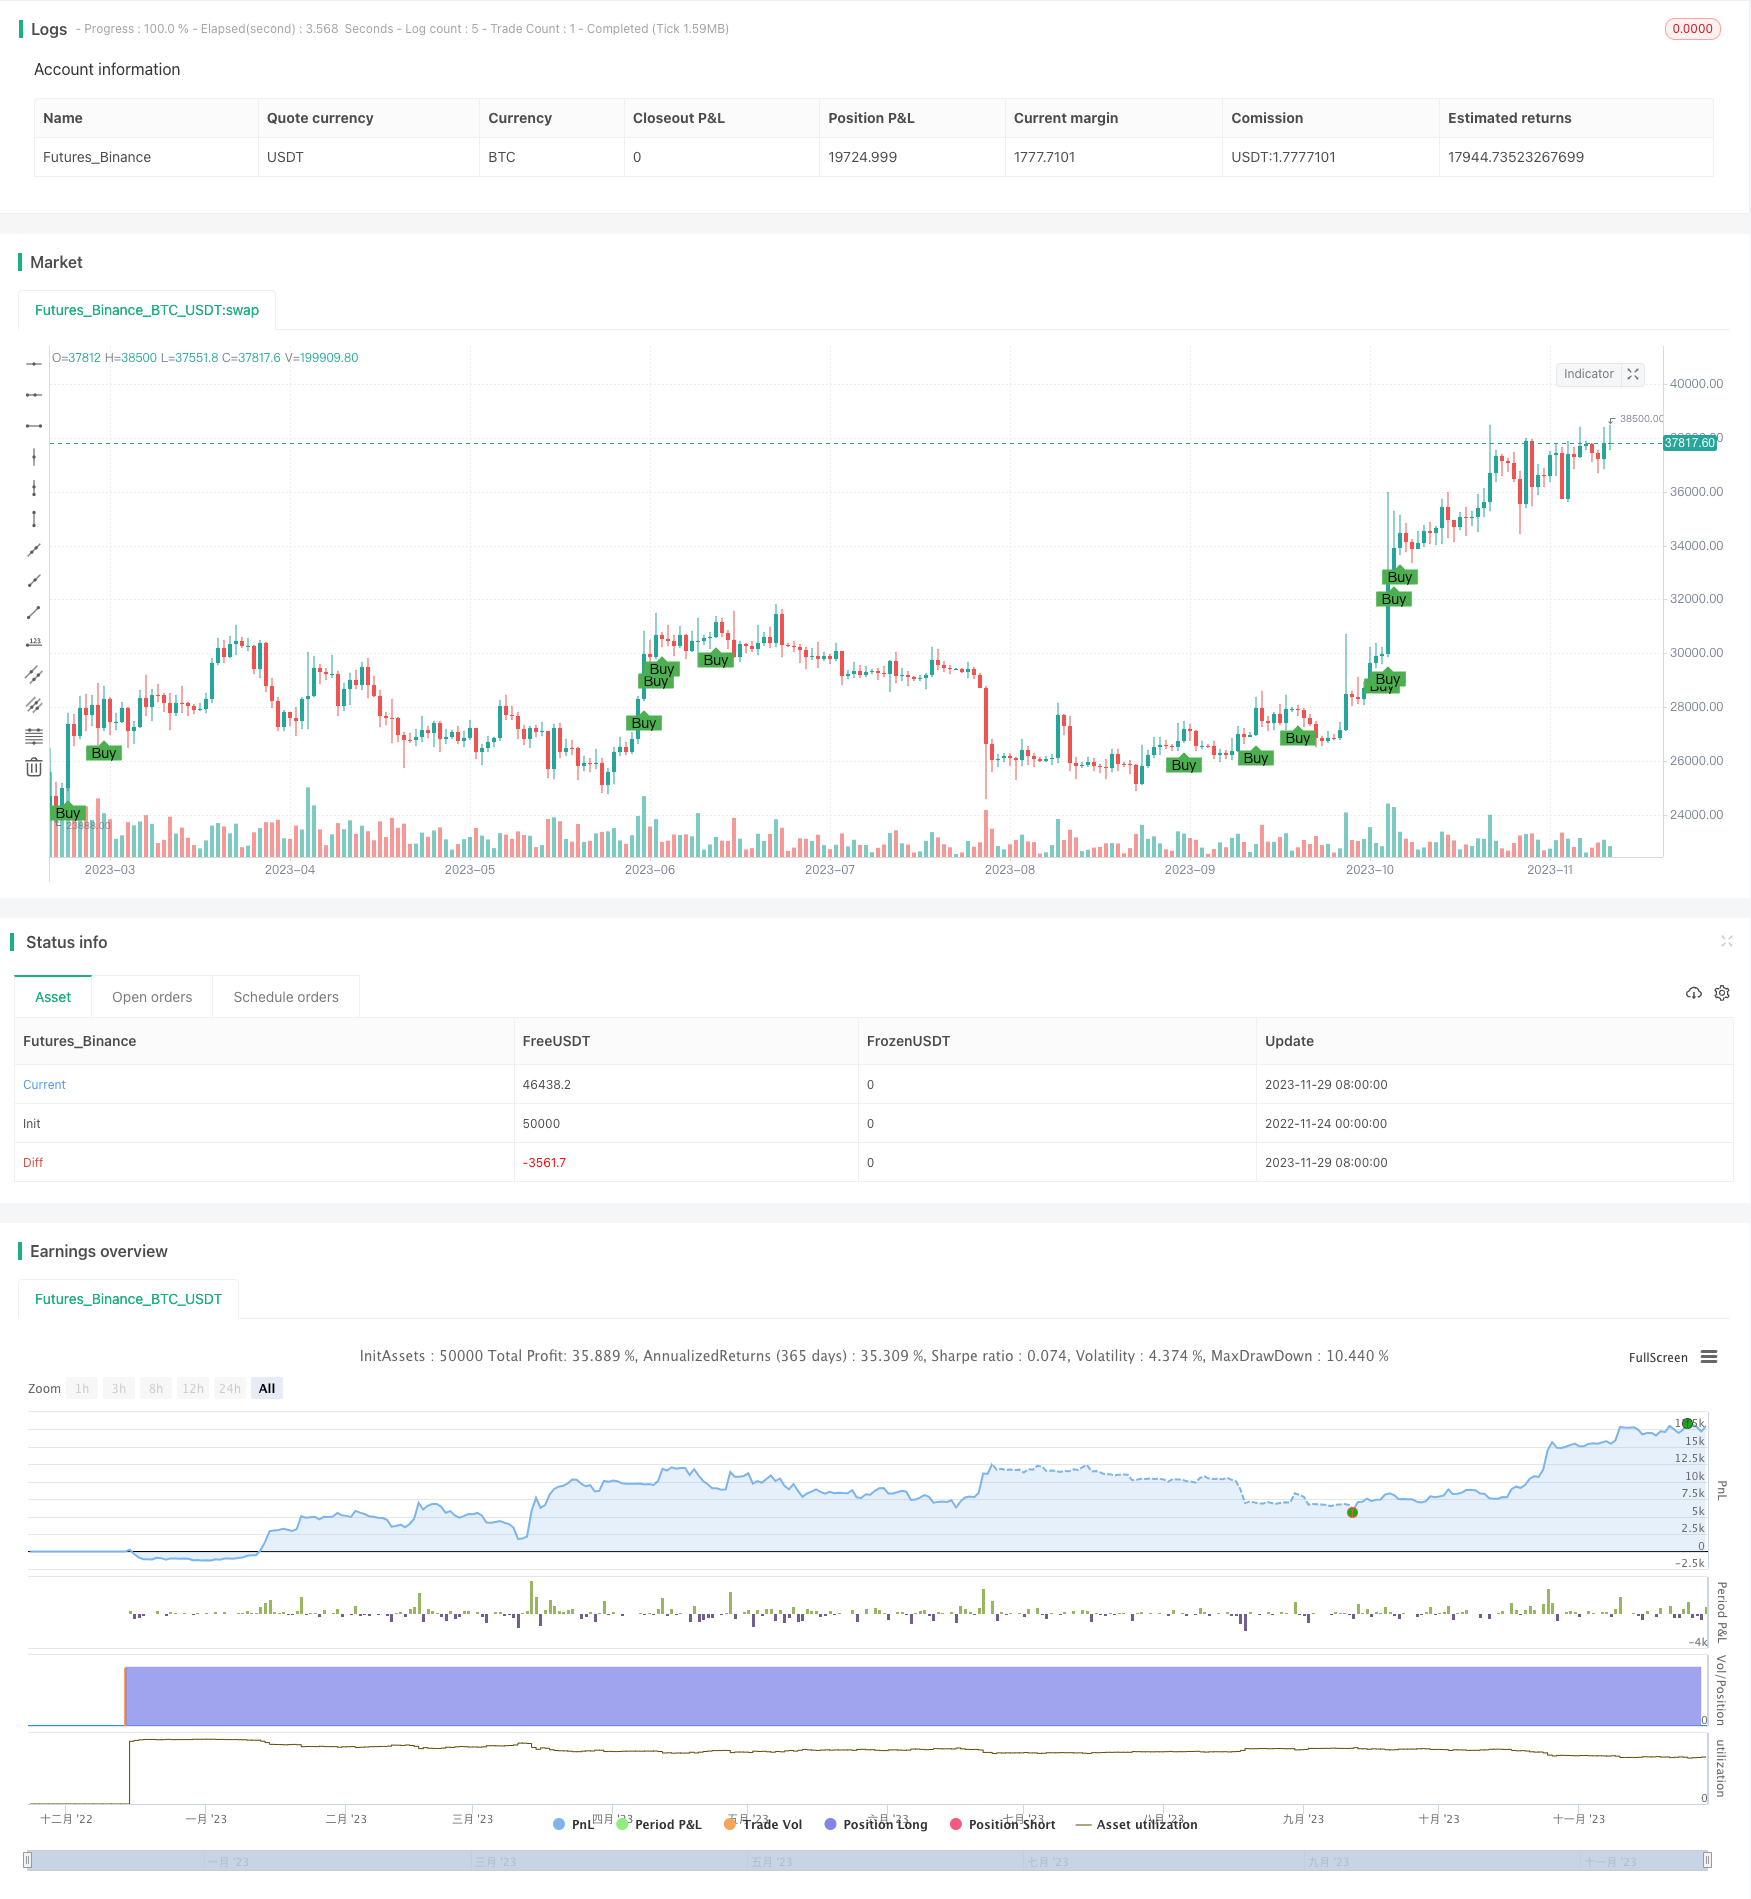
Name
月度抛物线突破策略Monthly-Parabolic-Breakout-Strategy
Author
ChaoZhang
Strategy Description
[trans]
月度抛物线突破策略通过计算RSI和MACD的36个月新高,来识别一次性的大规模突破信号。当RSI达到36个月新的高点,且MACD中的任意一个也达到36个月新高时,产生强势买入信号。该策略适合捕捉少有的大趋势中的机会。
该策略主要基于RSI和MACD两个指标。其中RSI用于判断股票是否处于超买超卖状态。MACD用于发现股价的势头和力度。
具体来说,策略首先手动计算14日RSI。然后计算4日与9日EMA的差值作为MACD1,计算12日与26日EMA之差作为MACD2。
在此基础上,记录过去36个月中,RSI、MACD1和MACD2的最高值。当本月的RSI超过36个月最高值,且MACD1或MACD2中任意一个也超过各自的36个月最高值时,产生强势买入信号。
该信号组合了RSI和MACD两个指标的时段新高判断,因此可以有效识别难得的大趋势中出现的绝佳买入点,捕捉这样的机会。
该策略最大的优势在于,它结合多个指标的look back period不同的时段新高判断,从而能够有效发现长期大趋势中出现的绝佳买入点。这可以大幅提高获利的概率。
另外,策略直接给出买入信号位置,可以明确指导交易决策,非常适合量化交易。
该策略最大的风险在于,它过于依赖指标的时段最高值,可能会产生误交易。例如,行情出现断头霸底后再次反弹,也可能触发信号。这时就面临错过反弹获得利润的机会。
此外,策略中直接设置了30天后止损退出,这在大趋势中可能过于保守,无法持续获利。
为降低风险,可以考虑结合其他因素优化入场和止损条件,例如交易量突破、波动率测量等。
该策略可以从以下几个方面进行优化:
-
优化参数。可以测试RSI周期、MACD周期等参数的优化,找到最佳参数组合。
-
结合其他指标或基本面因素。例如结合成交量的突破来确认趋势,或关注重要的基本面消息事件。
-
优化入场和出场机制。可以设定更精细的止盈止损方案,而不是简单的30天后退出。也可以结合趋势LINES、通道突破等判断方法。
-
评估策略健壮性。可以回测更长的历史周期,评估参数稳定性。也可以多市场回测,评估策略适应性。
月度抛物线突破策略通过RSI和MACD的多周期组合,成功识别了长期大趋势中的绝佳买入点。它结合了趋势判断和超买超卖判断,具有极强的practical value。通过进一步优化,该策略可以成为高效的量化交易系统。它为投资者抓住市场转折点提供了有力工具。
||
The Monthly Parabolic Breakout Strategy identifies strong buy signals when the RSI hits a 36-month high and one of two MACD signals also reaches a 36-month high. It is ideal for catching once-in-a-lifetime breakouts.
This strategy is mainly based on the RSI and MACD indicators. RSI is used to judge whether a stock is overbought or oversold. MACD is used to discover the momentum and strength of price changes.
Specifically, the strategy first manually calculates the 14-day RSI. Then it calculates MACD1 as the difference between 4-day and 9-day EMAs, and MACD2 as the difference between 12-day and 26-day EMAs.
On this basis, it records the highest values of RSI, MACD1 and MACD2 in the last 36 months. When this month's RSI exceeds the 36-month high, and either MACD1 or MACD2 also exceeds its 36-month high, a strong buy signal is generated.
This signal combines the new high judgments of RSI and MACD over different time periods. It can effectively identify great buying opportunities in the rare major trends, capturing such chances.
The biggest advantage of this strategy is that it combines the look back periods of multiple indicators for new high judgments across different time periods. This allows it to effectively discover excellent buying opportunities in long-term mega trends. This can greatly increase the probability of profit.
In addition, the strategy directly gives buy signal locations, which can clearly guide trading decisions and is very suitable for quantitative trading.
The biggest risk of this strategy is that it relies too much on the highest values of the indicators over time periods, which may cause bad trades. For example, if the market appears to plunge and then rebound, signals may also be triggered. We then face the risk of missing the opportunity to profit from the rebound.
In addition, the strategy directly sets a stop loss exit after 30 days, which may be too conservative to sustain profits in mega trends.
To reduce risks, we can consider combining other factors to optimize entry and stop loss conditions, such as trading volume breakouts, volatility measurements, etc.
This strategy can be optimized in the following aspects:
-
Optimize parameters. We can test optimizations of the RSI period, MACD period and other parameters to find the best parameter combinations.
-
Incorporate other indicators or fundamentals. For example, combine breakouts in trading volume to confirm the trend, or pay attention to important fundamental news events.
-
Optimize entry and exit mechanisms. We can set more sophisticated take profit and stop loss plans, instead of simply exiting after 30 days. We can also incorporate trend line judgments, channel breakouts, etc.
-
Evaluate strategy robustness. We can backtest longer historical periods to evaluate parameter stability. We can also conduct multi-market backtests to evaluate adaptability.
The Monthly Parabolic Breakout Strategy successfully identifies excellent buying opportunities in long-term mega trends by combining multi-period RSI and MACD. It incorporates both trend and overbought/oversold judgments, and has extremely strong practical value. With further optimizations, this strategy can become an efficient quantitative trading system. It provides powerful tools for investors to capture market turning points.
[/trans]
Source (PineScript)
/*backtest
start: 2022-11-24 00:00:00
end: 2023-11-30 00:00:00
period: 1d
basePeriod: 1h
exchanges: [{"eid":"Futures_Binance","currency":"BTC_USDT"}]
*/

//@version=4
strategy("Stringent Strategy for Backtesting", overlay=true)

// Initialize RSI variables
rsiPeriod = 14

// Manually calculate RSI
delta = close - close[1]
gain = iff(delta > 0, delta, 0)
loss = iff(delta < 0, -delta, 0)

avgGain = sma(gain, rsiPeriod)
avgLoss = sma(loss, rsiPeriod)

rs = avgGain / avgLoss
rsiValue = 100 - (100 / (1 + rs))

// Manually calculate MACD1 and MACD2
emaShort1 = ema(close, 4)
emaLong1 = ema(close, 9)
macd1 = emaShort1 - emaLong1

emaShort2 = ema(close, 12)
emaLong2 = ema(close, 26)
macd2 = emaShort2 - emaLong2

// Find the highest values in the last 3 years (36 months)
highestRsi = highest(rsiValue, 36)
highestMacd1 = highest(macd1, 36)
highestMacd2 = highest(macd2, 36)

// Define buy signal conditions
buyCondition = (rsiValue >= highestRsi) and (macd1 >= highestMacd1 or macd2 >= highestMacd2)

// Plot the buy signal on the chart
plotshape(series=buyCondition, title="Buy Signal", location=location.belowbar, color=color.green, style=shape.labelup, text="Buy")

// Backtesting: Entry and Exit
if (buyCondition)
    strategy.entry("Buy", strategy.long)

// Exit condition (Example: Exit after 30 bars)
strategy.exit("Sell", "Buy", bar_index[30])
Detail
https://www.fmz.com/strategy/433916
Last Modified
2023-12-01 14:28:46
