Name
木星与土星动能MA交叉过滤策略Jupiter-and-Saturn-Momentum-MA-Crossover-Filtered-Strategy
Author
ChaoZhang
Strategy Description
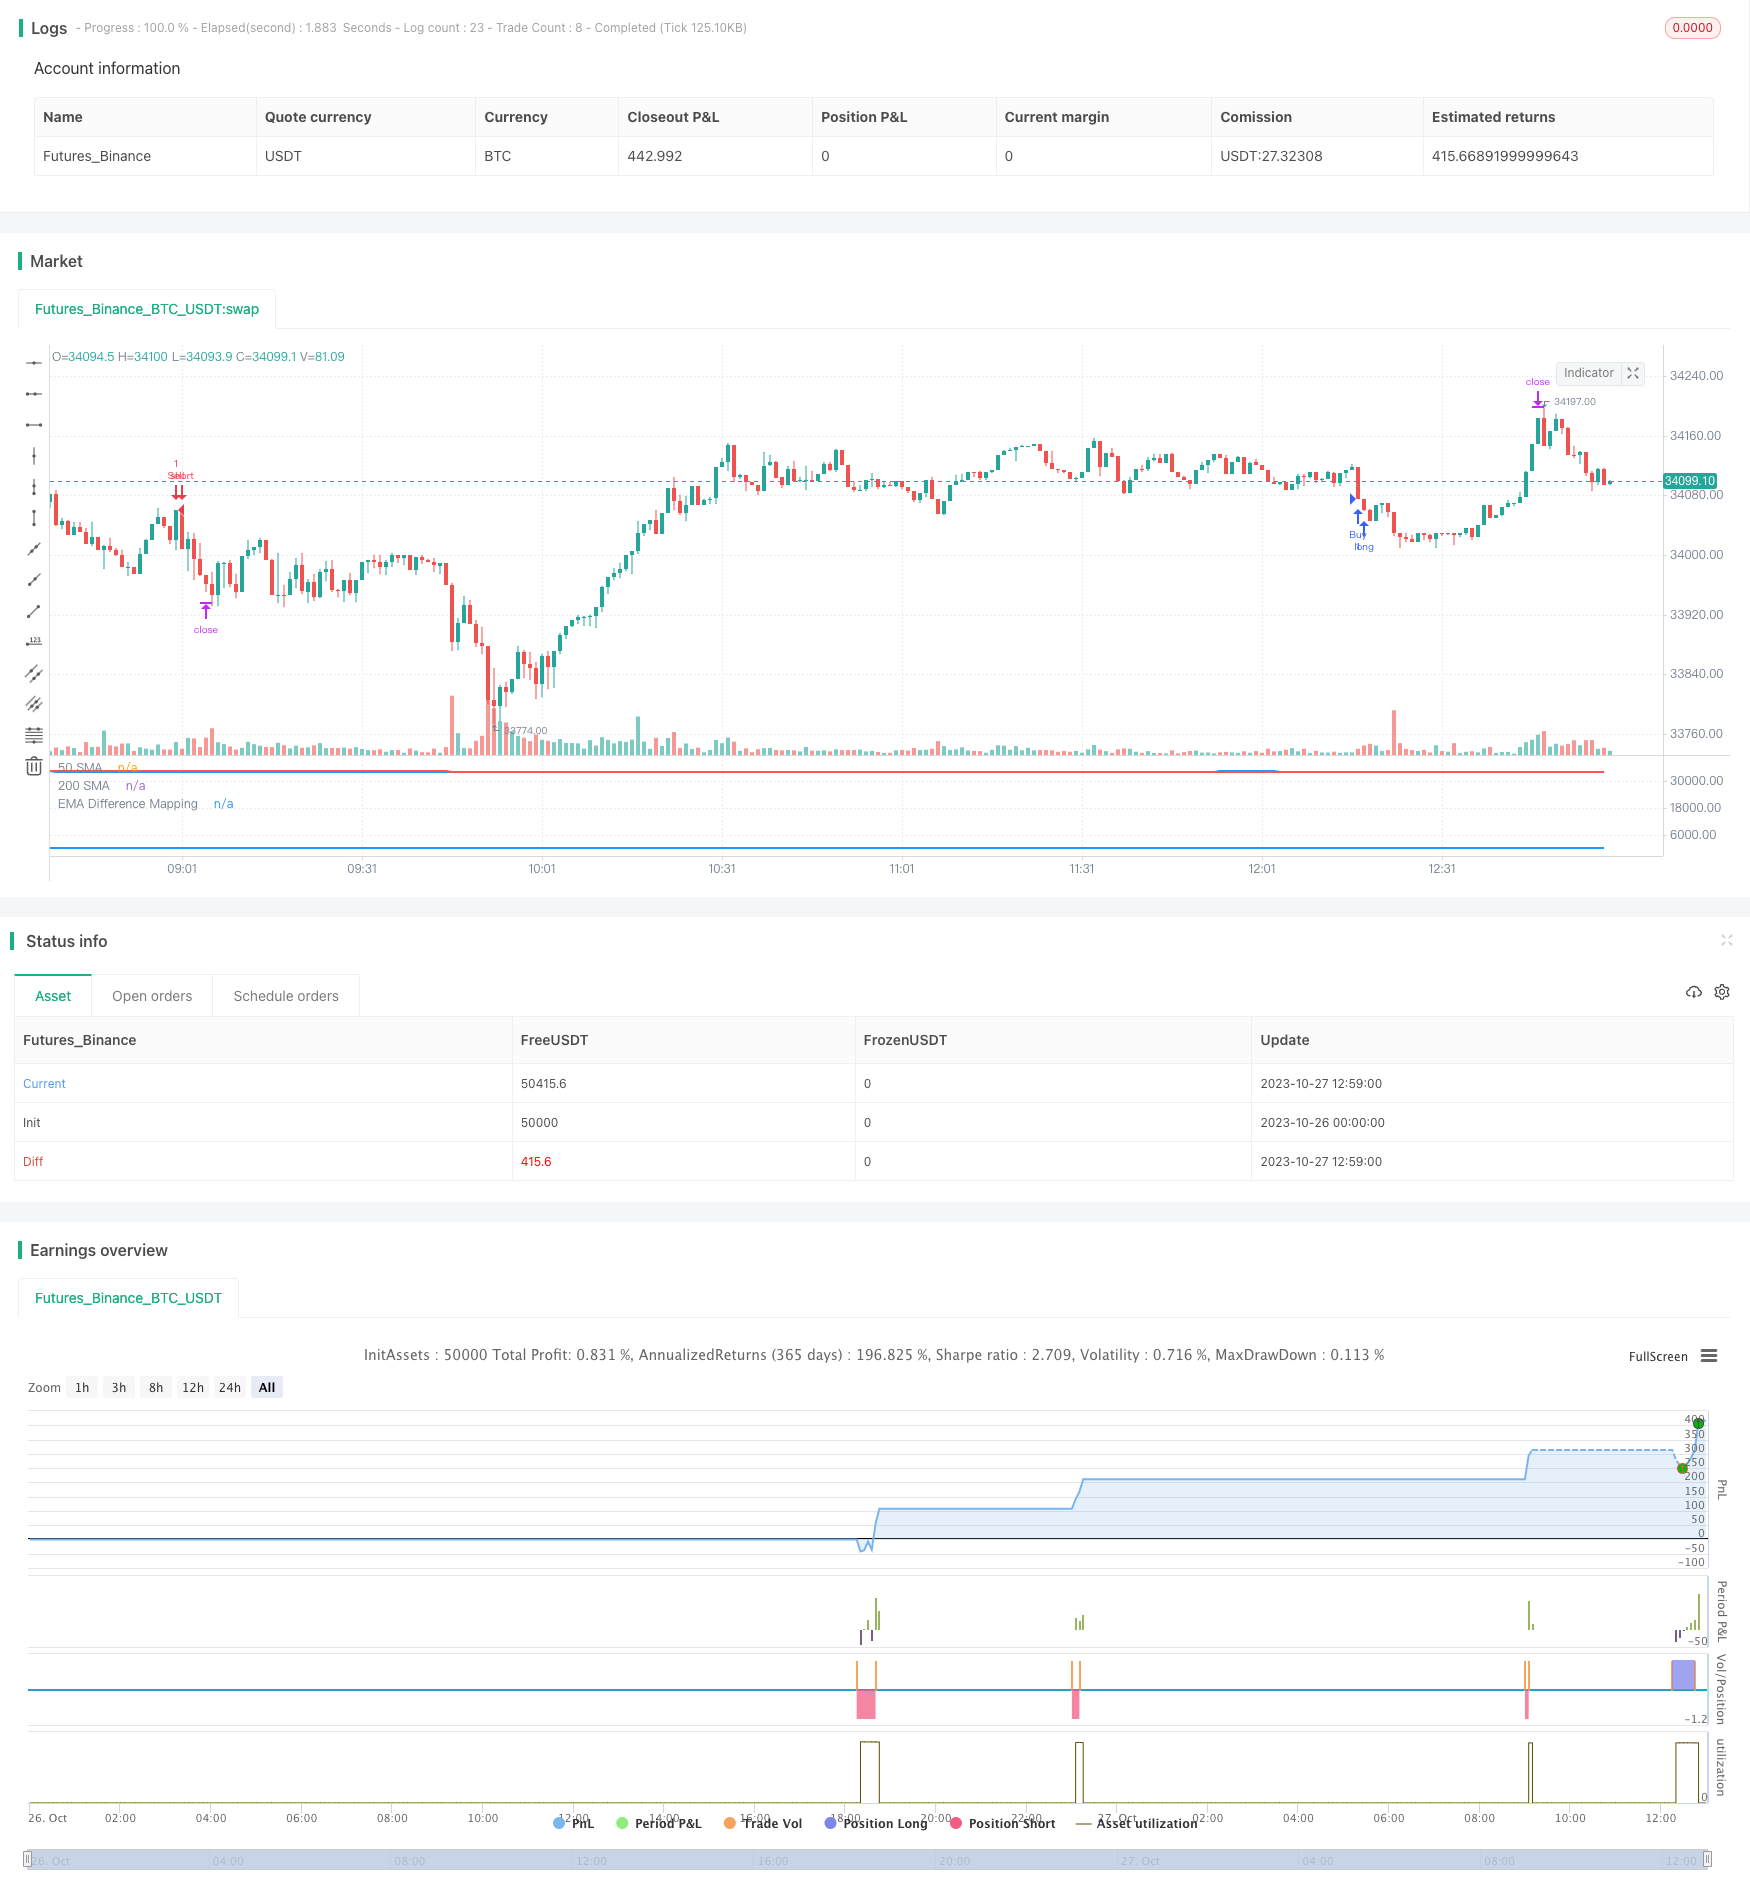
本策略使用两条移动平均线的交叉作为交易信号,并结合波幅指标BB和自定义动能指标进行过滤,旨在提高MA交叉信号的可靠性,减少假信号。
-
使用50周期EMA和200周期SMA形成金叉死叉信号。
-
当价格在上升趋势时,要求价格高于200日线且自定义动能指标值小于25才产生买入信号。
-
当价格在下降趋势时,要求价格低于200日线且自定义动能指标值大于75才产生卖出信号。
-
自定义动能指标根据BB中线与上下轨的距离映射到0-100范围。通过回溯统计距离最大最小值,进行归一化处理。
-
动能指标能体现价格相对波幅的位置信息,设置阈值进行过滤,可有效减少假交叉。
-
利用EMA和SMA的优势,捕捉中长线趋势。
-
增加动能指标进行滤波,可靠性更高,减少假信号。
-
BB上下轨距离反映波动力度,结合回溯统计进行标准化处理,避免参数依赖。
-
可自定义EMA和SMA周期及动能指标阈值,适应不同市场环境。
-
策略思路清晰易懂,参数调优空间大,实操性强。
-
EMA和SMA本身存在滞后性,可能错过短线机会。
-
双线交叉本质上是趋势跟踪策略,不适合震荡行情。
-
动能指标阈值需要反复回测确定合适参数,存在曲优化风险。
-
大周期均线策略,收益相对稳定但绝对收益可能有限。
-
可适当缩短均线周期,或增加其他指标辅助判断,提高策略的适应性。
-
测试不同均线组合,寻找最佳参数。
-
增加其他指标判断,如MACD,KD等辅助判断。
-
优化动能指标的参数,如回溯周期,映射范围等。
-
添加止损机制来控制风险。
-
不同品种参数不一致,可考虑采用机器学习特征提取。
-
加入量能指标,避免不合理的交叉信号。
本策略集大周期趋势跟踪和自定义动能指标双重过滤的优势于一身,可靠性高,实战价值强。通过参数优化和辅助技术指标补强,可望获得更出色的表现。该策略思路新颖,可为其他趋势跟踪策略提供借鉴,是量化交易策略库中一个有价值的补充。
||
This strategy uses moving average crossovers as trading signals, combined with volatility indicator BB and a custom momentum indicator for filtration, aiming to improve the reliability of MA crossover signals and reduce false signals.
-
Use 50-period EMA and 200-period SMA to form golden cross and death cross signals.
-
When price is in an uptrend, require price to be above 200-day line and custom momentum indicator value below 25 to generate buy signals.
-
When price is in a downtrend, require price to be below 200-day line and custom momentum indicator value above 75 to generate sell signals.
-
Custom momentum indicator maps BB midline and band distance into 0-100 range based on historical maximums and minimums.
-
Momentum indicator reflects relative price volatility, threshold filtering helps reduce false crossovers.
-
Utilize strengths of EMA and SMA to capture medium-long term trends.
-
Increased filtration with momentum indicator improves reliability and reduces false signals.
-
BB band distance reflects volatility intensity, historical normalization avoids parameter dependency.
-
Customizable EMA, SMA periods and momentum threshold adaptable to varying market environments.
-
Simple logic with optimization flexibility, strong practicality.
-
EMA and SMA have lagging effect, may miss short-term opportunities.
-
Trend following nature unsuitable for range-bound markets.
-
Momentum threshold requires iterative backtesting for optimal parameter, risks overfitting.
-
Longer-term systems offer steady but potentially limited absolute returns.
-
Can shorten MA periods or add complementary indicators to improve adaptability.
-
Test different MA combinations for optimal parameters.
-
Add complementary indicators like MACD, KD for additional validation.
-
Optimize momentum indicator parameters like lookback period, mapping range.
-
Incorporate stop loss to control risks.
-
Adjust for symbol-specific parameters using machine learning feature extraction.
-
Add volume indicators to avoid unreasonable crossover signals.
This strategy combines the strengths of long-term trend following and dual momentum threshold filtering for high reliability and practical value. Further improvements are possible through parameter optimization and complementary techniques. The innovative concept provides valuable insights for other trend systems. A valuable addition to the algorithmic trading strategy library.
[/trans]
Strategy Arguments
| Argument | Default | Description |
|---|---|---|
| v_input_1 | 20 | EMA Length |
| v_input_2 | 2 | Standard Deviation Length |
| v_input_3 | 1000 | Take Profit (in Points) |
| v_input_4 | 2500 | Stop Loss (in Points) |
Source (PineScript)
/*backtest
start: 2023-10-26 00:00:00
end: 2023-10-27 13:00:00
period: 1m
basePeriod: 1m
exchanges: [{"eid":"Futures_Binance","currency":"BTC_USDT"}]
*/

//@version=4
strategy(title="EMA Difference Mapping with Trades", shorttitle="EMA Diff Map", overlay=false)

// Inputs
emaLength = input(20, "EMA Length")
stdDevLength = input(2, "Standard Deviation Length")
priceSource = close
takeProfitPoints = input(1000, title="Take Profit (in Points)")
stopLossPoints = input(2500, title="Stop Loss (in Points)")

// Calculate EMA
ema = ema(priceSource, emaLength)

// Calculate Standard Deviation
stdDev = stdev(priceSource, stdDevLength)

// Calculate differences
diff1 = (ema + stdDev) - ema
diff2 = ema - (ema - stdDev)

// Calculate min and max differences from last year
lookbackPeriod = 504 // Number of trading days in a year
minDiff1 = lowest(diff1, lookbackPeriod)
maxDiff1 = highest(diff1, lookbackPeriod)
minDiff2 = lowest(diff2, lookbackPeriod)
maxDiff2 = highest(diff2, lookbackPeriod)

// Map differences based on requirements
mappedDiff1 = 50 + 50 * ((diff1 - minDiff1) / (maxDiff1 - minDiff1))
mappedDiff2 = 50 - 50 * ((diff2 - minDiff2) / (maxDiff2 - minDiff2))

// Combine mapped differences into a single line
mappedLine = if close > ema
    mappedDiff1
else
    mappedDiff2

// Plot 'mappedLine' in the main chart area conditionally
plot(mappedLine, title="EMA Difference Mapping", color=(close > ema ? color.blue : na), style=plot.style_line, linewidth=2)

// Calculate the 50EMA and 200SMA
ema50 = ema(close, 50)
sma200 = sma(close, 200)

// Plot the 50EMA and 200SMA on the main chart
plot(ema50, color=color.blue, title="50 SMA", linewidth=2)
plot(sma200, color=color.red, title="200 SMA", linewidth=2)

// Initialize trade variables
var bool waitingForBuy = na
var bool waitingForSell = na
var bool buyConditionMet = false
var bool sellConditionMet = false

if not sellConditionMet and crossunder(ema50, sma200)
    sellConditionMet := true
    waitingForBuy := false

if sellConditionMet
    waitingForSell := true
    sellConditionMet := false

if waitingForSell and close < sma200 and mappedLine > 75
    strategy.entry("Sell", strategy.short)
    strategy.exit("Sell Exit", "Sell", profit=takeProfitPoints, loss=stopLossPoints)
    waitingForSell := false

// Define the strategy conditions and execute trades
if not buyConditionMet  and crossover(ema50, sma200)
    buyConditionMet := true
    waitingForSell := false

if buyConditionMet
    waitingForBuy := true
    buyConditionMet := false

if waitingForBuy and close > sma200 and mappedLine < 25
    strategy.entry("Buy", strategy.long)
    strategy.exit("Buy Exit", "Buy", profit=takeProfitPoints, loss=stopLossPoints)
    waitingForBuy := false
Detail
https://www.fmz.com/strategy/430998
Last Modified
2023-11-03 16:13:20
