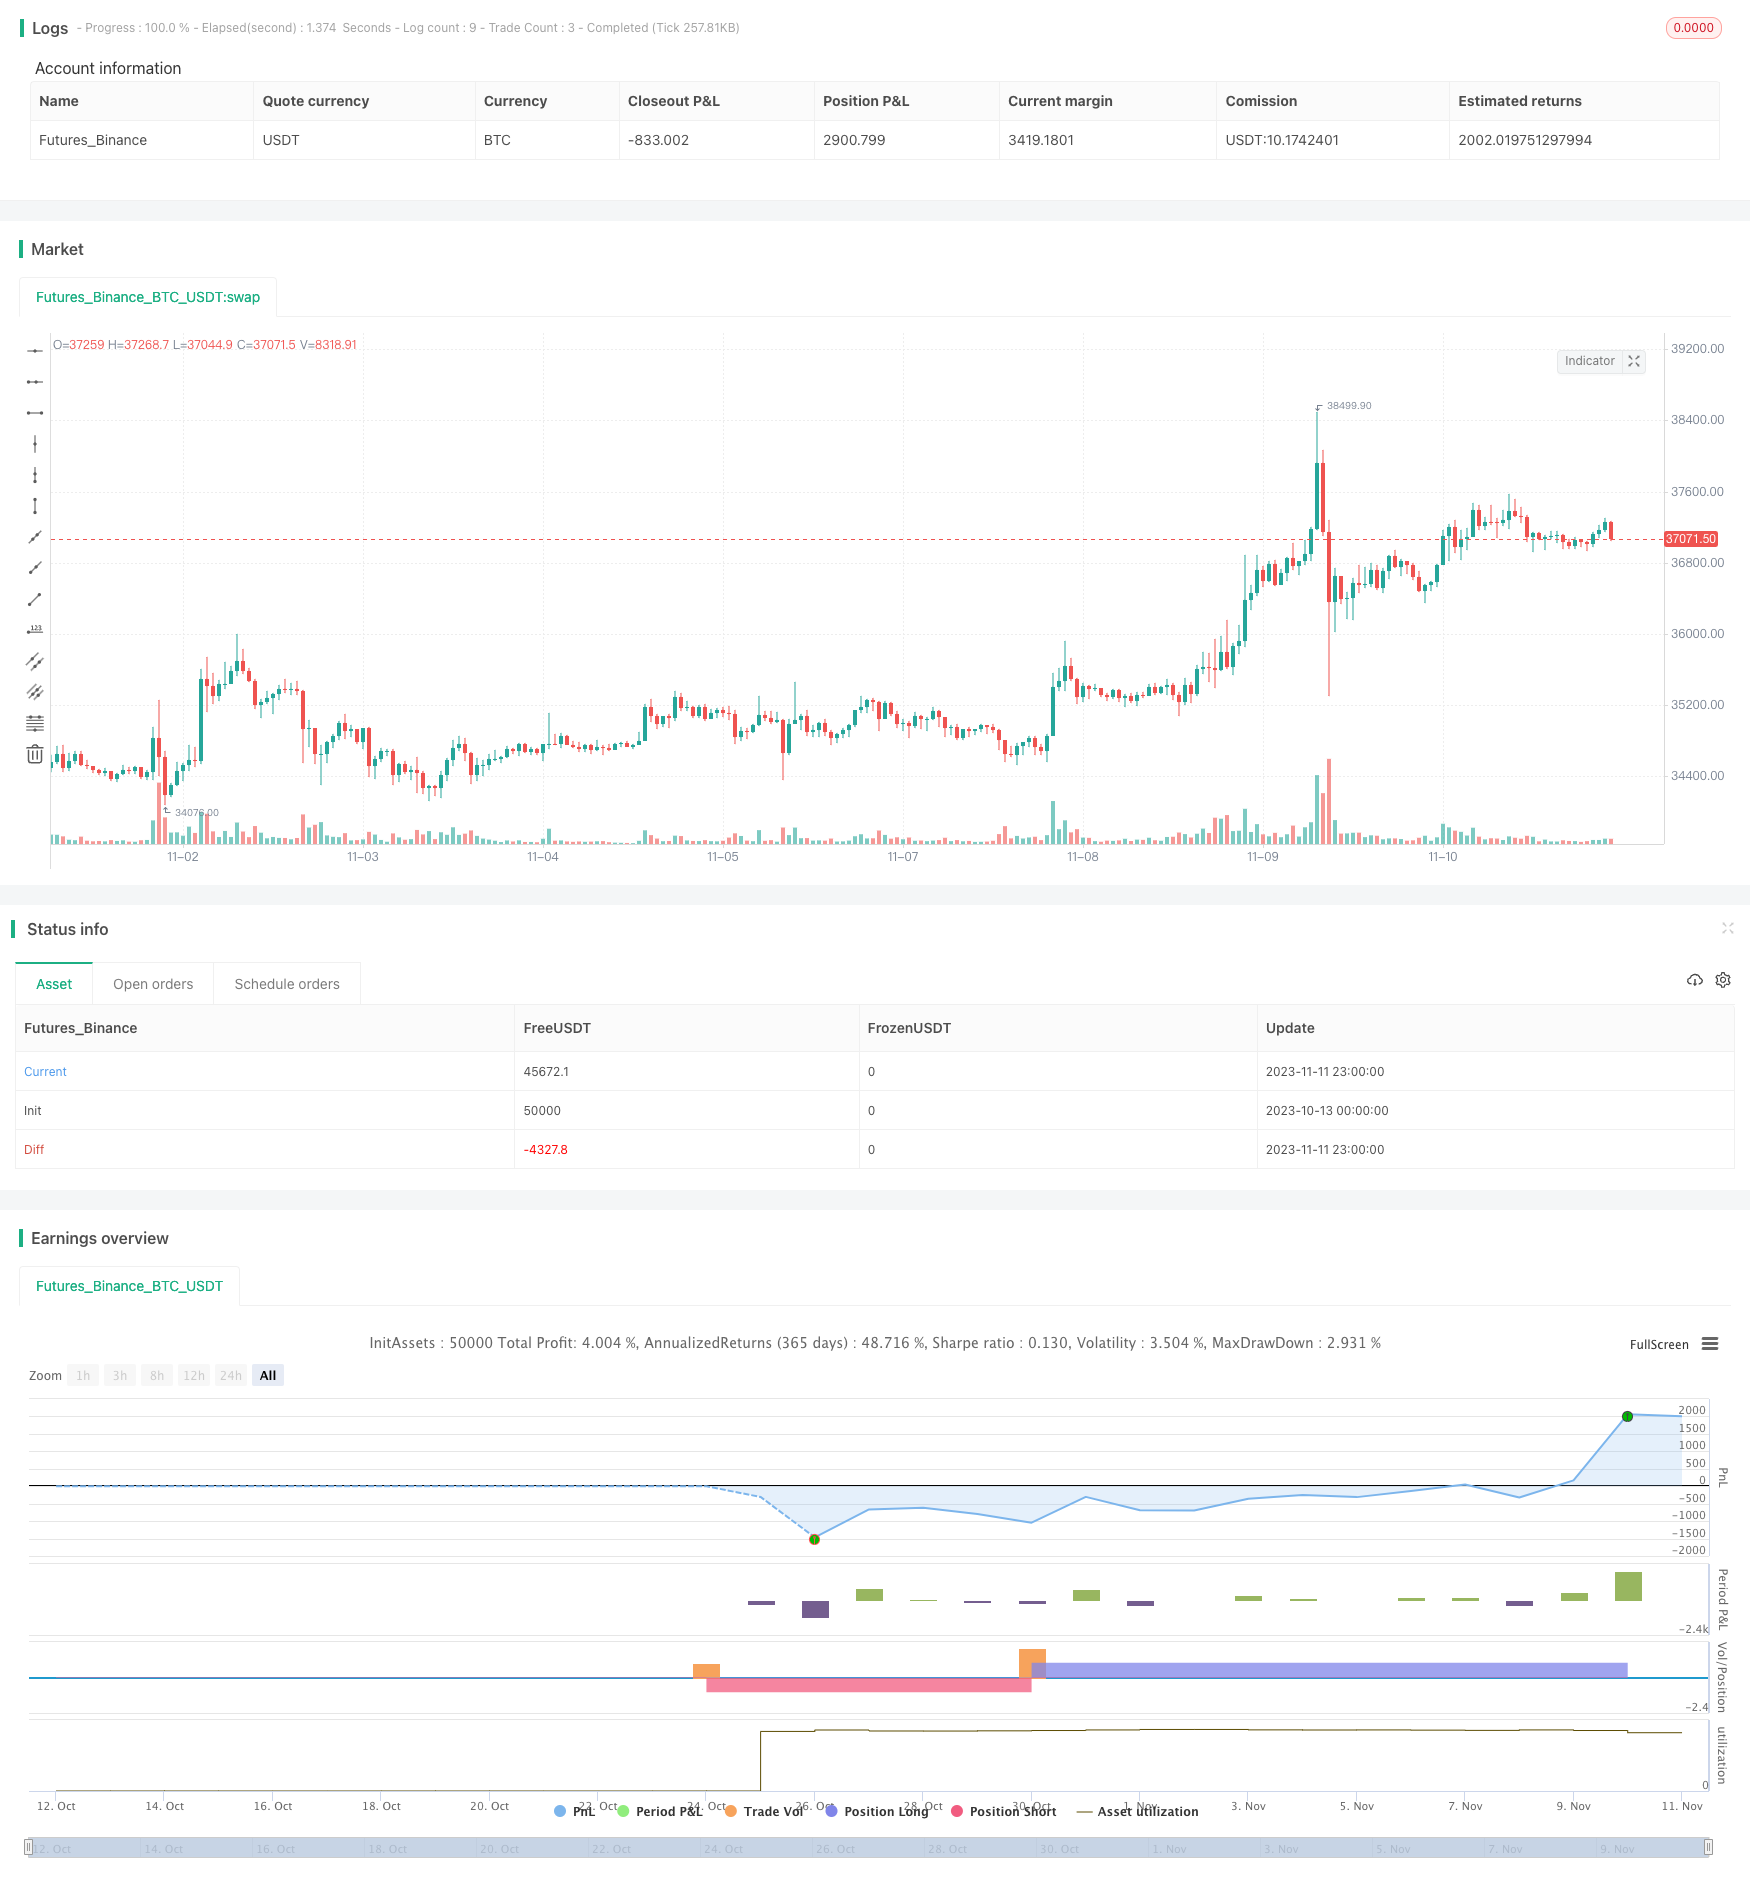
Name
极端分布摆动策略Extreme-Distribution-Swing-Strategy
Author
ChaoZhang
Strategy Description
本策略旨在利用极端分布检测Chande动量震荡指标的极端值,在比特币和加密货币的1分钟时间框架下进行交易。但是参数可以调整适用于任何交易对。
经过对Chande动量指标的长时间研究,我决定创建一个利用正态分布百分位数水平进行入市的策略。这可以在1分钟时间框架内产生连续若干天的漂亮收益,最终目标是使策略的更强大版本在机器人上运行并获利。本策略定义严格,也可以放宽参数以进行更多交易,从而获得更高的样本量和更好的夏普比率。
该策略检查Chande的值是否处于根据过去几百个Chande值计算的极端百分位数中,如果是,则开仓。
止损和止盈还没有集成到本策略中,但这将是下一个添加的功能,以尽量减少损失和放大潜在利润。
任何流动的加密货币交易对在低时间轴上都会带来良好的结果。
我们还有一个免费的15分钟和1小时策略。
该策略首先计算Chande动量震荡指标,该指标基于当天收盘价较前一日收盘价的变化计算得出。具体来说,它通过计算上涨变化之和与下跌变化之和的比值来衡量价格变化的动量。
然后,该策略记录过去一定周期内(默认425个周期)的Chande值,并计算出不同百分位数水平。当当前Chande值达到预设的极端百分位数(默认买入在1%,卖出在99%)时,触发长/短仓开仓信号。平仓信号则在Chande值达到正常水平百分位数时触发(默认97.5%和2.5%)。
通过这种方式,策略可以捕捉Chande值的极端突破,实现对突发趋势的捕捉。同时,也避免了Chande值长期维持极端状态时重复开仓的风险。
- 利用Chande指标的动量特征,能够快速捕捉市场突发趋势
- 采用正态分布概率检测极端值,回撤风险较小
- 可调参数灵活,适用于不同市场环境
- 简单直观的策略逻辑,容易理解实现
- Chande作为动量指标,对短期市场噪音敏感,可能产生假信号
- 针对极端值交易,空仓时间长,日内交易频次较低
- 未设置止损止盈,存在亏损扩大的风险
- 参数设置不当可能导致过优化
风险管理应注意设置止损止盈,适当放宽极端参数,结合趋势指标过滤假信号。此外,优化参数时应注意避免过度优化。
该策略可以从以下几个方面进行优化:
-
加入止损止盈规则,设置合理的止损幅度,控制单笔亏损风险。
-
优化参数,调整长短周期参数组合,适应不同市场环境。可加入步进优化算法找到最优参数。
-
增加过滤条件,结合趋势指标如MA等,过滤不利趋势下的假信号,提高策略稳定性。
-
多时间框架结合,在高时间框架确定趋势方向,在低时间框架进行入市。
-
测试不同交易品种的参数健壮性,调整适应更多品种。
-
引入机器学习算法,利用AI对参数及过滤条件进行优化,实现动态调整。
本策略整体来说是一个利用Chande动量指标极端值进行捕捉趋势交易的策略思路。它 Straightforward 的策略逻辑和高效的运行方式非常适合快速捕捉突发趋势。同时,也需要注意控制风险,避免过优化,并进行多方面优化以适应不同市场环境。总体而言,该策略提供了一个交易市场突发趋势的有效思路,值得进一步研究和应用。
||
This strategy aims to detect extremes of the Chande Momentum Oscillator using extreme distribution detection on 1-minute timeframes mainly for Bitcoin and cryptocurrencies. However, parameters can be adjusted for any pair.
After extensive research on the Chande momentum oscillator, I decided to create a strategy that uses normal distribution percentile levels to snipe entries. This in turn can create nice profits over consecutive days on the 1-minute timeframe, with the end goal being to get a stronger version of this strategy running on a bot and print some money. The strategy is tightly defined but can also be loosened up to make more trades, giving a higher sample size and better Sharpe ratio.
The strategy checks if the Chande value is in an extreme percentile based on the last few hundred Chande values - if it is it will open a position.
No stop loss or take profit is implemented in the swing yet, but this will be the next addition to really minimize loss and amplify potential profits.
Any liquid crypto pair on the lower timeframes will net a good result with this strategy.
We also have a free 15M and 1H strategy available.
The strategy first computes the Chande Momentum Oscillator, which is based on the change between the current period's close and previous period's close. Specifically, it measures the momentum of price changes by calculating the ratio of the sum of the uptick changes over the sum of the downtick changes.
It then records the Chande values over a certain lookback period (default 425 periods) and computes the different percentile levels. When the current Chande value reaches a preset extreme percentile (default 1% for buy, 99% for sell), it triggers a long/short entry signal. The exit signals are triggered when the Chande value reaches normal percentile levels (default 97.5% and 2.5%).
In this way, the strategy can capture extreme breakouts of the Chande value, allowing it to catch sudden trending moves. It also avoids the risk of repeated entries when the Chande value stays at extreme levels for prolonged periods.
- Captures market bursts quickly using momentum of Chande indicator
- Low drawdown risk with normal distribution extreme detection
- Flexible parameters adaptable to different market regimes
- Simple and intuitive strategy logic, easy to understand and implement
- Chande prone to false signals as momentum indicator sensitive to short-term noise
- Long drawdown periods with extreme value trading, low intraday trade frequency
- Risk of losing swings with no stop loss/profit target
- Overoptimization risk with improper parameter tuning
Risk management should focus on using stops, normalizing extreme parameters, and filtering signals with trend. Avoid over-optimizing parameters.
The strategy can be optimized in several aspects:
-
Add stop loss/profit taking to control loss per trade at reasonable levels.
-
Optimize parameters by adjusting short/long lookbacks for different markets. Step-wise walk-forward optimization can find optimal parameters.
-
Add filter conditions with trend indicators like MA to remove false signals against overall trend. Improves strategy robustness.
-
Combine multiple timeframes, using higher TF to gauge trend direction and lower TF for entry.
-
Test parameter robustness across different products, adjust for more varieties.
-
Introduce machine learning to optimize parameters and filters dynamically.
Overall this is a strategy utilizing extreme values of the Chande momentum oscillator to capture trending moves. Its straightforward logic and efficient execution make it very suitable for quickly capitalizing on burst trends. At the same time, controlling risk, avoiding overoptimization, and multi-dimensional optimization are needed to adapt it across market regimes. In summary, it provides an effective approach for trading market bursts worth further research and application.
[/trans]
Strategy Arguments
| Argument | Default | Description |
|---|---|---|
| v_input_1 | 9 | length |
Source (PineScript)
/*backtest
start: 2023-10-13 00:00:00
end: 2023-11-12 00:00:00
period: 1h
basePeriod: 15m
exchanges: [{"eid":"Futures_Binance","currency":"BTC_USDT"}]
*/

//@version=4
strategy("Chande Minute Swinger", overlay=true)

//Chande

length = input(9, minval=1)
src = close
momm = change(src)
f1(m) => m >= 0.0 ? m : 0.0
f2(m) => m >= 0.0 ? 0.0 : -m
m1 = f1(momm)
m2 = f2(momm)
sm1 = sum(m1, length)
sm2 = sum(m2, length)
percent(nom, div) => 100 * nom / div
chandeMO = percent(sm1-sm2, sm1+sm2)

//Parameters to change

lengthLookback = 425 //425 golden number
buyPercentile = 1
sellPercentile = 99
linePercentileLow = 2.5
linePercentileHigh = 97.5

buy = percentile_nearest_rank(chandeMO, lengthLookback, buyPercentile)
exitBuy= percentile_nearest_rank(chandeMO, lengthLookback, linePercentileHigh)
sell = percentile_nearest_rank(chandeMO, lengthLookback, sellPercentile)
exitSell = percentile_nearest_rank(chandeMO, lengthLookback, linePercentileLow)

chandeMA = sma(chandeMO, 9) //sma for potential other strategies implementing cross / trend

//Entry conditions

closeLongCondition = chandeMO > exitBuy ? true : false
closeShortCondition = chandeMO < exitSell ? true : false
longCondition = chandeMO < buy
shortCondition = chandeMO > sell

if (longCondition)
    strategy.entry("long", strategy.long)


if (shortCondition)
    strategy.entry("short", strategy.short)

//Introducing the closes and a stoploss will minimise loss and bring up the sharpe ratio
//Current settings are enabled for maximum potential but big risk

//strategy.close("long", when=(closeLongCondition == true))
//strategy.close("short", when=(closeShortCondition == true))
Detail
https://www.fmz.com/strategy/431960
Last Modified
2023-11-13 17:03:08
