Name
海龟突破EMA交叉策略Turtle-Breakout-EMA-Cross-Strategy
Author
ChaoZhang
Strategy Description
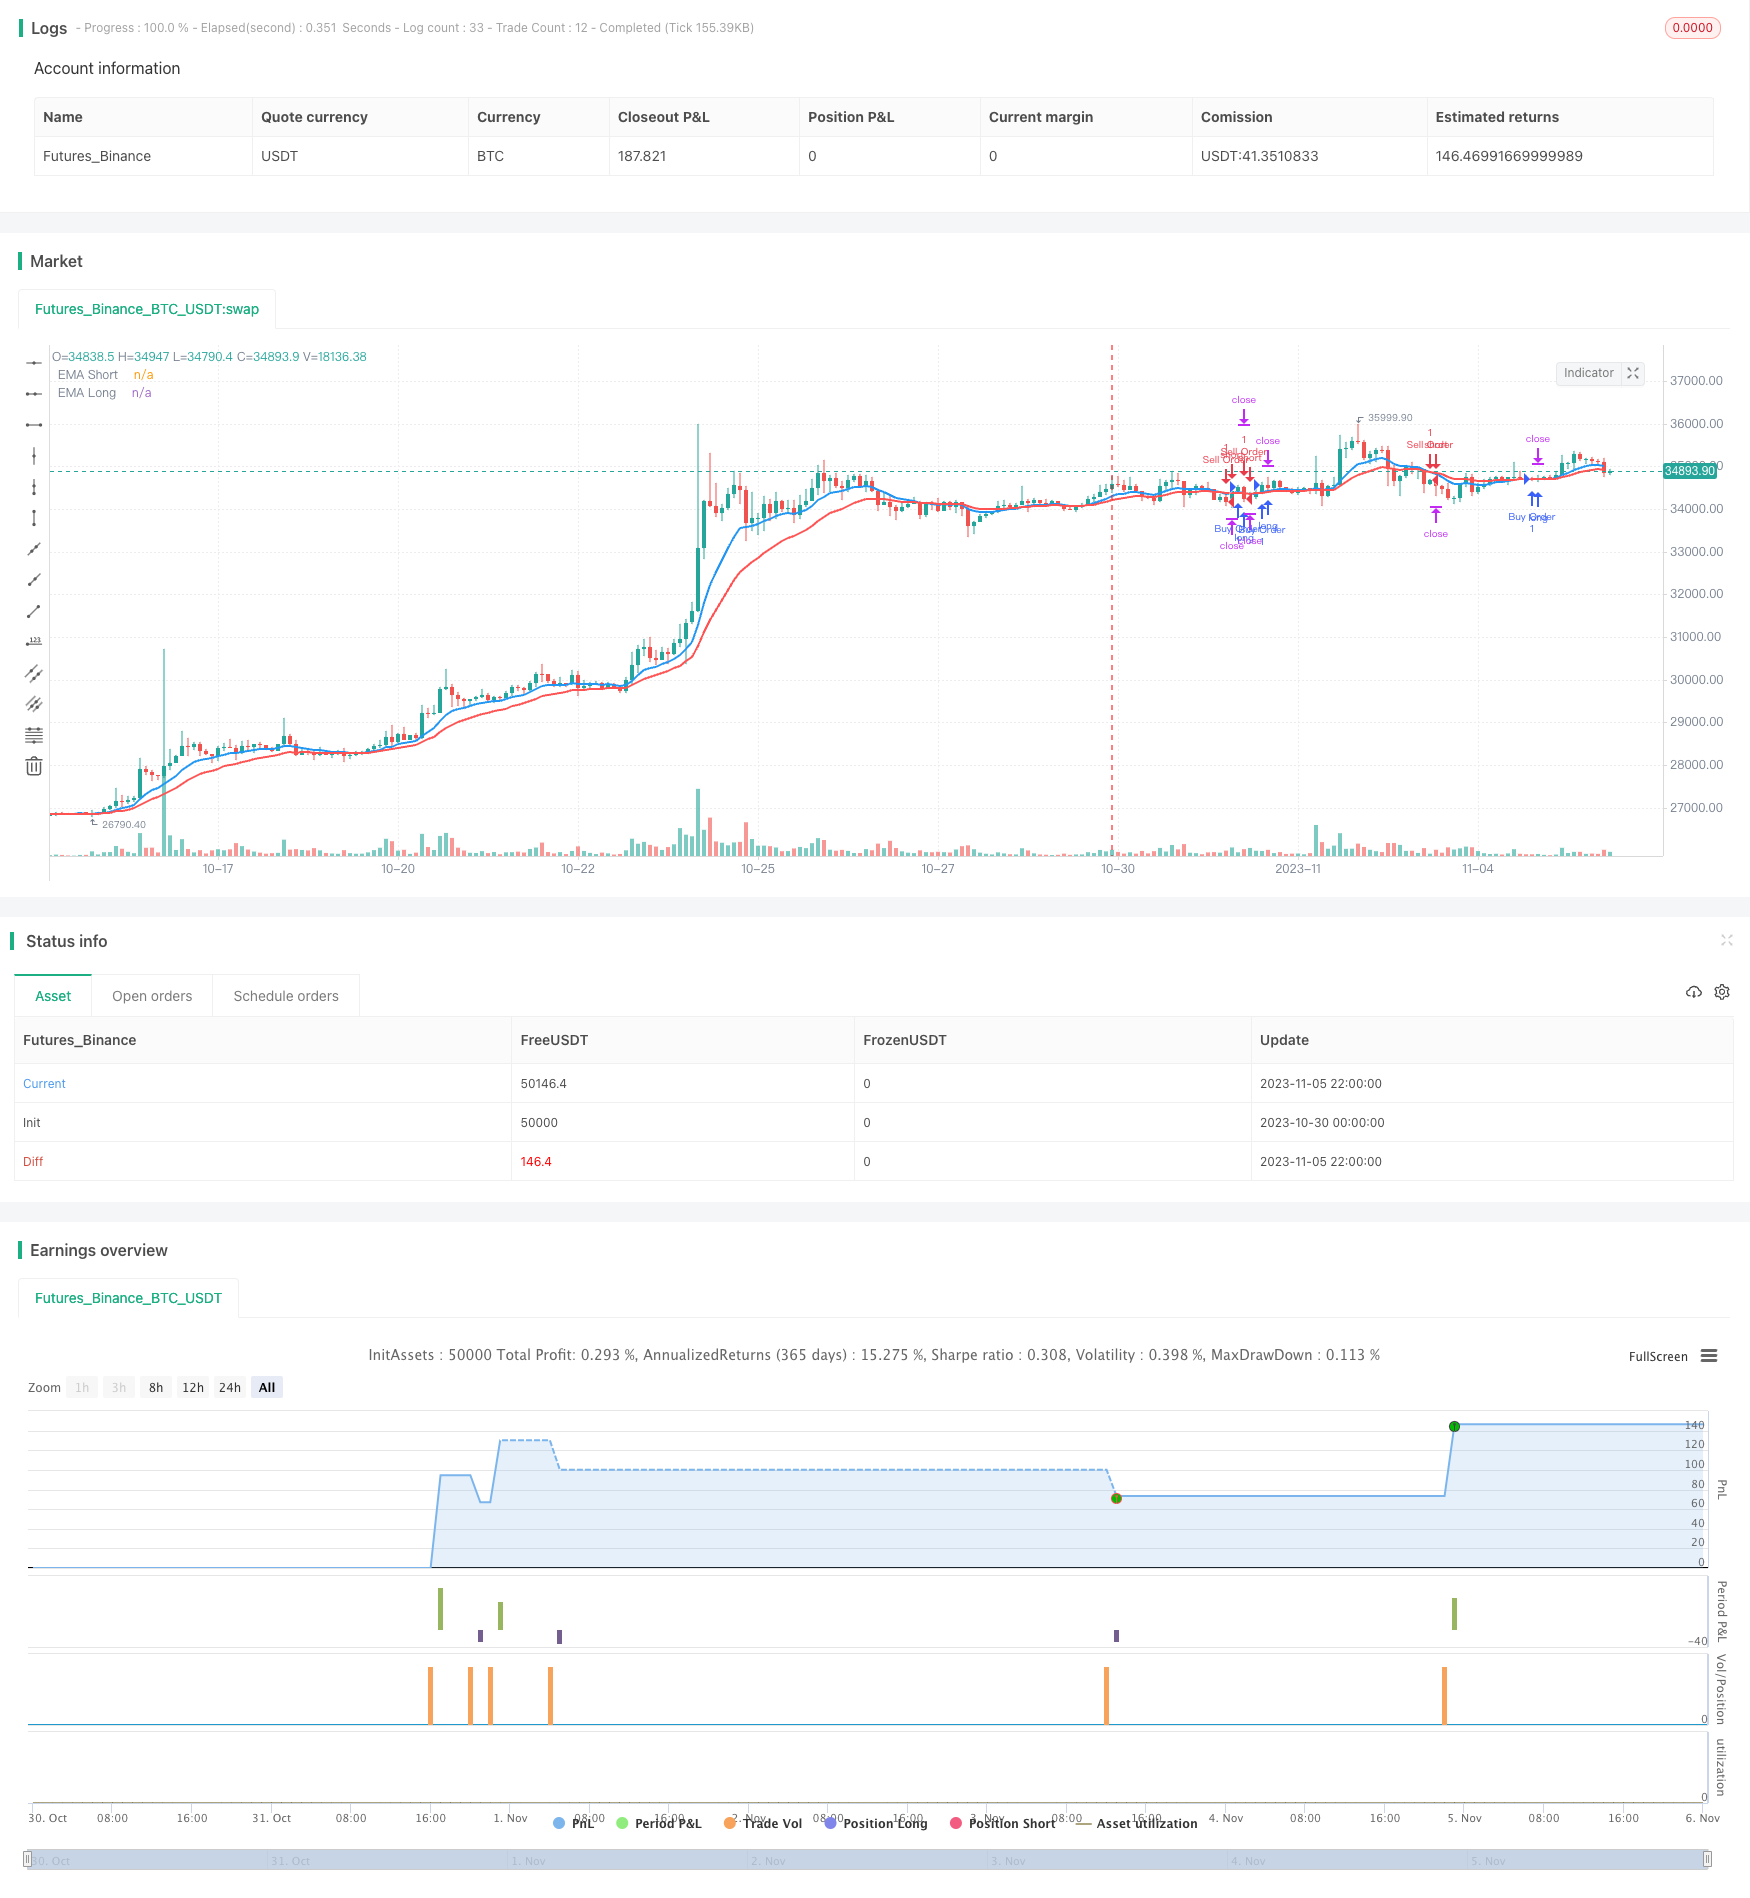
该策略运用两个不同周期的EMA均线,通过它们的交叉来判断趋势反转,以此作为入场和出场信号。策略简单易懂,容易操作。
该策略使用ta.ema函数计算两个EMA均线,一个长度为10周期,一个长度为20周期,代表短期和长期趋势。代码通过ta.crossover和ta.crossunder判断两个EMA的交叉情况,当短期EMA上穿长期EMA时做多,当短期EMA下穿长期EMA时做空。这样利用不同周期EMA均线的交叉来捕捉趋势的转折点。
该策略还使用了变量lastCrossTime记录上次交叉时间,防止重复交叉产生无谓交易。每次有效交叉时,先平掉当前所有头寸,然后再按照交叉方向开仓做单。开仓后设置止盈止损平仓出场。
-
策略思路简单清晰,容易理解和操作。
-
利用EMA交叉判断趋势反转点,这是一种常用而有效的技术指标策略。
-
采用不同周期EMA,可以在保证捕捉大趋势的同时,也提高对短期变化的敏感性。
-
设置止盈止损,可以控制单次交易的风险和收益。
-
使用lastCrossTime变量过滤重复信号,避免无谓交易。
-
EMA交叉容易产生假信号,存在一定的误判风险。
-
固定的TP和SL难以应对市场的变化,应该设置动态止盈止损。
-
仅基于EMA交叉的系统,在震荡行情中容易造成亏损。
-
未考虑交易成本的影响,实际操作中需要注意spread等交易成本。
-
该策略主要适用于趋势性行情,在震荡行情中效果可能不佳。
可以通过优化止盈止损,增加过滤条件,组合其他指标等方式来改善。实盘时需要严格控制风险,避免单笔损失过大。
-
可以测试优化EMA的参数,寻找更合适的周期组合。
-
增加像KDJ,MACD等辅助指标判断。避免在震荡行情中无谓交易。
-
设置动态止盈止损,比如随着趋势进行边际止损。
-
增加对交易量的判断,在大量出现时再考虑入场。
-
结合其他图形形态进行判断,如突破重要阻力位等。
-
考虑实盘的成本影响,设定合理的止盈止损幅度。
该策略整体思路简单清晰,利用EMA均线的快慢交叉判断趋势反转,配合止盈止损来控制风险收益。策略容易操作,但EMA交叉存在一定误判风险,需要进一步优化指标参数,并辅以其他技术指标来减少误判。在趋势行情中效果较好,但在震荡行情中则易受困。实盘时要严格把控风险,优化止盈止损幅度,适当缩小仓位。总的来说,该策略为一个基础的趋势跟踪策略,可作为量化交易的入门学习。
||
This strategy uses two EMA lines of different periods to identify trend reversals through their crossovers as entry and exit signals. The strategy is simple and easy to implement.
The strategy calculates two EMA lines using ta.ema, one with length 10 for short term and one with length 20 for long term trend. It identifies EMA crossovers and crossunders using ta.crossover and ta.crossunder to determine entry and exit points. When the short EMA crosses over the long EMA, it goes long. When the short EMA crosses under the long EMA, it goes short. This way the EMA crossovers are used to capture turning points in the trend.
The strategy also uses a variable lastCrossTime to record the time of the last crossover to avoid repeated signals. On each valid crossover, it closes all current positions first, then opens a new position in the direction of the crossover. After opening the position, take profit and stop loss are set to exit.
-
The strategy logic is simple and clear, easy to understand and implement.
-
Using EMA crossovers to identify trend reversal points is a commonly used effective technical indicator strategy.
-
Adopting EMAs of different periods helps improve sensitivity to short term moves while still catching big trends.
-
Take profit and stop loss helps control the risk and reward of each trade.
-
The lastCrossTime variable filters duplicate signals and avoids unnecessary trades.
-
EMA crossovers can generate false signals, with some whipsaw risk.
-
Fixed TP and SL may fail to adapt to changing market conditions. Dynamic levels should be used.
-
Systems relying solely on EMA crossover can suffer losses in ranging markets.
-
Trading costs like spread are not considered which impacts actual performance.
-
The strategy works better in trending rather than ranging markets.
Improvements can be made via optimizing TP/SL, adding filters, combining other indicators etc. Strict risk control and avoiding large single trade loss is essential for live trading.
-
Test and optimize EMA periods to find better combinations.
-
Add other indicators like KDJ, MACD etc. to improve signal quality and avoid whipsaws.
-
Use dynamic take profit and stop loss, such as trailing stop along the trend.
-
Consider trading volume to confirm the signals.
-
Incorporate price action patterns like breakouts to strengthen signals.
-
Account for trading costs like spread and optimize TP/SL levels accordingly.
The strategy identifies trend reversals using EMA crossovers in a simple and straightforward way. TP/SL are used to control risks and rewards. It is easy to implement but EMA crossovers have whipsaw risks. Further optimizations can be done by tuning parameters, adding filters and combining other indicators to improve robustness. It performs better in trending rather than ranging markets. Strict risk management and optimal TP/SL sizing is crucial for live trading. Overall it serves as a basic trend following system and is a good starting point for algorithmic trading education.
[/trans]
Strategy Arguments
| Argument | Default | Description |
|---|---|---|
| v_input_int_1 | 10 | Length EMA Short |
| v_input_int_2 | 20 | Length EMA Long |
| v_input_int_3 | true | Lot Size |
| v_input_int_4 | 600 | Take Profit Level |
| v_input_int_5 | 200 | Stop Loss Level |
Source (PineScript)
/*backtest
start: 2023-10-30 00:00:00
end: 2023-11-06 00:00:00
period: 2h
basePeriod: 15m
exchanges: [{"eid":"Futures_Binance","currency":"BTC_USDT"}]
*/

//@version=5
strategy('XXXquang', overlay=true)

// Sử dụng hàm input.int() và input.float() để tạo các trường nhập liệu với giới hạn giá trị
length1 = input.int(10, title="Length EMA Short", minval=1)
length2 = input.int(20, title="Length EMA Long", minval=1)
lotSize = input.int(1, title="Lot Size", minval=1)

takeProfitLevel = input.int(600, title="Take Profit Level", minval=1)
stopLossLevel = input.int(200, title="Stop Loss Level", minval=1)

ema1 = ta.ema(close, length1)
ema2 = ta.ema(close, length2)

var float lastCrossTime = na

if ta.crossover(ema1, ema2)
    if na(lastCrossTime)
        strategy.close_all()
    strategy.entry('Buy Order', strategy.long, qty=lotSize)
    strategy.exit('Exit Buy', 'Buy Order', profit=takeProfitLevel / syminfo.pointvalue, loss=stopLossLevel / syminfo.pointvalue)
    lastCrossTime := timenow

if ta.crossunder(ema1, ema2)
    if na(lastCrossTime)
        strategy.close_all()
    strategy.entry('Sell Order', strategy.short, qty=lotSize)
    strategy.exit('Exit Sell', 'Sell Order', profit=takeProfitLevel / syminfo.pointvalue, loss=stopLossLevel / syminfo.pointvalue)
    lastCrossTime := timenow

plot(ema1, title='EMA Short', color=color.new(color.blue, 0), linewidth=2)
plot(ema2, title='EMA Long', color=color.new(color.red, 0), linewidth=2)
Detail
https://www.fmz.com/strategy/431400
Last Modified
2023-11-07 15:40:08
