Name
渐积突破交易策略Gradual-Accumulation-Breakout-Trading-Strategy
Author
ChaoZhang
Strategy Description
[trans]
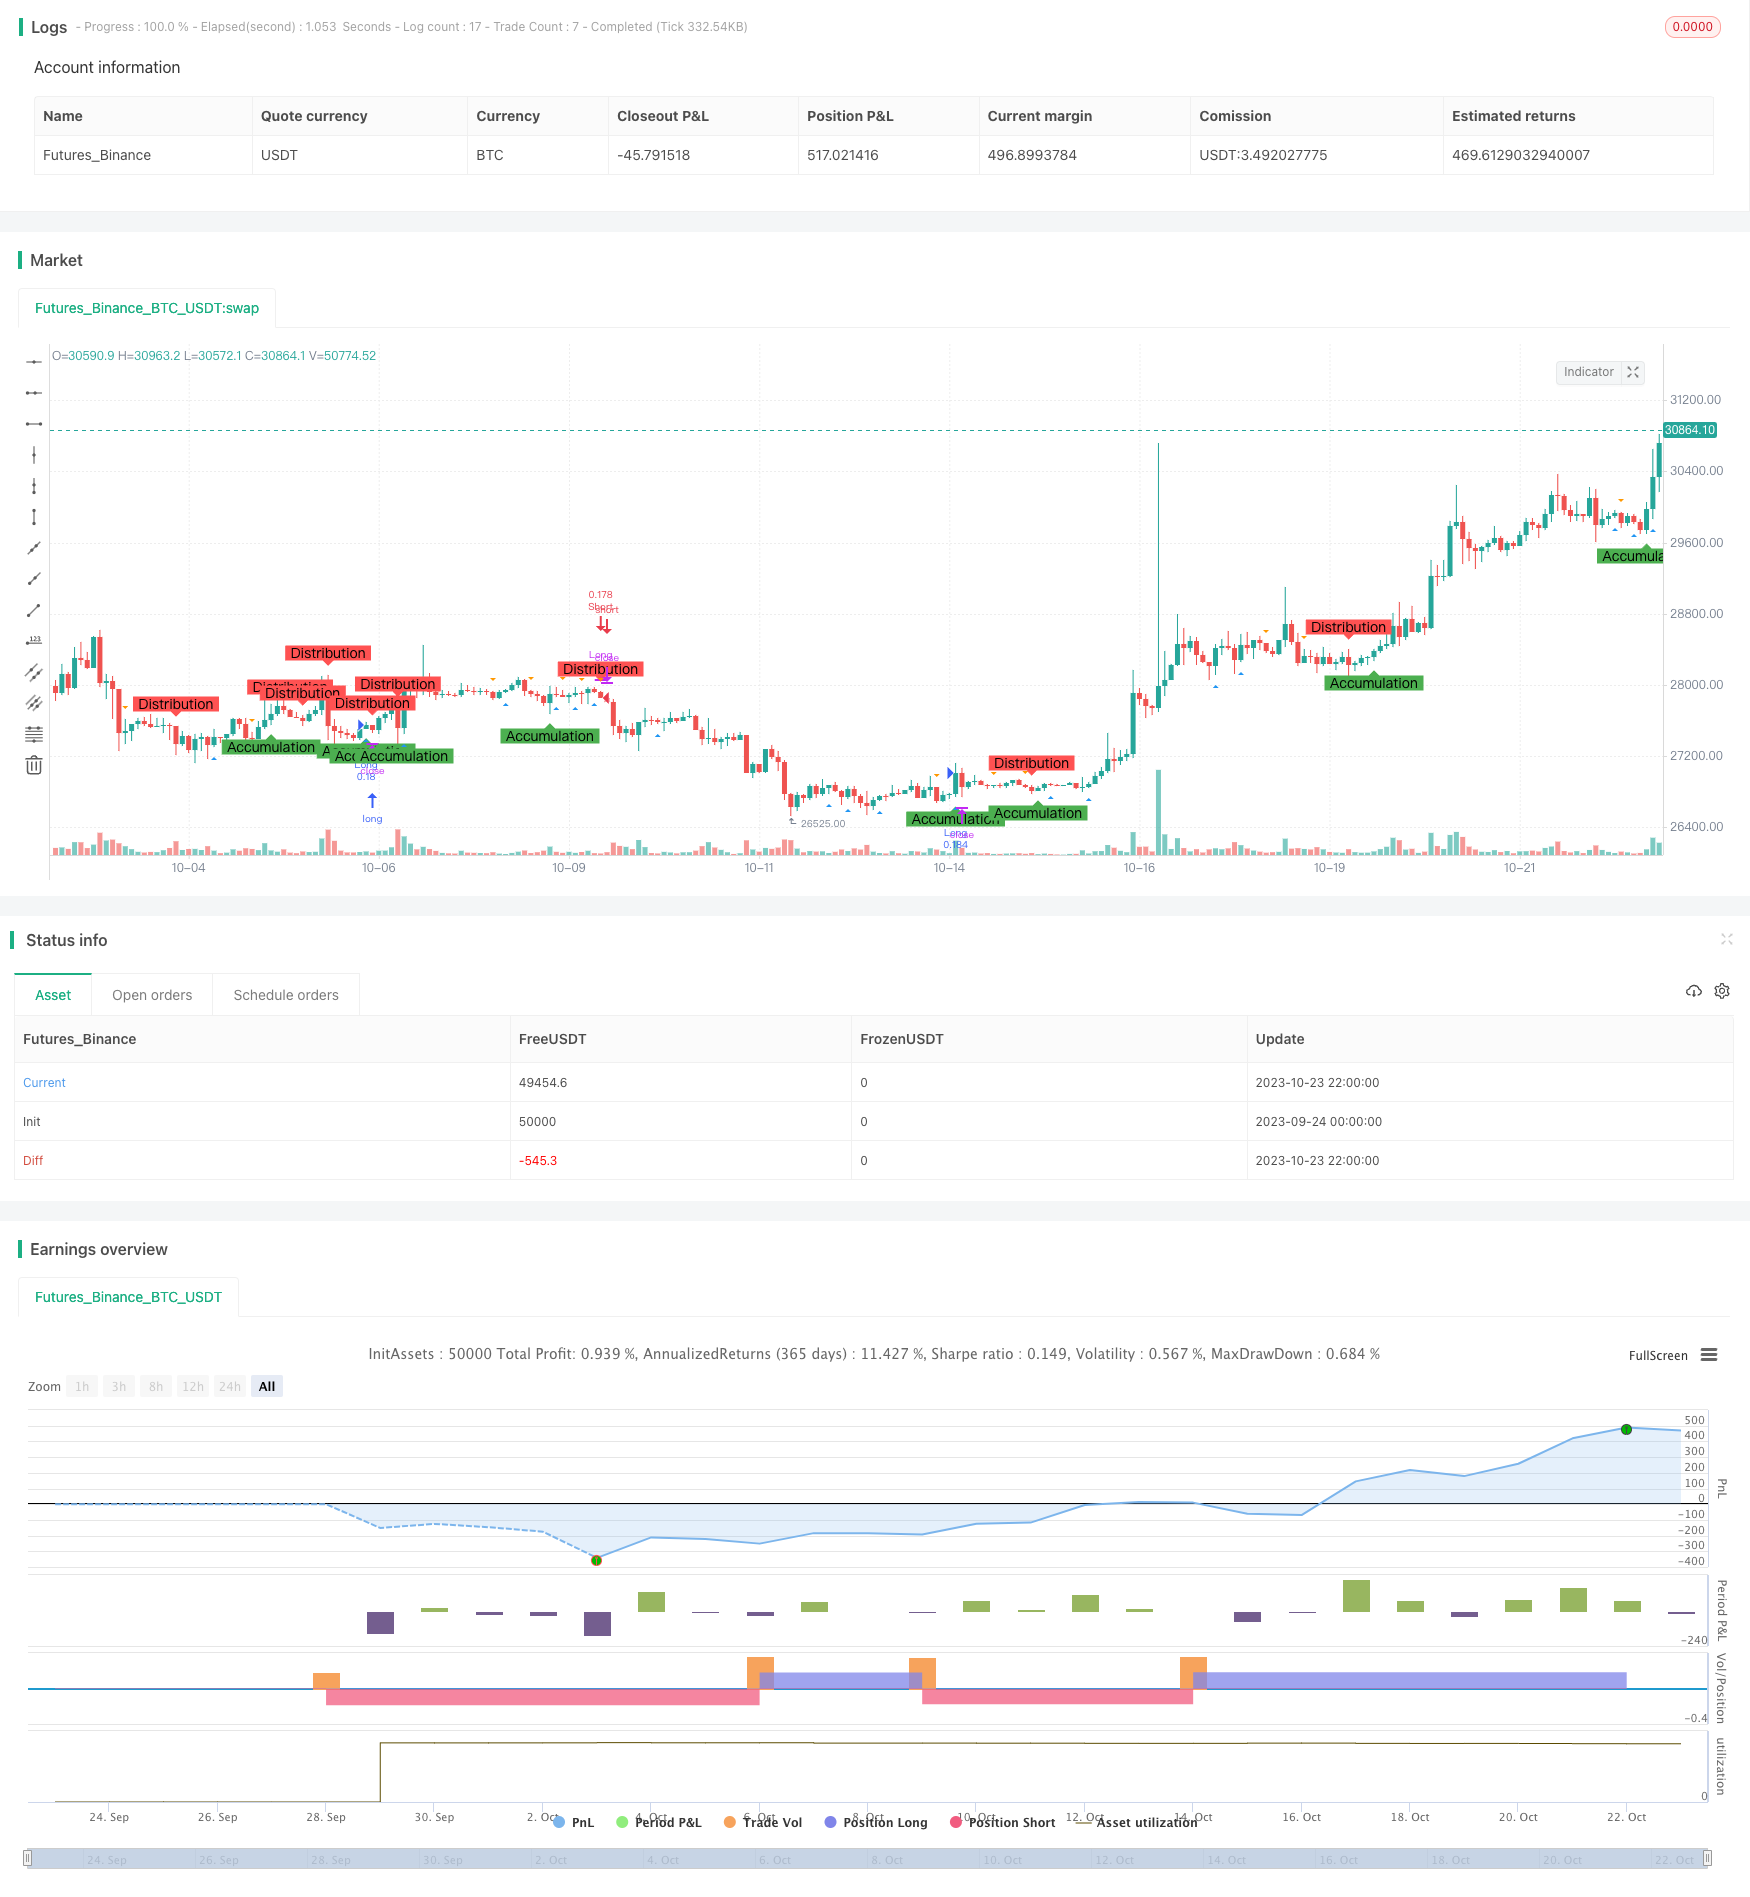
渐积突破交易策略通过识别市场的渐积和分配阶段,采用维克多分析原理,辅以弹弓形态和反转形态的判断,寻找潜在的买入和卖出机会。
-
使用不同长度的均线交叉来识别渐积和分配阶段。当收盘价上穿长度为AccumulationLength的均线时,判断为渐积阶段;当收盘价下穿长度为DistributionLength的均线时,判断为分配阶段。
-
使用不同长度的均线交叉来识别弹弓形态和反转形态。当低点上穿长度为SpringLength的均线时,判断为弹弓形态;当高点下穿长度为UpthrustLength的均线时,判断为反转形态。
-
在渐积阶段观察到弹弓形态时,做多;在分配阶段观察到反转形态时,做空。
-
设置止损水平。长仓止损价为收盘价的(1 - 止损百分比%),短仓止损价为收盘价的(1 + 止损百分比%)。
-
在图表上标注渐积阶段、分配阶段、弹弓形态和反转形态,便于形态识别。
-
使用维克多分析方法识别市场蓄势的渐积和分配阶段,可以提高交易信号的可靠性。
-
结合弹弓形态和反转形态进行交易,可以进一步验证交易信号。
-
设置止损可以有效控制单笔损失。
-
在图表上做标注,可以清晰地观察到蓄势形成的全过程。
-
该策略参数可调,可以针对不同市场和交易周期进行优化。
-
聚合行情可能导致均线信号发出错误信号。
-
弹弓形态和反转形态可能会发生失效。
-
止损被突破可能增加亏损。
-
针对不同市场需要调整参数,如果不合适可能导致交易信号错误。
-
机械交易系统回街时间可能不够灵活,需要人工监控。
-
可以测试不同市场不同周期下参数的最优组合。
-
可以考虑加入成交量的因素来确认交易信号。
-
可以设置动态止损,根据市场波动调整止损水平。
-
可以考虑加入基本面因素,避免在重要时间点出现错误交易。
-
可以加入机器学习算法来动态优化参数。
渐积突破交易策略整合了维克多分析、均线指标、形态识别等多种技术分析方法,可以有效识别市场蓄势并产生交易信号。该策略具有可靠的交易信号、可控的风险、清晰的视觉展现等优点。但作为机械交易系统,其回街时间和参数适应性还有待提高。未来的优化方向在于参数组合优化、成交量确认、止损优化、重要基本面因素纳入等。总体来说,该策略为日内短线交易提供了有效的决策支持。
||
The Gradual Accumulation Breakout Trading Strategy aims to identify potential accumulation and distribution phases in the market using the principles of Wyckoff analysis, supplemented by the detection of spring and upthrust patterns, to seek potential buying and selling opportunities.
-
Use moving average crossovers of different lengths to identify accumulation and distribution phases. When the close price crosses above the MA of length AccumulationLength, it indicates an accumulation phase. When the close price crosses below the MA of length DistributionLength, it indicates a distribution phase.
-
Use moving average crossovers of different lengths to identify spring and upthrust patterns. When the low price crosses above the MA of length SpringLength, it indicates a spring. When the high price crosses below the MA of length UpthrustLength, it indicates an upthrust.
-
Go long when a spring is observed during an accumulation phase. Go short when an upthrust is observed during a distribution phase.
-
Set stop loss levels. The long stop loss is set at close * (1 - Stop Percentage%). The short stop loss is set at close * (1 + Stop Percentage%).
-
Plot shapes on the chart to indicate identified accumulation, distribution, spring and upthrust patterns for easy visual recognition.
-
Identifying accumulation and distribution phases using Wyckoff analysis improves reliability of trading signals.
-
Confirming signals with spring and upthrust patterns provides further validation.
-
The stop loss helps control single trade loss.
-
Chart annotations clearly reveal the whole process of price coiling.
-
The adjustable parameters make this strategy optimizable across markets and timeframes.
-
Whipsaws may generate false signals during choppy price action.
-
Spring and upthrust may fail occasionally.
-
Stop loss being taken out could increase losses.
-
Incompatible parameters for different markets may cause incorrect signals.
-
Mechanical systems lack flexible discretionary control.
-
Test optimal parameter combinations across markets and timeframes.
-
Consider incorporating volume for signal confirmation.
-
Set dynamic stops based on market volatility.
-
Incorporate fundamental factors to avoid signals at major events.
-
Apply machine learning to dynamically optimize parameters.
The Gradual Accumulation Breakout Trading Strategy integrates Wyckoff analysis, moving averages, pattern recognition and other techniques to effectively identify coiling price action and generate trading signals. It has reliable signals, controlled risks, clear visuals and other advantages. As a mechanical system, its discretion and adaptability need improvement. Future optimizations involve parameter optimization, volume confirmation, stop loss enhancement, fundamental filters and more. Overall, this strategy provides effective decision support for intraday trading.
[/trans]
Strategy Arguments
| Argument | Default | Description |
|---|---|---|
| v_input_1 | 32 | Accumulation |
| v_input_2 | 35 | Distribution |
| v_input_3 | 10 | Spring |
| v_input_4 | 20 | Upthrust |
| v_input_5 | 10 | Stop Percentage |
Source (PineScript)
/*backtest
start: 2023-09-24 00:00:00
end: 2023-10-24 00:00:00
period: 2h
basePeriod: 15m
exchanges: [{"eid":"Futures_Binance","currency":"BTC_USDT"}]
*/

// This source code is subject to the terms of the Mozilla Public License 2.0 at https://mozilla.org/MPL/2.0/
// © deperp

//@version=5
strategy("Wyckoff Range Strategy",  overlay=true, initial_capital=1000, default_qty_type=strategy.percent_of_equity, default_qty_value=10, commission_type=strategy.commission.percent)

// Input Variables
AccumulationLength = input(32, "Accumulation")
DistributionLength = input(35, "Distribution")
SpringLength = input(10, "Spring")
UpthrustLength = input(20, "Upthrust")
stopPercentage = input(10, "Stop Percentage")

// Accumulation Phase
isAccumulation = ta.crossover(close, ta.sma(close, AccumulationLength))

// Distribution Phase
isDistribution = ta.crossunder(close, ta.sma(close, DistributionLength))

// Spring and Upthrust
isSpring = ta.crossover(low, ta.sma(low, SpringLength))
isUpthrust = ta.crossunder(high, ta.sma(high, UpthrustLength))

// Strategy Conditions
enterLong = isAccumulation and isSpring
exitLong = isDistribution and isUpthrust

enterShort = isDistribution and isUpthrust
exitShort = isAccumulation and isSpring

// Entry and Exit Conditions
if (enterLong)
    strategy.entry("Long", strategy.long)

if (exitLong)
    strategy.close("Long")

if (enterShort)
    strategy.entry("Short", strategy.short)

if (exitShort)
    strategy.close("Short")

// Stop Loss
stopLossLevelLong = close * (1 - stopPercentage / 100)
stopLossLevelShort = close * (1 + stopPercentage / 100)
strategy.exit("Stop Loss Long", "Long", stop=stopLossLevelLong)
strategy.exit("Stop Loss Short", "Short", stop=stopLossLevelShort)

// Plotting Wyckoff Schematics
plotshape(isAccumulation, title="Accumulation Phase", location=location.belowbar, color=color.green, style=shape.labelup, text="Accumulation")
plotshape(isDistribution, title="Distribution Phase", location=location.abovebar, color=color.red, style=shape.labeldown, text="Distribution")
plotshape(isSpring, title="Spring", location=location.belowbar, color=color.blue, style=shape.triangleup)
plotshape(isUpthrust, title="Upthrust", location=location.abovebar, color=color.orange, style=shape.triangledown)
Detail
https://www.fmz.com/strategy/430169
Last Modified
2023-10-25 17:34:41
