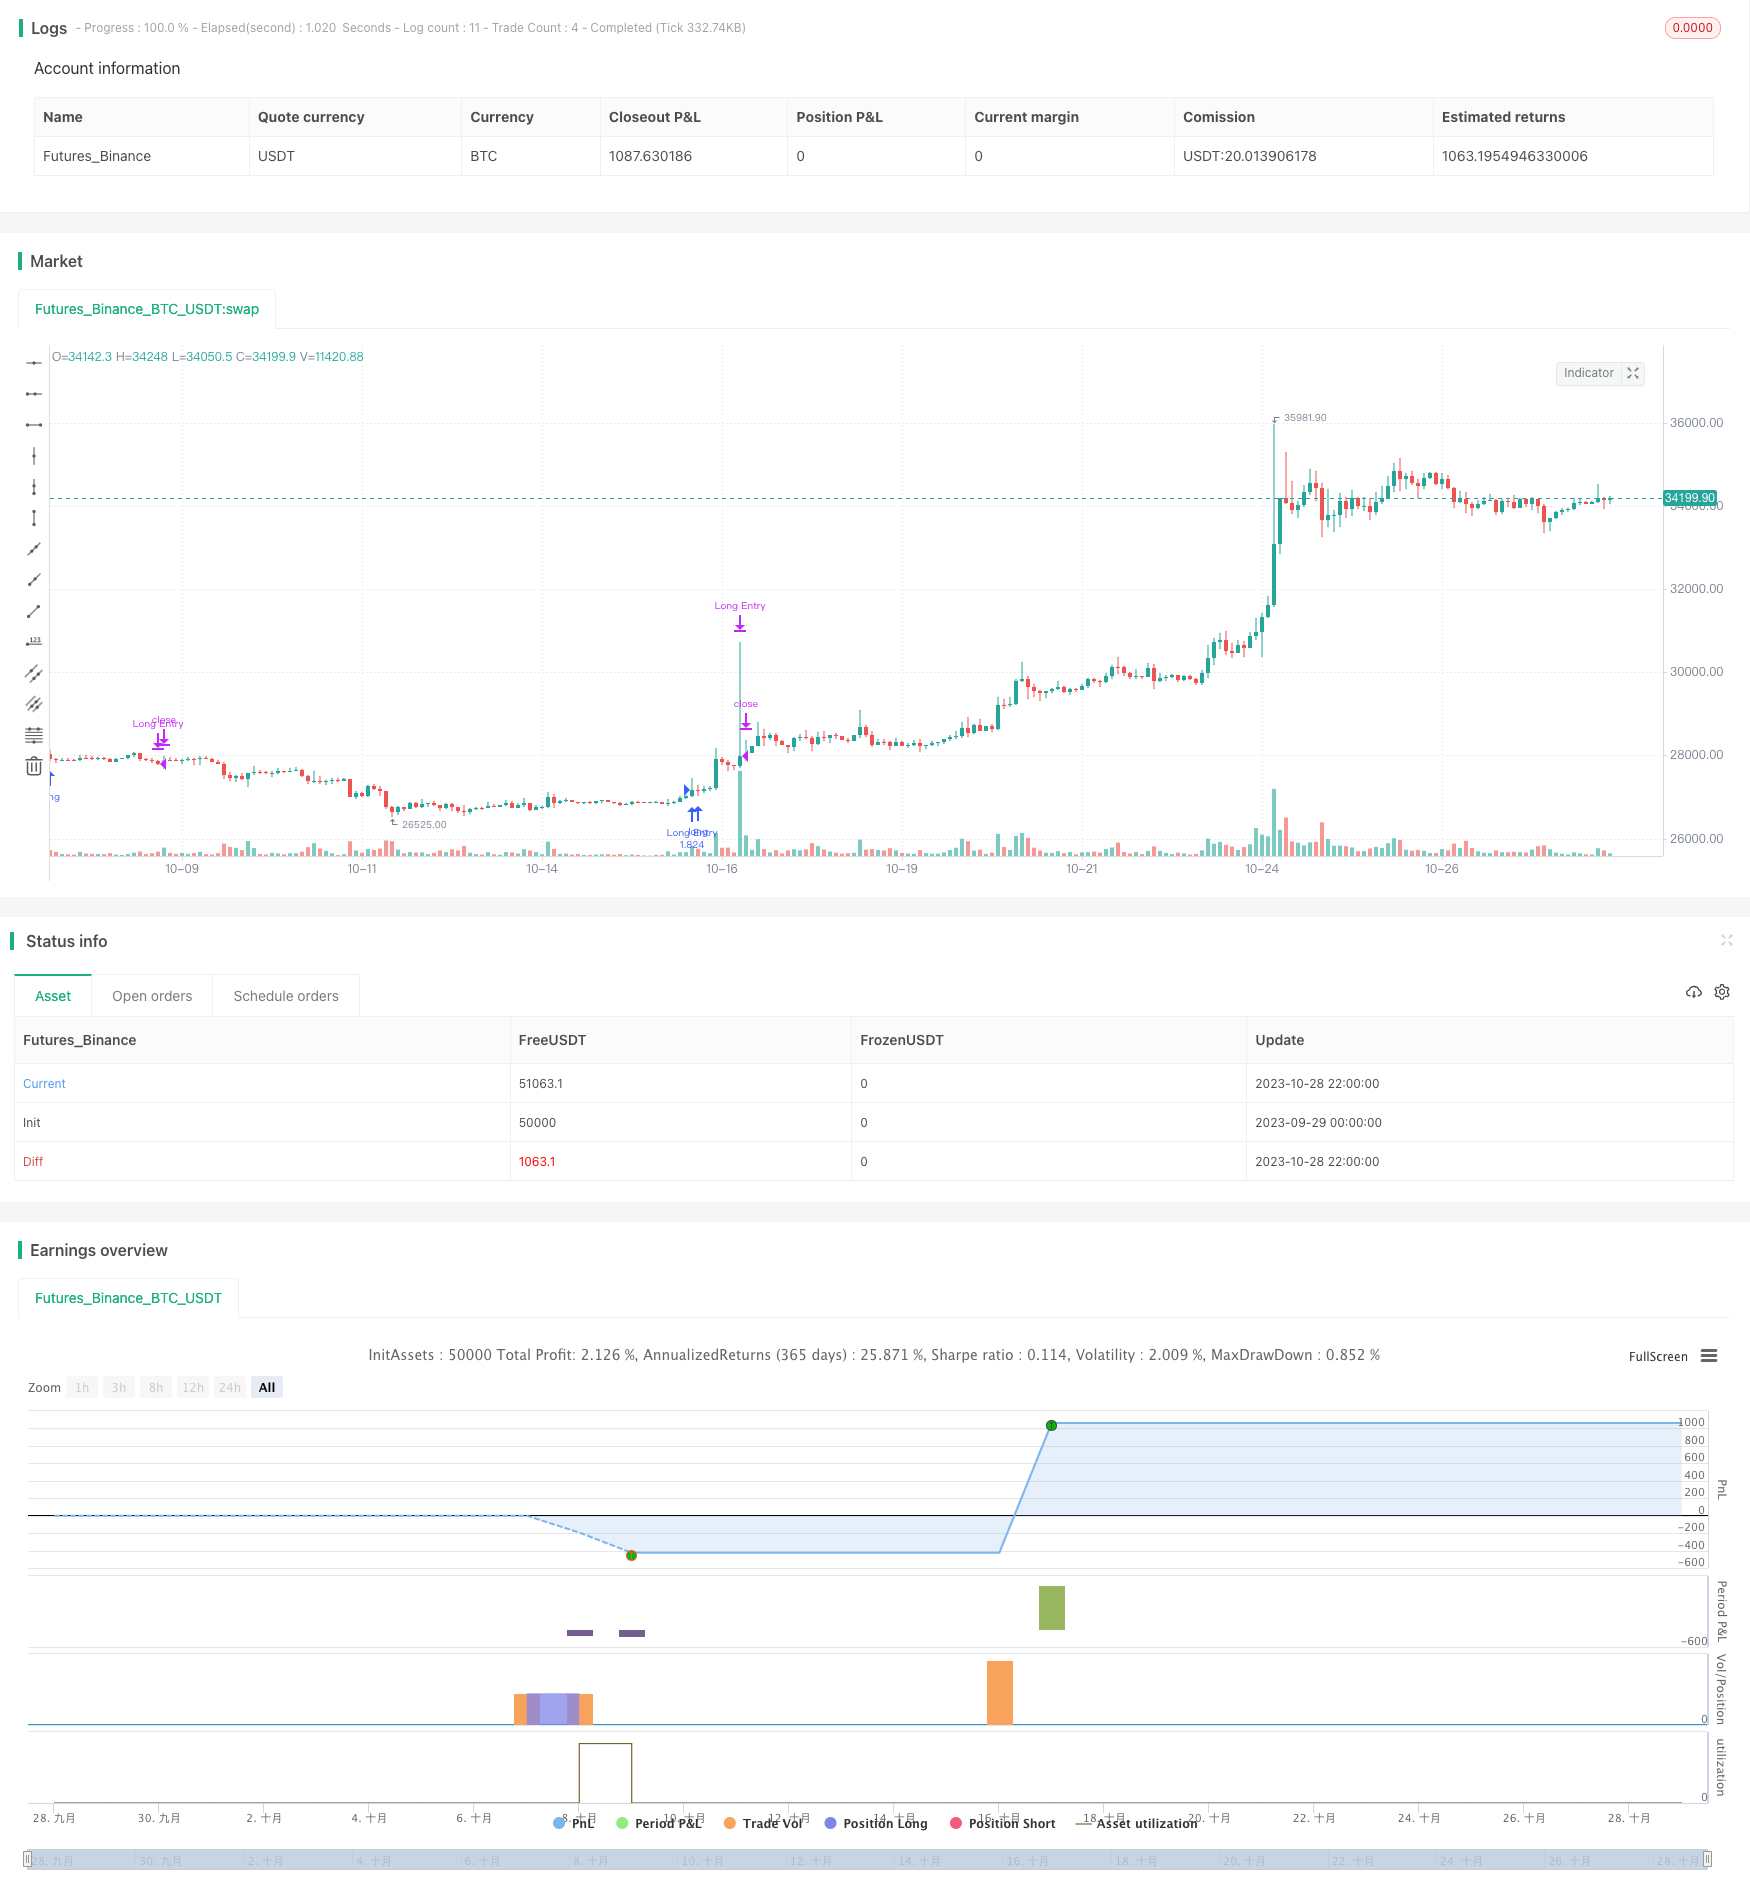
Name
特斯拉超趋势策略Tesla-Supertrend-Strategy
Author
ChaoZhang
Strategy Description
特斯拉超趋势策略是一种自定义的交易视图策略脚本,旨在为特斯拉股票或者其他相关资产生成交易信号。该策略结合多种技术指标和条件来识别潜在的多头和空头机会。
该策略主要基于以下几个关键指标:
超趋势指标: 超趋势指标结合价格数据和平均真实范围来识别显著的价格趋势方向。策略使用默认长度为10的超趋势指标判断多头或空头趋势。
相对强弱指标(RSI): 策略采用不同周期(21、3、10和28)的RSI条件来评估市场的超买超卖状态。这些RSI条件有助于确认潜在交易信号的强度。
平均方向性指数(ADX): 平均方向指数用于衡量趋势的力度。可自定义参数来微调ADX信号的平滑度和DI长度。
交易逻辑:
做多入场信号: 当以下条件同时满足时,产生做多入场信号:
- 超趋势指标从空头转为多头
- RSI(21)低于75(避免超买状态)
- RSI(3)高于65(表示短期力度较强)
- RSI(28)高于49(表示长期力度较强)
- ADX高于21(表示显著趋势)
退出信号: 当以下任意条件满足时,平仓做多头寻:
- 超趋势指标从多头转为空头
- RSI(10)低于42(表示潜在弱势)
该策略具有以下优势:
- 利用超趋势指标识别主要趋势方向,有助于避免交易市场噪音。
- 综合多个周期的RSI指标判断过热和超卖状态,可提高信号质量。
- ADX指标确保只在趋势足够明显时入场,避免无方向震荡市场的假信号。
- 结合趋势、强度和波动率指标,提供较高质量的入场和退出点。
- 可自定义指标参数,优化策略以适应不同交易品种和市场环境。
- 可在交易视图平台直接应用,无需编程即可自动化交易。
该策略也存在以下风险:
- 如同任何技术指标策略,该策略可能会生成假信号,止损措施必不可少。
- 过于依赖指标条件而忽略基本面或更长期趋势的风险。
- 优化过度以适应历史数据可能导致曲拟合,应谨慎回测。
- 实盘交易中需考虑操盘手段,如分批建仓、动态止损等风险控制。
- 面对突发事件,指标可能会失效,需要人工干预或暂停交易。
该策略还可以从以下方面进行优化:
- 尝试不同的趋势、强弱指标组合,寻找更优参数。
- 增加进场条件,如成交量突破,确保强势反转。
- 测试不同持仓时间来寻找更佳的盈利回撤比。
- 结合 IMPLIED VOL ATM 选时开启交易,避免低波动率的无效市场。
- 增加机器学习模型判断指标信号质量,提高胜率。
- 根据不同品种特点调整参数,使策略更具鲁棒性。
总体来说,特斯拉超趋势策略通过多指标组合判断强势趋势,目标识别高质量的入场和退出点。相比单一指标,该策略可过滤噪音信号,在趋势明显且强势时进行交易。但策略优化和风险控制仍需谨慎进行,不能依赖历史数据表现盲目实盘。通过不断测试和调整,该策略有望成为交易特斯拉或其他品种的有利工具。
||
The Tesla Supertrend Strategy is a customized trading view script designed to generate trading signals for Tesla stock or other related assets. This strategy combines various technical indicators and conditions to identify potential long and short opportunities.
The strategy relies primarily on the following key indicators:
Supertrend Indicator: The Supertrend combines price data and Average True Range (ATR) to identify significant trend direction. The strategy uses the default 10-period Supertrend to determine bullish or bearish trends.
Relative Strength Index (RSI): The strategy employs multiple RSI conditions with different periods (21, 3, 10, and 28) to assess overbought and oversold conditions in the market. These RSI conditions help confirm the strength of potential trading signals.
Average Directional Index (ADX): The Average Directional Index (ADX) is used to measure the strength of a trend. Customizable parameters allow fine-tuning of ADX signals by controlling the smoothing and DI length.
Trading Logic:
Long Entry Signal: A long entry signal is generated when the following conditions align:
- Supertrend changes from bearish to bullish
- RSI(21) is below 75 (avoiding overbought)
- RSI(3) is above 65 (short-term strength)
- RSI(28) is above 49 (longer-term strength)
- ADX is above 21 (significant trend)
Exit Signal: A long position is closed when either of these conditions occur:
- Supertrend changes from bullish to bearish
- RSI(10) falls below 42 (potential weakness)
The strategy has the following advantages:
- Supertrend identifies the major trend direction, helping avoid trading noise.
- Multiple RSI periods assess overheated and oversold conditions for higher quality signals.
- ADX ensures entry only when the trend is strong enough, avoiding false signals in choppy markets.
- Combining trend, strength and volatility indicators provides quality entry and exit points.
- Customizable parameters allow optimization for different assets and market environments.
- Easily applied on TradingView without programming for automated trading.
The strategy also carries the following risks:
- Like any technical indicator strategy, false signals may occur and stop losses are essential.
- Over-reliance on indicators ignoring fundamentals or longer-term trends.
- Over-optimization to fit historical data risks curve fitting and requires cautious backtesting.
- Real trading requires execution means like scaling in, dynamic stops for risk control.
- Indicators may fail in the event of sudden developments, requiring human intervention or suspension of trading.
The strategy can also be improved in the following aspects:
- Test different combinations of trend and strength indicators to find optimal parameters.
- Add entry conditions like volume breakouts to ensure strong reversals.
- Optimize holding period for better profit vs drawdown ratio.
- Enable trading selectively using IMPLIED VOL ATM to avoid ineffective low volatility environments.
- Incorporate machine learning models to judge quality of indicator signals and improve win rate.
- Adjust parameters based on asset characteristics to make the strategy more robust.
In summary, the Tesla Supertrend Strategy aims to identify quality entry and exit points by judging strong trend with a combination of indicators. Compared to single indicators, it can filter out false signals and trade when the trend and strength align. However, optimization and risk control must be done prudently without relying solely on historical performance for live trading. With continual testing and tuning, this strategy has the potential to become a valuable tool for trading Tesla or other assets.
[/trans]
Strategy Arguments
| Argument | Default | Description |
|---|---|---|
| v_input_1 | 19 | ATR Length |
| v_input_float_1 | 3 | Factor |
| v_input_2 | 7 | ADX Smoothing |
| v_input_3 | 7 | DI Length |
Source (PineScript)
/*backtest
start: 2023-09-29 00:00:00
end: 2023-10-29 00:00:00
period: 2h
basePeriod: 15m
exchanges: [{"eid":"Futures_Binance","currency":"BTC_USDT"}]
*/

// © cjones0313

//@version=5
strategy("TSLA 1.8k Strategy", overlay=true, default_qty_type=strategy.percent_of_equity, default_qty_value=100)


// a measure of volatility, default 10 - measured over 10 bars
// modifying the value > 10 results in a smoother supertrend line, filter out noise but slower response to price changes
// modifying the value < 10 results in faster response in price changes, but may result in more false signals
atrPeriod = input(19, "ATR Length")

// sets factor for supertrend line made up of price and ATR, this determines how much weight is given to each, default 3.0
// increasing the value > 3.0 results in faster response in price changes, but may result in more false signals
// decreasing the value results in filtering out noise, but may miss smaller price movements
factor = input.float(3.0, "Factor", step = 0.01)

// direction = 1 bullish, -1 bearish
[_, direction] = ta.supertrend(factor, atrPeriod)


adxlen = input(7, title="ADX Smoothing")
dilen = input(7, title="DI Length")
dirmov(len) =>
    up = ta.change(high)
    down = -ta.change(low)
    plusDM = na(up) ? na : (up > down and up > 0 ? up : 0)
    minusDM = na(down) ? na : (down > up and down > 0 ? down : 0)
    truerange = ta.rma(ta.tr, len)
    plus = fixnan(100 * ta.rma(plusDM, len) / truerange)
    minus = fixnan(100 * ta.rma(minusDM, len) / truerange)
    [plus, minus]
adx(dilen, adxlen) =>
    [plus, minus] = dirmov(dilen)
    sum = plus + minus
    adx = 100 * ta.rma(math.abs(plus - minus) / (sum == 0 ? 1 : sum), adxlen)
sig = adx(dilen, adxlen)

if ta.change(direction, 1) < 0 and ta.rsi(close, 21) < 75 and ta.rsi(close, 3) > 65 and ta.rsi(close, 28) > 49 and sig > 21
    strategy.entry("Long Entry", strategy.long)

if ta.change(direction, 1) > 0 or ta.rsi(close, 10) < 42
    strategy.close("Long Entry")
Detail
https://www.fmz.com/strategy/430585
Last Modified
2023-10-30 15:46:31
