Name
玫瑰十字星双重指标波动策略Rose-Cross-Star-Dual-Indicator-Volatility-Strategy
Author
ChaoZhang
Strategy Description
[trans]
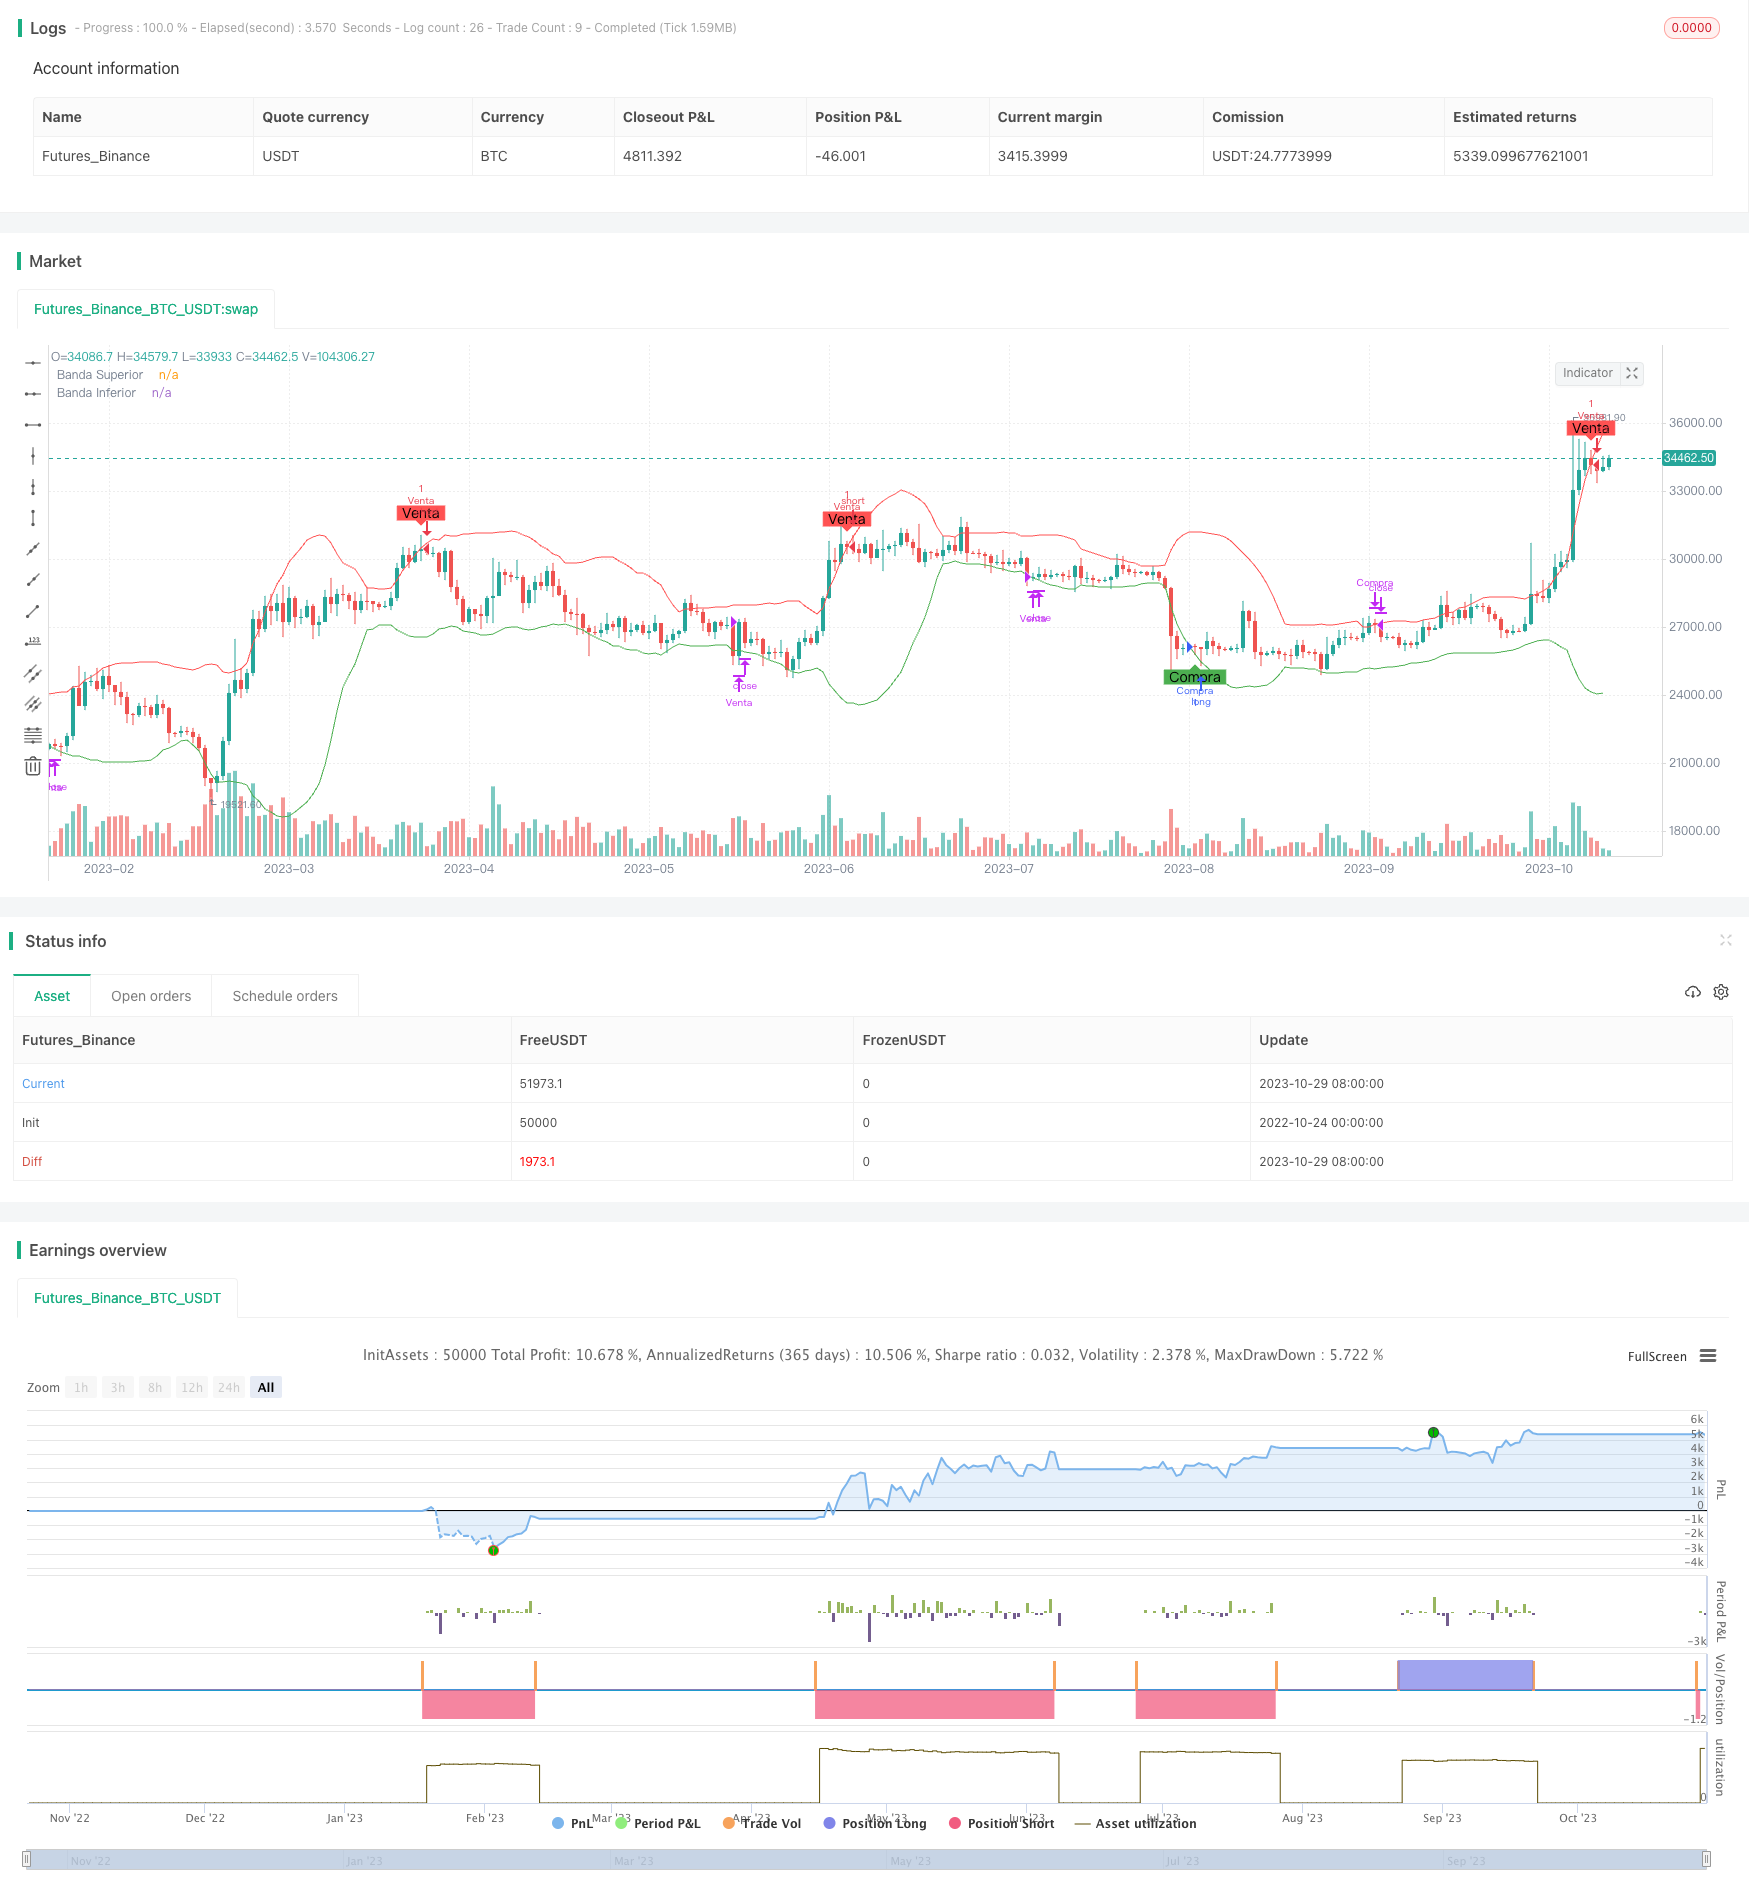
该策略通过运用布林带和修改版相对强弱指标的组合指标,识别价格突破进行交易。测试结果显示,该策略整体盈利良好,胜率较高。它能在趋势行情中捕捉突破信号,适合短线和中线交易。
该策略使用标准差乘数为2的布林带及周期设置为14的RSI指标。布林带能识别价格突破,RSI则用于判断超买超卖状态。指标参数设置基于经验和反复测试结果。
-
当价格突破布林带下轨且RSI低于30(超卖区)时,做多入场。
-
当价格突破布林带上轨且RSI高于70(超买区)时,做空入场。
-
多单止损或价格跌破布林带上轨时平仓。
-
空单止损或价格涨破布林带下轨时平仓。
-
双指标组合,提高策略精确性。
-
指标参数经优化,具有较强适应性。
-
突破操作清晰易行,不容易错过信号。
-
回撤和亏损控制良好。
-
可视化信号提示,操作方便。
-
布林带缩量可能导致假突破。可以适当延长布林带周期。
-
震荡行情中可能出现频繁交易。可以调整RSI参数降低敏感度。
-
需关注交易成本控制。适当放宽止损幅度。
-
可以测试EMA等指标代替SMA生成布林带。
-
可以加入交易量或均量指标过滤假突破。
-
可以基于ATR设定布林带和止损距离。
-
可以加入趋势判断指标,避免震荡行情过度交易。
该策略整合布林带和RSI双重指标优势,在趋势和突破两方面具有出色表现。它操作简单,容易实施,非常适合中短线突破交易。通过指标和参数优化,可以进一步扩展该策略的适用性。
||
This strategy identifies trading opportunities through combining Bollinger Bands and a modified Relative Strength Index (RSI). Backtest results demonstrate its overall profitability and high winning rate. It captures breakout signals in trending markets and suits short-term to medium-term trading.
The strategy utilizes Bollinger Bands with a standard deviation multiplier of 2 and RSI with a period of 14. Bollinger Bands detect breakouts and RSI determines overbought/oversold levels. Indicator parameters are set based on experience and iterative testing.
-
Go long when price breaks above the lower Bollinger Band and RSI is below 30 (oversold zone).
-
Go short when price breaks below the upper Bollinger Band and RSI is above 70 (overbought zone).
-
Close long positions on a stop loss or when price breaks below the upper Bollinger Band.
-
Close short positions on a stop loss or when price breaks above the lower Bollinger Band.
-
Dual indicator combination improves strategy precision.
-
Optimized indicator parameters provide robust adaptability.
-
Breakout signals are clear and easy to implement.
-
Effective drawdown and loss control.
-
Visual signals simplify trade execution.
-
Band squeeze may cause false breakouts. Consider longer Bollinger periods.
-
Frequent trading possible in range-bound markets. Lower RSI sensitivity.
-
Manage transaction costs. Widen stop distances.
-
Test EMA and other indicators to generate bands.
-
Add volume or MA filters to avoid false breaks.
-
Set band and stop distances based on ATR.
-
Add trend filter to reduce whipsaws.
This strategy combines the strengths of Bollinger Bands and RSI for trend and breakout trading. Simple to implement, it is well-suited for short to medium-term breakouts. Extensions through indicator and parameter optimization can further expand its robustness.
[/trans]
Strategy Arguments
| Argument | Default | Description |
|---|---|---|
| v_input_1 | 20 | Longitud |
| v_input_2 | 2 | mult |
Source (PineScript)
/*backtest
start: 2022-10-24 00:00:00
end: 2023-10-30 00:00:00
period: 1d
basePeriod: 1h
exchanges: [{"eid":"Futures_Binance","currency":"BTC_USDT"}]
*/

//@version=4
strategy("Estrategia de Ruptura con Bollinger y RSI Modificada", shorttitle="BB RSI Mod", overlay=true)

// Parámetros de Bollinger Bands
src = close
length = input(20, title="Longitud", minval=1)
mult = input(2.0)
basis = sma(src, length)
upper = basis + mult * stdev(src, length)
lower = basis - mult * stdev(src, length)

// Parámetros del RSI
rsiSource = rsi(close, 14)
overbought = 70
oversold = 30

longCondition = crossover(src, lower) and rsiSource < oversold
shortCondition = crossunder(src, upper) and rsiSource > overbought

longExit = crossunder(src, upper)
shortExit = crossover(src, lower)

if (longCondition)
    strategy.entry("Compra", strategy.long, stop=low)

if (shortCondition)
    strategy.entry("Venta", strategy.short, stop=high)

if (longExit)
    strategy.close("Compra")

if (shortExit)
    strategy.close("Venta")

// Visualización
plotshape(series=longCondition, title="Compra", location=location.belowbar, color=color.green, style=shape.labelup, text="Compra")
plotshape(series=shortCondition, title="Venta", location=location.abovebar, color=color.red, style=shape.labeldown, text="Venta")
plot(upper, "Banda Superior", color=color.red)
plot(lower, "Banda Inferior", color=color.green)
Detail
https://www.fmz.com/strategy/430692
Last Modified
2023-10-31 17:33:10
