Name
移动均线金叉策略Moving-Average-Crossover-Strategy
Author
ChaoZhang
Strategy Description
[trans]
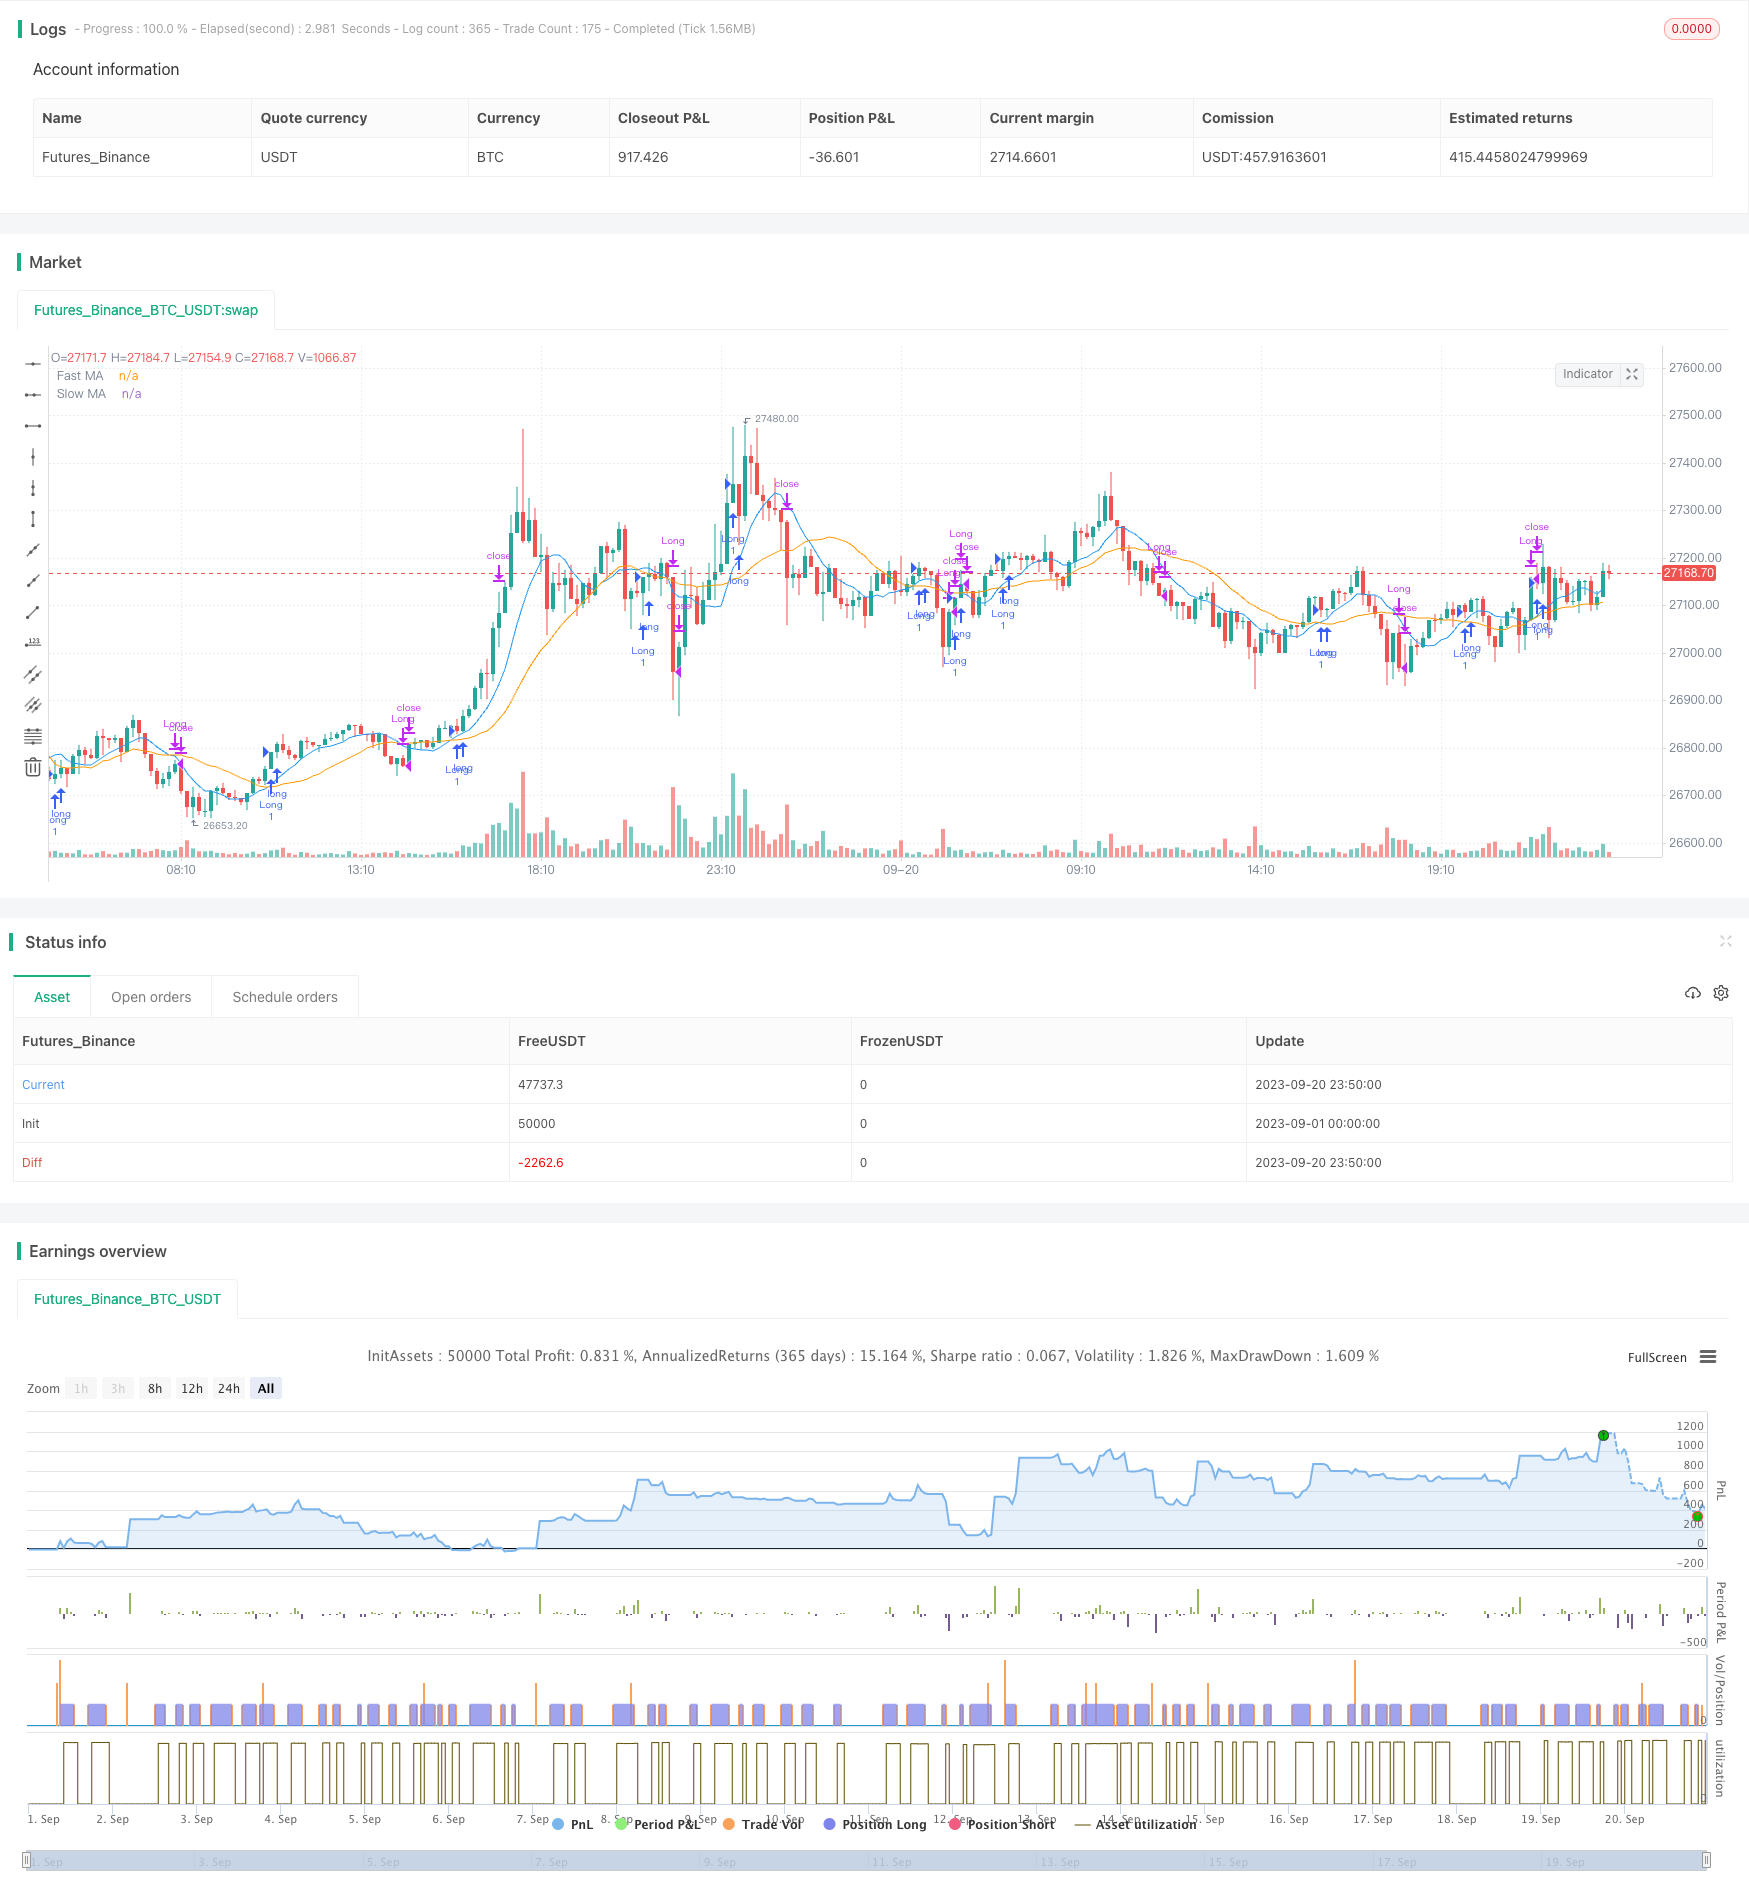
该策略是一种基于移动均线的趋势跟踪策略。它利用快速移动均线和慢速移动均线的金叉和死叉来判断趋势方向,实现低风险的趋势跟踪交易。
该策略使用了长度为9的快速移动均线和长度为21的慢速移动均线。当快速移动均线上穿慢速移动均线时,表示市场进入上升趋势,这时做多;当快速移动均线下穿慢速移动均线时,表示市场进入下降趋势,这时平仓做多头仓位。
具体来说,策略通过计算快速移动均线和慢速移动均线的值,并比较两者的大小关系来判断趋势方向。在多头方向时,如果快速移动均线上穿慢速移动均线,就会触发做多信号,进入长仓。在空头方向时,如果快速移动均线下穿慢速移动均线,就会触发平仓信号,平掉之前的多头仓位。
这样,通过快慢均线的金叉死叉来捕捉市场趋势的转换,实现低风险的趋势跟踪交易。
- 使用移动均线判断趋势,可以过滤市场噪音,识别趋势方向
- 快速移动均线能更快捕捉趋势转换,慢速移动均线过滤假信号
- 采用金叉买入、死叉卖出的交易信号,避免追高杀跌
- 策略交易逻辑简单清晰,容易理解实现
- 移动均线存在滞后,可能错过趋势转换的最佳时间点
- 固定平均线长度无法适应市场各种周期
- 双均线策略容易产生频繁交易信号,存在过拟合风险
- 仅使用均线判断易受突发事件影响,存在亏损风险
可以通过调整均线参数、引入其他指标作为过滤、设置止损止盈来管理风险。
- 尝试不同的参数设置,如均线长度组合、金叉死叉判断标准等
- 增加量能指标等过滤器,避免假突破
- 增加趋势指标判断,区分趋势和震荡市场
- 结合波动率指标优化止损止盈设定
- 引入机器学习算法动态优化参数
该策略作为一种简单的趋势跟踪策略,核心思想是通过快速和慢速均线组合判定趋势方向。优点是简单易懂,交易规则清晰,能够有效跟踪趋势;缺点是存在滞后且容易产生假信号。我们可以通过调整参数以及加入其他技术指标来优化该策略,使其更好地适应市场环境。总的来说,双均线策略作为一种基础策略,为量化交易提供了一个简单可靠的思路。通 过不断优化和改进,可以使这一策略的实际交易效果更佳。
||
This strategy is a trend-following strategy based on moving averages. It uses the crossover and crossunder of fast and slow moving averages to determine the trend direction for low-risk trend trading.
The strategy employs a fast moving average of period 9 and a slow moving average of period 21. When the fast MA crosses above the slow MA, it signals an uptrend in the market and a long position is taken. When the fast MA crosses below the slow MA, it signals a downtrend and any long position is closed.
Specifically, the strategy calculates the values of the fast and slow MAs and compares their relationship to determine the trend direction. In an uptrend, if the fast MA crosses above the slow MA, a long entry signal is triggered. In a downtrend, if the fast MA crosses below the slow MA, an exit signal is triggered to close the existing long position.
This way, the crossover and crossunder of the fast and slow MAs captures trend transitions for low-risk trend following trading.
- Using moving averages to determine trend filters out market noise and identifies trend direction
- The fast MA captures trend changes faster, while the slow MA filters out false signals
- Using crossover to buy and crossunder to sell avoids chasing tops and selling bottoms
- Simple and clear trading logic, easy to understand and implement
- Moving averages have lag and may miss best entry/exit points for trend transitions
- Fixed MA lengths cannot adapt to different market cycles
- Dual MA strategies tend to generate excessive trading signals and overfitting
- Using just MAs to determine trades is prone to sudden events and losses
Risks can be managed by tuning parameters, adding filters, stop loss/take profit.
- Test different parameter settings like MA lengths, crossover/crossunder thresholds etc.
- Add momentum indicators as filters to avoid false breakouts
- Add trend-determining indicators to distinguish trending and ranging markets
- Incorporate volatility metrics to optimize stops and take profits
- Employ machine learning to dynamically optimize parameters
As a simple trend following strategy, the core idea is to use fast and slow MAs to determine trend direction. The pros are simplicity, clear rules, and effective trend tracking. The cons are lag, false signals, and excessive trades. We can optimize it by adjusting parameters and adding other indicators to better adapt to market conditions. Overall, the dual MA strategy provides a simple and reliable approach to quantitative trading. With continuous improvements, its performance can become even better.
[/trans]
Strategy Arguments
| Argument | Default | Description |
|---|---|---|
| v_input_int_1 | 9 | Fast MA Length |
| v_input_int_2 | 21 | Slow MA Length |
| v_input_float_1 | true | Stop Loss % |
| v_input_float_2 | true | Take Profit % |
Source (PineScript)
/*backtest
start: 2023-09-01 00:00:00
end: 2023-09-20 23:59:59
period: 10m
basePeriod: 1m
exchanges: [{"eid":"Futures_Binance","currency":"BTC_USDT"}]
*/

//@version=5
strategy("Profitable Crypto Strategy", shorttitle="Profit Strategy", overlay=true)

// Define strategy parameters
fastLength = input.int(9, title="Fast MA Length", minval=1)
slowLength = input.int(21, title="Slow MA Length", minval=1)
stopLossPercent = input.float(1.0, title="Stop Loss %", step=0.1)
takeProfitPercent = input.float(1.0, title="Take Profit %", step=0.1)

// Calculate moving averages
fastMA = ta.sma(close, fastLength)
slowMA = ta.sma(close, slowLength)

// Entry condition: Buy when fast MA crosses above slow MA
longCondition = ta.crossover(fastMA, slowMA)
// Exit condition: Sell when fast MA crosses below slow MA
shortCondition = ta.crossunder(fastMA, slowMA)

// Plot moving averages on the chart
plot(fastMA, color=color.blue, title="Fast MA")
plot(slowMA, color=color.orange, title="Slow MA")

// Strategy entry and exit logic
var stopLossPrice = 0.0
var takeProfitPrice = 0.0

if (longCondition)
    stopLossPrice := close * (1.0 - stopLossPercent / 100)
    takeProfitPrice := close * (1.0 + takeProfitPercent / 100)
    strategy.entry("Long", strategy.long)

if (shortCondition)
    strategy.close("Long")

// Set stop loss and take profit for open positions
strategy.exit("Stop Loss/Profit", stop=stopLossPrice, limit=takeProfitPrice)
Detail
https://www.fmz.com/strategy/429499
Last Modified
2023-10-17 16:46:57
