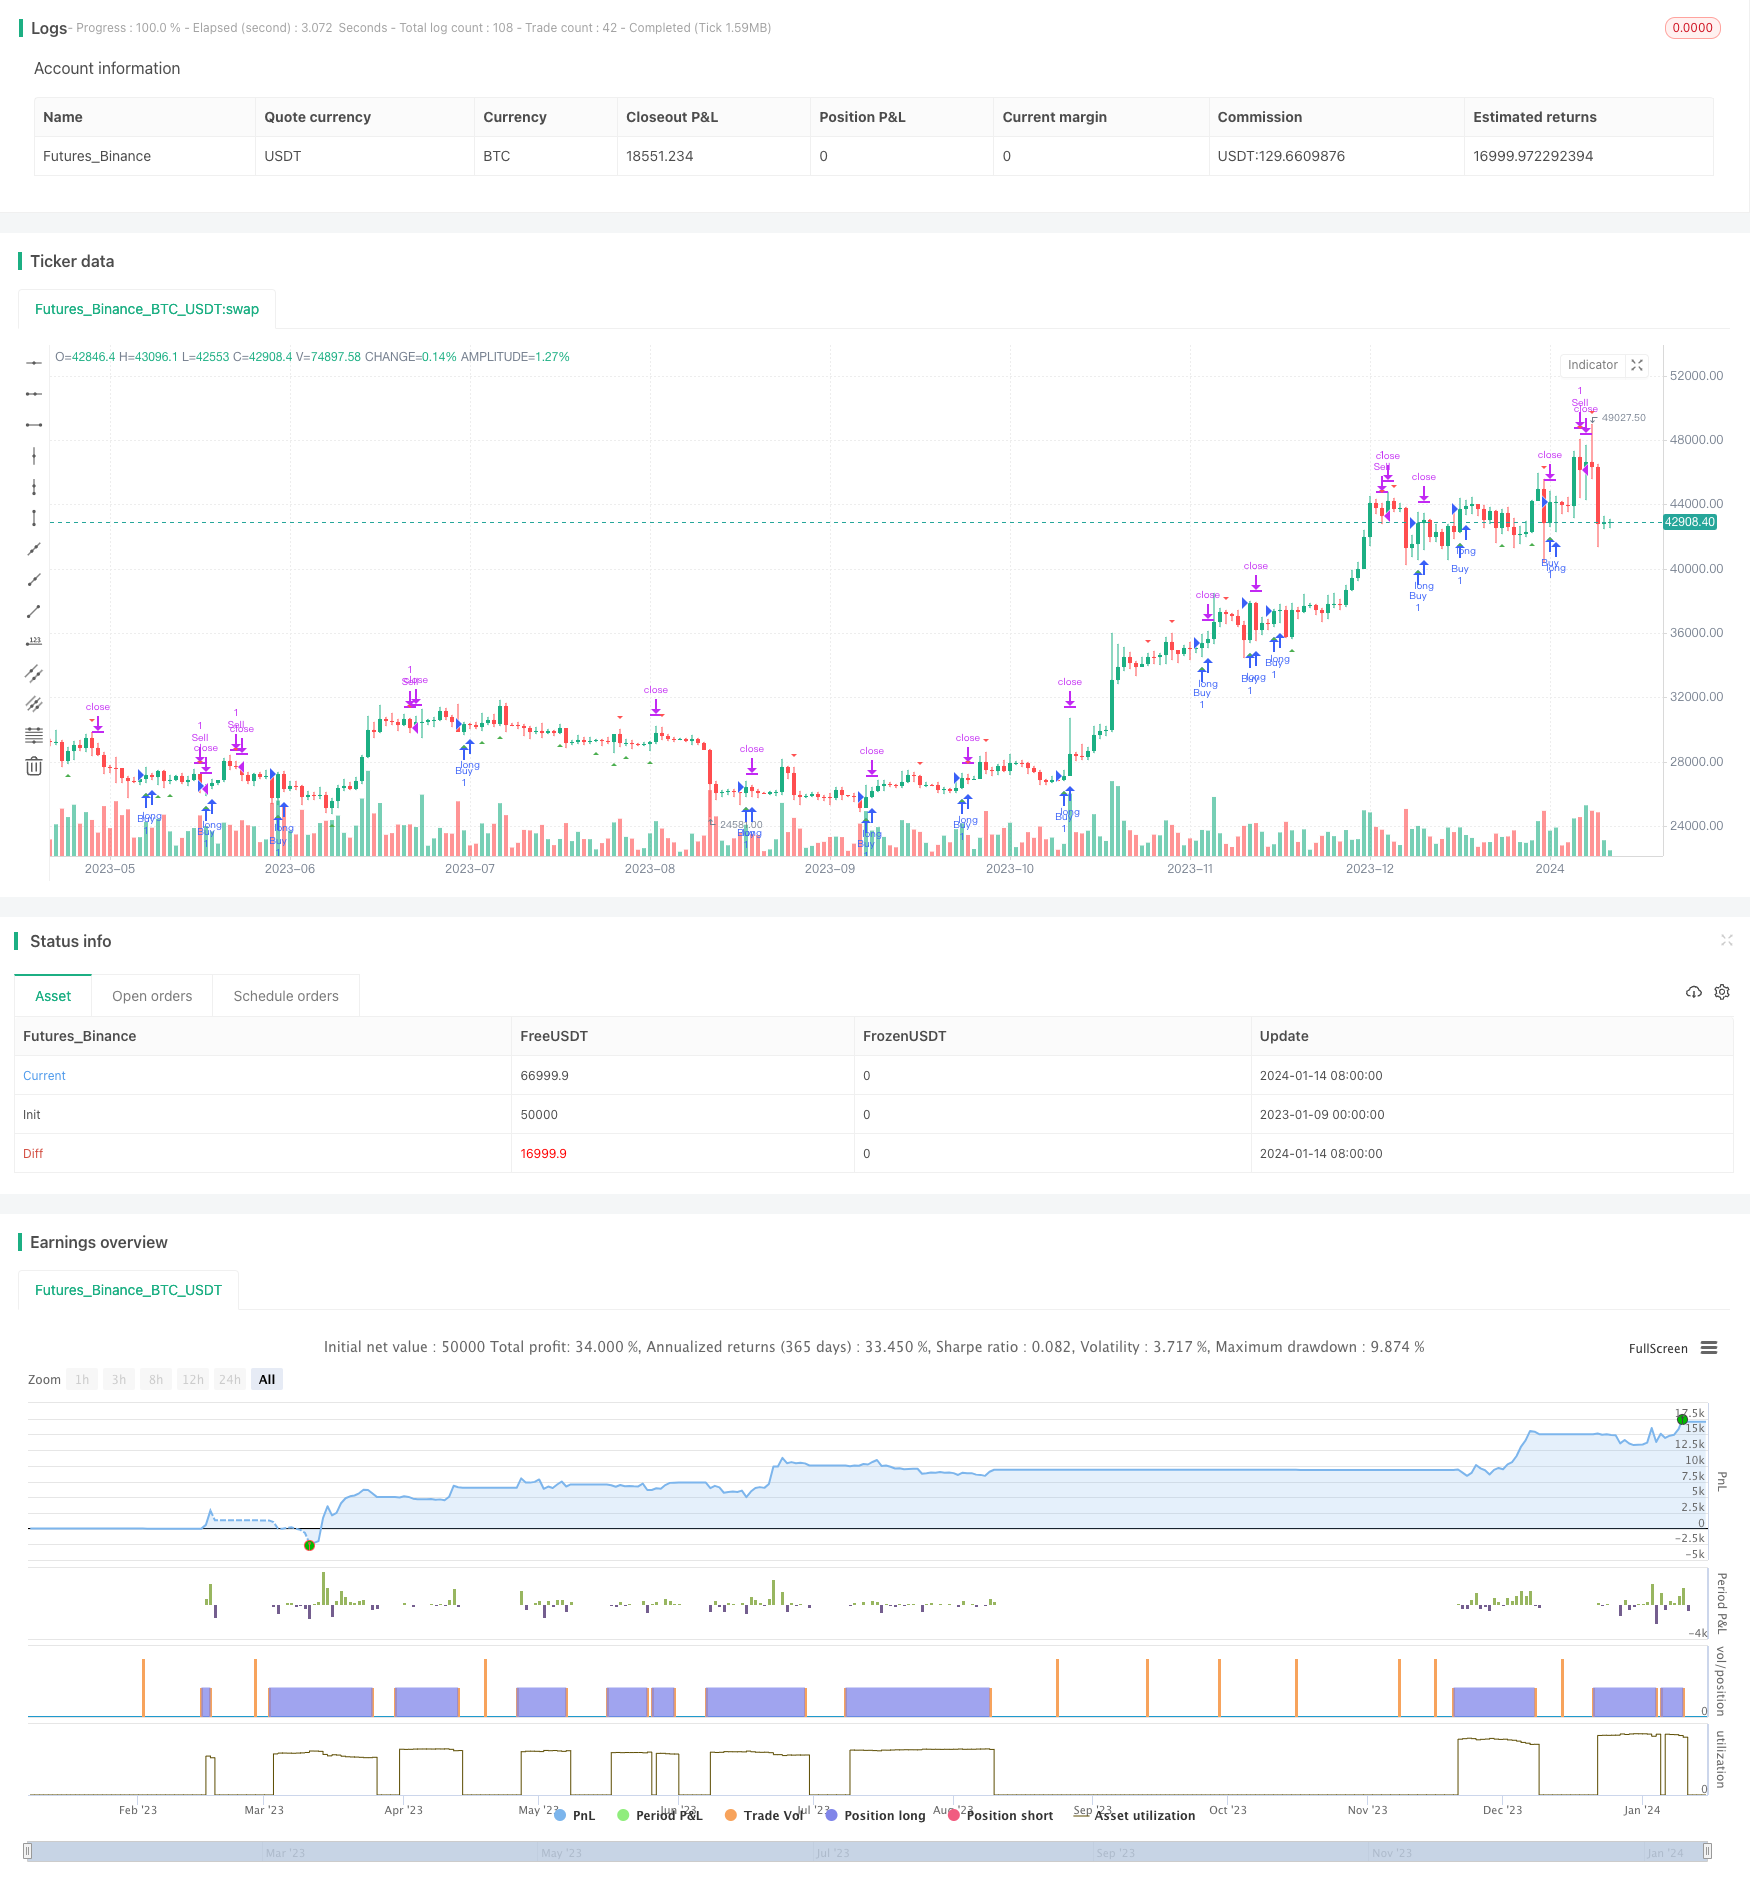
Name
移动平均线与随机RSI组合交易策略Moving-Average-and-Stochastic-RSI-Combination-Trading-Strategy
Author
ChaoZhang
Strategy Description
该策略通过组合使用移动平均线和随机相对强弱指数(Stochastic RSI)来寻找交易机会。具体来说,它会同时看涨趋势的中短期移动平均线,和超买超卖的随机RSI指标,在二者发出买入和卖出信号时进行操作。这种组合使用可以过滤掉一些假信号,提高策略的稳定性。
该策略主要由以下几部分组成:
-
计算两条不同周期的移动平均线MA1和MA2。
-
计算随机相对强弱指数Stochastic RSI。该指标结合RSI和随机指标的原理,可以显示RSI指标是否处于超买或超卖状态。
-
在随机RSI指标从超卖区上穿定阈值时产生买入信号;而从超买区下穿时产生卖出信号。
-
当随机RSI指标发出信号,并且短周期移动平均线处于长周期移动平均之上时,进行买入。这可以过滤掉大部分假信号。
-
计算风险金额和仓位。固定的风险金额可以有效控制单笔损失。
-
设置止损和止盈价格。跟踪止盈,让利润最大化。
这种组合使用移动平均线和随机RSI指标的策略,有以下几个优势:
-
可以在趋势行情中获得较好回报。中长线均线组合可以判断主要趋势方向。
-
随机RSI指标可以有效判断超买超卖现象,这对于捕捉反转机会很有用。
-
组合使用过滤虚假信号的可能性,可以提高稳定性。
-
采用风险金额法进行资金管理,可以限制单笔亏损,避免超出可承受范围。
-
设置止损止盈以锁定利润,避免风险。
该策略也存在一些风险,主要集中在以下几个方面:
-
在震荡趋势中,中长线均线可能发出错误信号。需要设置止损来控制风险。
-
随机RSI指标容易受剧烈价格变动影响,可能也会发出错误信号。与均线组合使用可以缓解。
-
风险金额法无法完全规避大额亏损的可能。需要合理设置仓位。
-
在行情剧烈变动时,无法获取合理价格设置止盈止损。这时要及时人工干预。
该策略可以从以下几个方向进行进一步优化:
-
测试更多参数组合,寻找最佳的参数周期。现在使用的周期并不一定是最优。
-
尝试其他指标与移动平均线进行组合。例如KDJ,MACD等。选取最匹配的指标。
-
对交易品种进行测试优化。现在是针对外汇进行测试,可以尝试在其他市场应用。
-
采用机器学习等方法动态优化参数。现在参数是静态设置的,这可能无法适应市场变化。
移动平均线与随机RSI组合策略,通过均线判断大趋势,随机RSI判断反转点,二者结合形成交易信号,并设置止盈止损与风险控制,从而获得了稳定的策略逻辑。这种组合策略结构简单实用,值得进一步测试和优化,可以延展至更多品种和参数设置上。
||
This strategy combines the use of moving averages and Stochastic Relative Strength Index (Stochastic RSI) to find trading opportunities. Specifically, it looks at the medium-term moving average in an upward trend and the overbought/oversold Stochastic RSI indicator to make trading decisions when both signals emerge. This combined use can filter out some false signals and improve the stability of the strategy.
The main components of this strategy are:
-
Calculate two moving averages, MA1 and MA2, with different periods.
-
Calculate the Stochastic Relative Strength Index (Stochastic RSI). This indicator incorporates RSI and stochastic principles to show whether the RSI is overbought or oversold.
-
A buy signal is generated when stochastic RSI crosses above oversold threshold, while a sell signal is generated when it crosses below overbought threshold.
-
Enter long when stochastic RSI signals aligned with the faster moving average above the slower one. This filters most false signals.
-
Calculate the risk amount and position size. A fixed risk amount helps effectively control single loss.
-
Set stop loss and take profit price. Trail stop profit to maximize profit.
The strategy of combining moving average and stochastic RSI has the following advantages:
-
It can yield good returns in trending markets. The combination of medium and long-term moving averages can determine the overall market trend direction.
-
Stochastic RSI is useful in identifying overbought and oversold situations to catch reversal opportunities.
-
Combination use filters out false signals and improves stability.
-
The fixed risk percentage method manages risk by capping single loss below tolerance level.
-
Stop loss and take profit lock in profits and limit downside risk.
There are also some risks to this strategy:
-
In ranging markets, the combined moving averages may give false signals. Stop loss should be used to control risk.
-
Stochastic RSI is sensitive to volatile price action and may also provide false signals occasionally. Combining with moving averages alleviates this.
-
Fixed risk allocation cannot completely avoid large losses. Position sizing should be set appropriately.
-
In extreme volatile scenarios, reasonable stop loss/profit prices are unavailable. Manual intervention is required then.
The strategy can be further optimized in the following aspects:
-
Test more parameter combinations to find optimal periods. The current ones may not be the best.
-
Try combining moving averages with other indicators like KDJ, MACD etc. Identify the best match.
-
Test and optimize across different trading instruments. Currently optimized for FX trading.
-
Employ machine learning models to dynamically optimize parameters over time against changing markets.
The moving average and stochastic RSI combination strategy identifies trend with moving averages and reversal levels with stochastic RSI to form trade signals, along with stop loss/profit and risk control to form a robust strategy logic. This simple and practical combination framework can be further tested and optimized across more instruments and parameter sets.
[/trans]
Strategy Arguments
| Argument | Default | Description |
|---|---|---|
| v_input_int_1 | 20 | MA1 Length |
| v_input_int_2 | 50 | MA2 Length |
| v_input_int_3 | 14 | Stochastic RSI Length |
| v_input_int_4 | 80 | Overbought Level |
| v_input_int_5 | 20 | Oversold Level |
| v_input_float_1 | 2 | Risk Percentage |
Source (PineScript)
/*backtest
start: 2023-01-09 00:00:00
end: 2024-01-15 00:00:00
period: 1d
basePeriod: 1h
exchanges: [{"eid":"Futures_Binance","currency":"BTC_USDT"}]
*/

//@version=5
strategy("Moving Average and Stochastic RSI Strategy", shorttitle="MA+Stoch RSI", overlay=true)

// Input variables
ma1_length = input.int(20, title="MA1 Length")
ma2_length = input.int(50, title="MA2 Length")
stoch_length = input.int(14, title="Stochastic RSI Length")
overbought = input.int(80, title="Overbought Level")
oversold = input.int(20, title="Oversold Level")
risk_percentage = input.float(2.0, title="Risk Percentage")

// Calculate moving averages
ma1 = ta.sma(close, ma1_length)
ma2 = ta.sma(close, ma2_length)

// Calculate Stochastic RSI
rsi1 = ta.rsi(close, stoch_length)
rsiH = ta.highest(rsi1, stoch_length)
rsiL = ta.lowest(rsi1, stoch_length)
stoch = (rsi1 - rsiL) / (rsiH - rsiL) * 100

// Determine buy and sell signals based on Stochastic RSI
buySignal = ta.crossover(stoch, oversold)
sellSignal = ta.crossunder(stoch, overbought)

// Plot signals on the chart
plotshape(buySignal, style=shape.triangleup, location=location.belowbar, color=color.green, size=size.small)
plotshape(sellSignal, style=shape.triangledown, location=location.abovebar, color=color.red, size=size.small)

// Calculate position size based on equity and risk percentage
equity = strategy.equity
riskAmount = equity * risk_percentage / 100
positionSize = riskAmount / ta.atr(14)

// Entry and exit conditions
var float stopLoss = na
var float takeProfit = na

if buySignal
    stopLoss := low
    takeProfit := high
    strategy.entry("Buy", strategy.long)
else if sellSignal
    strategy.exit("Sell", from_entry="Buy", stop=stopLoss, limit=takeProfit)
Detail
https://www.fmz.com/strategy/438950
Last Modified
2024-01-16 15:46:11
