Name
移动平均线交叉与平仓交易策略Exponential-Moving-Average-and-Moving-Average-Crossover-with-Close-Strategy
Author
ChaoZhang
Strategy Description
移动平均线交叉与平仓交易策略是一种基于9日指数移动平均线(EMA)和20日简单移动平均线(MA)的价格运动来进行交易操作的策略。该策略利用EMA和MA的交叉信号来判断趋势方向,以发出买入和卖出信号。一旦价格重新跨过移动平均线,该策略会平仓现有头寸。
- EMA9 计算9日的指数移动平均线。EMA赋予最近期价格更大权重,使其更灵敏地响应新的信息。
- MA20 计算20日的简单移动平均线。MA是过去20日收盘价的平均值。
- 买入条件:当收盘价高于9日EMA和20日MA时成立。该信号被视为多头信号。
- 卖出条件:当收盘价低于9日EMA和20日MA时成立。该信号被视为空头信号。
- 当买入条件成立时,执行买入开仓操作。
- 当卖出条件成立时,执行卖出开仓操作。
- 当价格重新跨过9日EMA或20日MA时,不论当前持仓方向,执行平仓操作。
- 买入K线标为绿色
- 卖出K线标为红色
- 其他K线默认白色
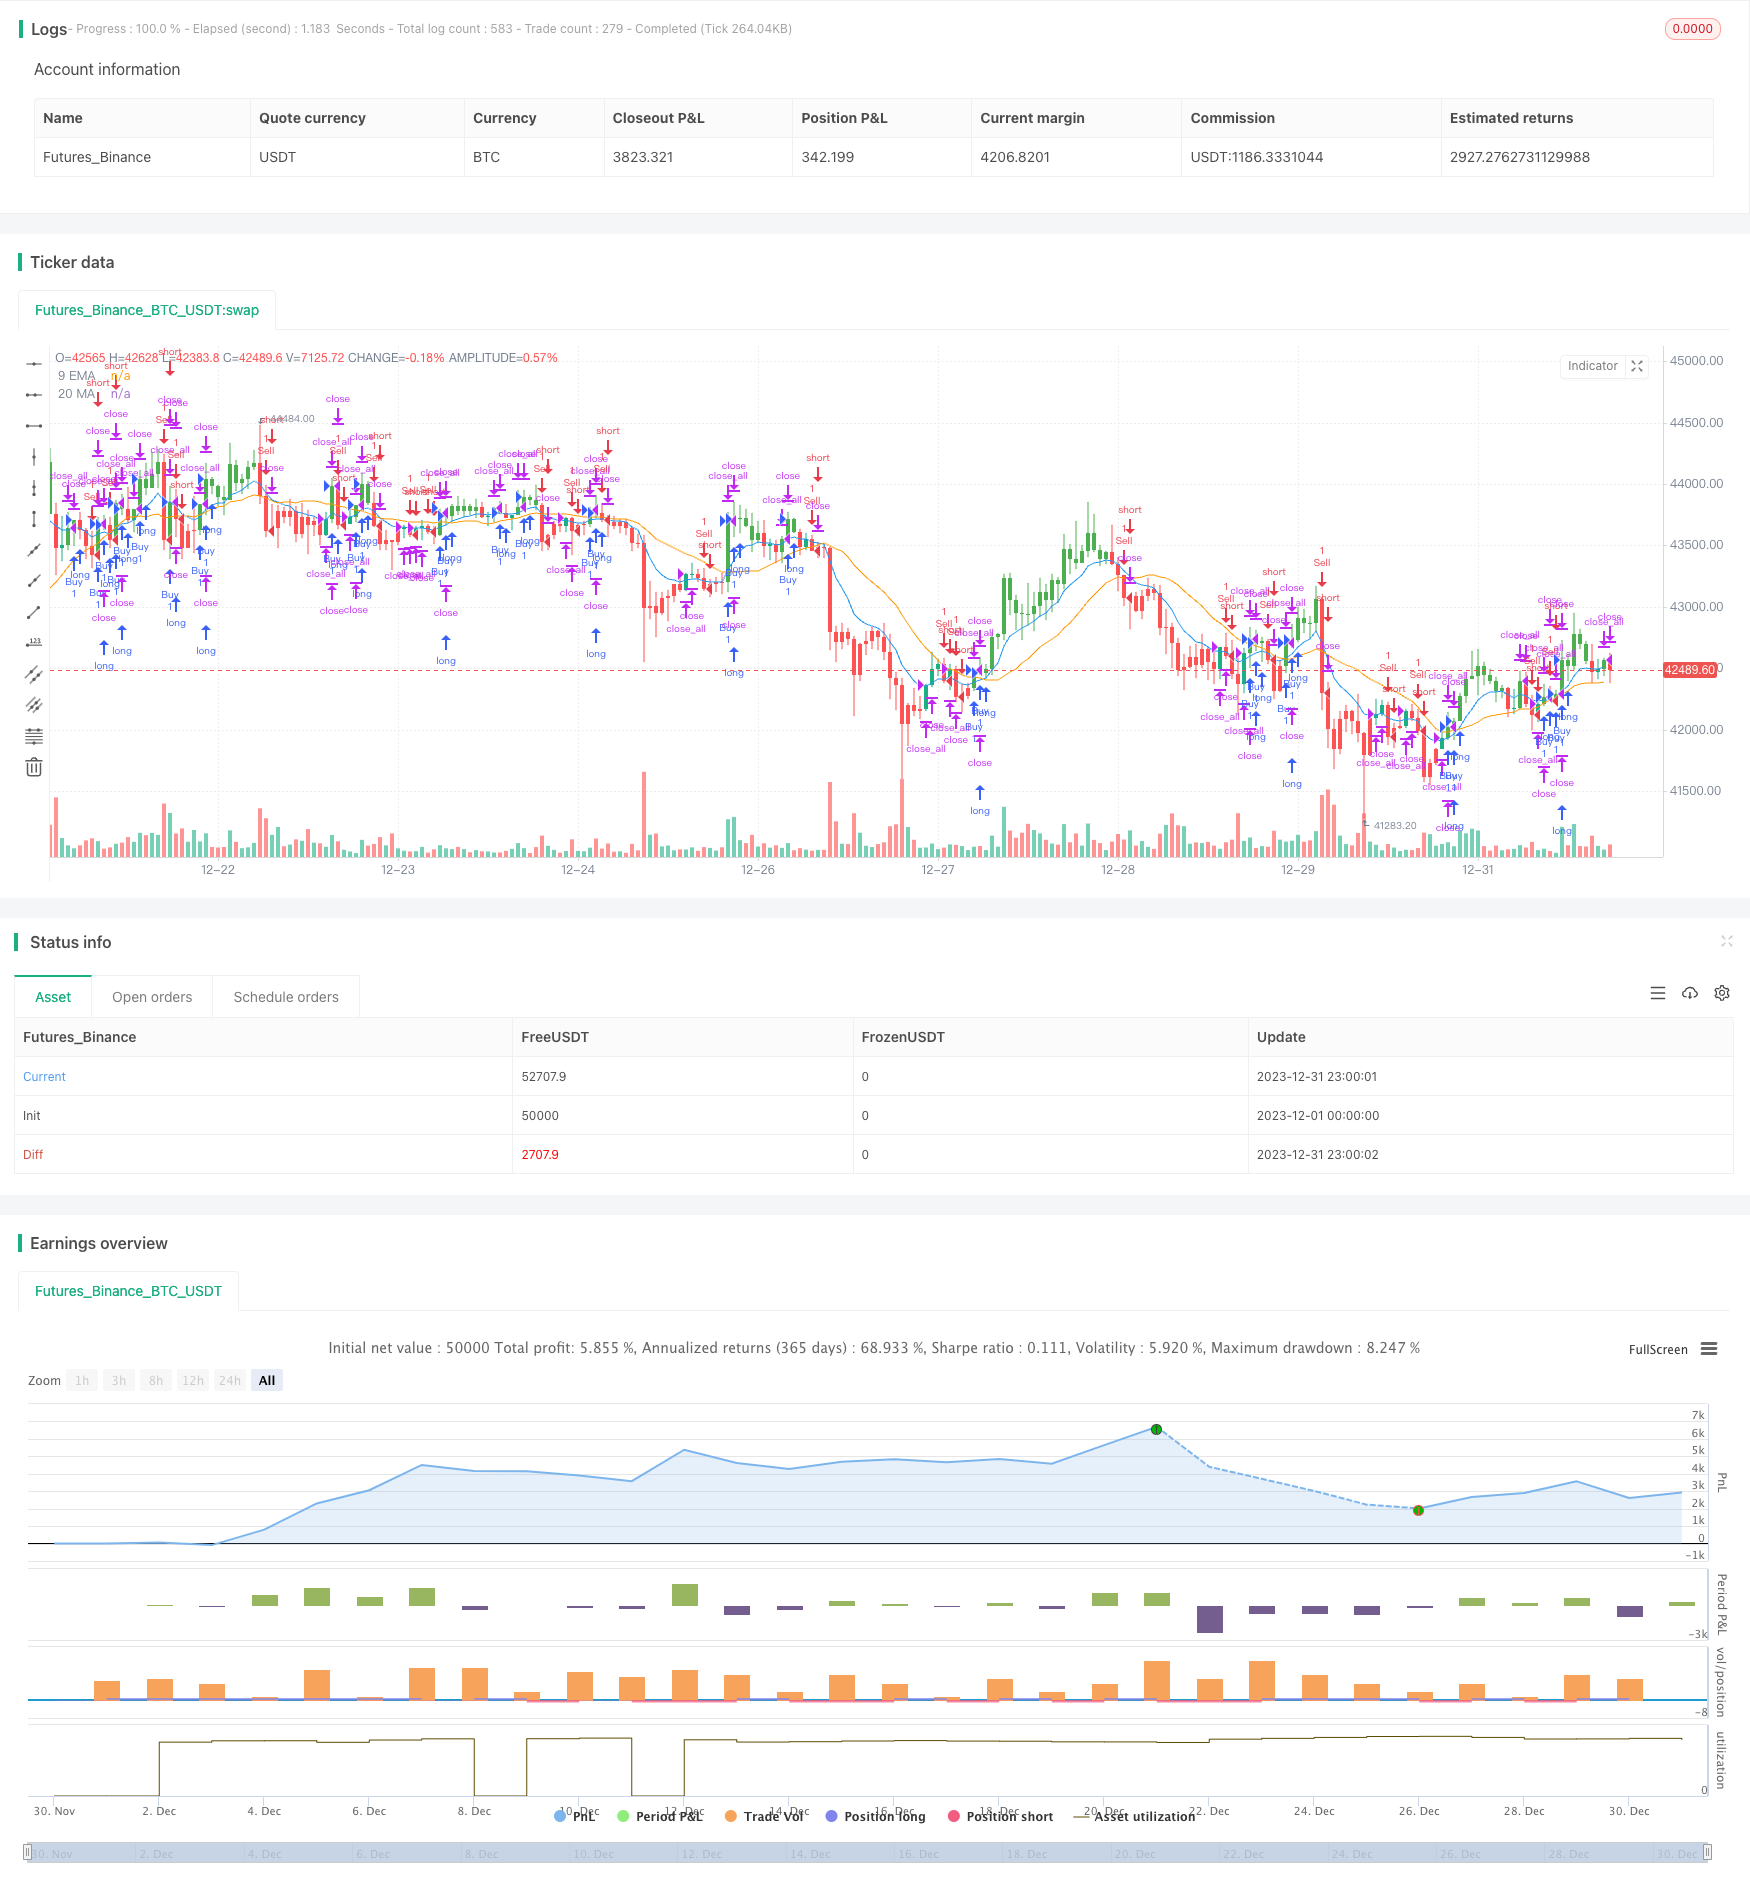
在图表上绘制9日EMA和20日MA曲线,以便观察价格与移动平均线的相对位置。
该策略融合了EMA和MA两个广泛使用的技术指标,充分利用了它们平滑价格、判断趋势方向的优点。相比单一使用EMA或MA,该组合能提供更可靠的交易信号。
EMA和MA线的交叉信号简单明了,可以清楚判断市场 Bachelder 的变化,避免错误交易。
策略直接在K线上进行视觉化配色,无需复杂计算即可直观判断当前趋势和信号。
自动执行开仓和平仓操作,严格遵循事先制定的交易规则,有助于风险控制。
移动平均线属于趋势跟随指标,在盘整时期会产生大量虚假信号。应避免在震荡趋势中使用该策略。
在价格剧烈波动时,移动平均线可能产生滞后,导致错过最佳入场或出场时机。
EMA和MA的参数设置会对交易结果产生很大影响。应调整参数以适应不同品种和交易周期。
自动交易策略无法像人工交易员般应对各种复杂情况,难以在危急时刻关闭误导头寸。应预先设置止损和止盈。
可测试不同长度的EMA和MA参数组合,选择产生信号最优且最大限度减少虚假信号的参数。
可结合波动率指标如ATR来过滤部分高风险信号,以控制潜在亏损。
将策略与其他指标或信号结合使用,如量价指标、布林带,来验证信号的可靠性。
添加止损和止盈逻辑以主动控制头寸风险。止损可基于ATR倍数或价格级别来设定。
移动平均线交叉与平仓交易策略通过EMA和MA的交叉为基础判断市场趋势方向,以发出交易信号。该策略简单实用,容易实现自动化交易。但如其他技术指标策略一样,其 parameter 设置和市场情况对结果影响很大,在实战中需要不断调整优化以适应市场变化。
||
The Exponential Moving Average (EMA) and Moving Average (MA) Crossover with Close Strategy generates trading signals based on the price movement of an asset relative to its 9-period EMA and 20-period MA. It uses EMA and MA crossover signals to determine trend direction for entries and closes positions when the price recrosses the moving averages.
- ema9 calculates the 9-period Exponential Moving Average of closing prices. EMA gives more weight to recent prices, making it more responsive.
- ma20 calculates the 20-period Simple Moving Average of closing prices. MA is an average of closing prices over 20 periods.
- buyCondition is true when close > both ema9 and ma20. This is interpreted as a bullish signal.
- sellCondition is true when close < both ema9 and ma20. This is interpreted as a bearish signal.
- When buyCondition is true, execute a long entry order.
- When sellCondition is true, execute a short entry order.
- When price recrosses ema9 or ma20, close any open position.
- Green candles indicate buy condition
- Red candles indicate sell condition
- Other candles are default white
The 9 EMA and 20 MA are plotted on the chart for visual reference.
The strategy combines two widely used indicators, taking advantage of EMA and MA’s trend following and smoothing capabilities to generate more reliable signals.
Crossovers provide clear trend change signals, avoiding bad trades.
Candle color coding visually indicates conditions without complex calculations.
Automated entry and exit execution strictly follows predetermined rules, aiding risk management.
As trend following indicators, moving averages can produce many false signals during range-bound periods. Avoid using this strategy during choppy, non-trending markets.
Fast price moves can create lag in MA and EMA values, causing missed opportunities.
EMA and MA parameters significantly impact strategy performance and should be adjusted for different products and timeframes.
Automated strategies cannot adapt to complex situations like a human trader. Preset stop losses and take profits.
Test different EMA and MA length combinations to find optimal parameters that maximize true signals and minimize false signals.
Incorporate volatility metrics like ATR to filter higher risk setups and control potential losses.
Combine with other indicators or signals like volume and Bollinger Bands to confirm signal reliability.
Add stop loss and take profit logic to actively manage trade risk. Stops can be price-based or ATR-based.
The EMA and MA Crossover with Close Strategy uses EMA and MA crossovers to determine trends and signal entries. While simple and automatable, performance is heavily dependent on parameter tuning and market conditions. Regular optimization is needed to adapt to evolving markets.
[/trans]
Source (PineScript)
/*backtest
start: 2023-12-01 00:00:00
end: 2023-12-31 23:59:59
period: 1h
basePeriod: 15m
exchanges: [{"eid":"Futures_Binance","currency":"BTC_USDT"}]
*/

//@version=4
strategy("EMA and MA Crossover with Close Strategy", shorttitle="EMA_MA_Close", overlay=true)

// Define the length of the Exponential Moving Average and Moving Average
lengthEMA = 9
lengthMA = 20

// Calculate the 9 EMA and 20 MA
ema9 = ema(close, lengthEMA)
ma20 = sma(close, lengthMA)

// Define the buy and sell conditions
buyCondition = close > ema9 and close > ma20
sellCondition = close < ema9 and close < ma20

// Define the close position condition
closeCondition = crossover(close, ema9) or crossover(close, ma20)

// Execute buy or sell orders
if (buyCondition)
    strategy.entry("Buy", strategy.long)
else if (sellCondition)
    strategy.entry("Sell", strategy.short)

// Close any position if the close condition is met
if (closeCondition)
    strategy.close_all()

// Coloring the candles based on conditions
barcolor(buyCondition ? color.green : na)
barcolor(sellCondition ? color.red : na)

// Plotting the EMA and MA for reference
plot(ema9, color=color.blue, title="9 EMA")
plot(ma20, color=color.orange, title="20 MA")
Detail
https://www.fmz.com/strategy/439353
Last Modified
2024-01-19 14:50:50
