Name
移动平均线交叉金叉优化交易策略Golden-Cross-Optimized-Moving-Average-Crossover-Trading-Strategy
Author
ChaoZhang
Strategy Description
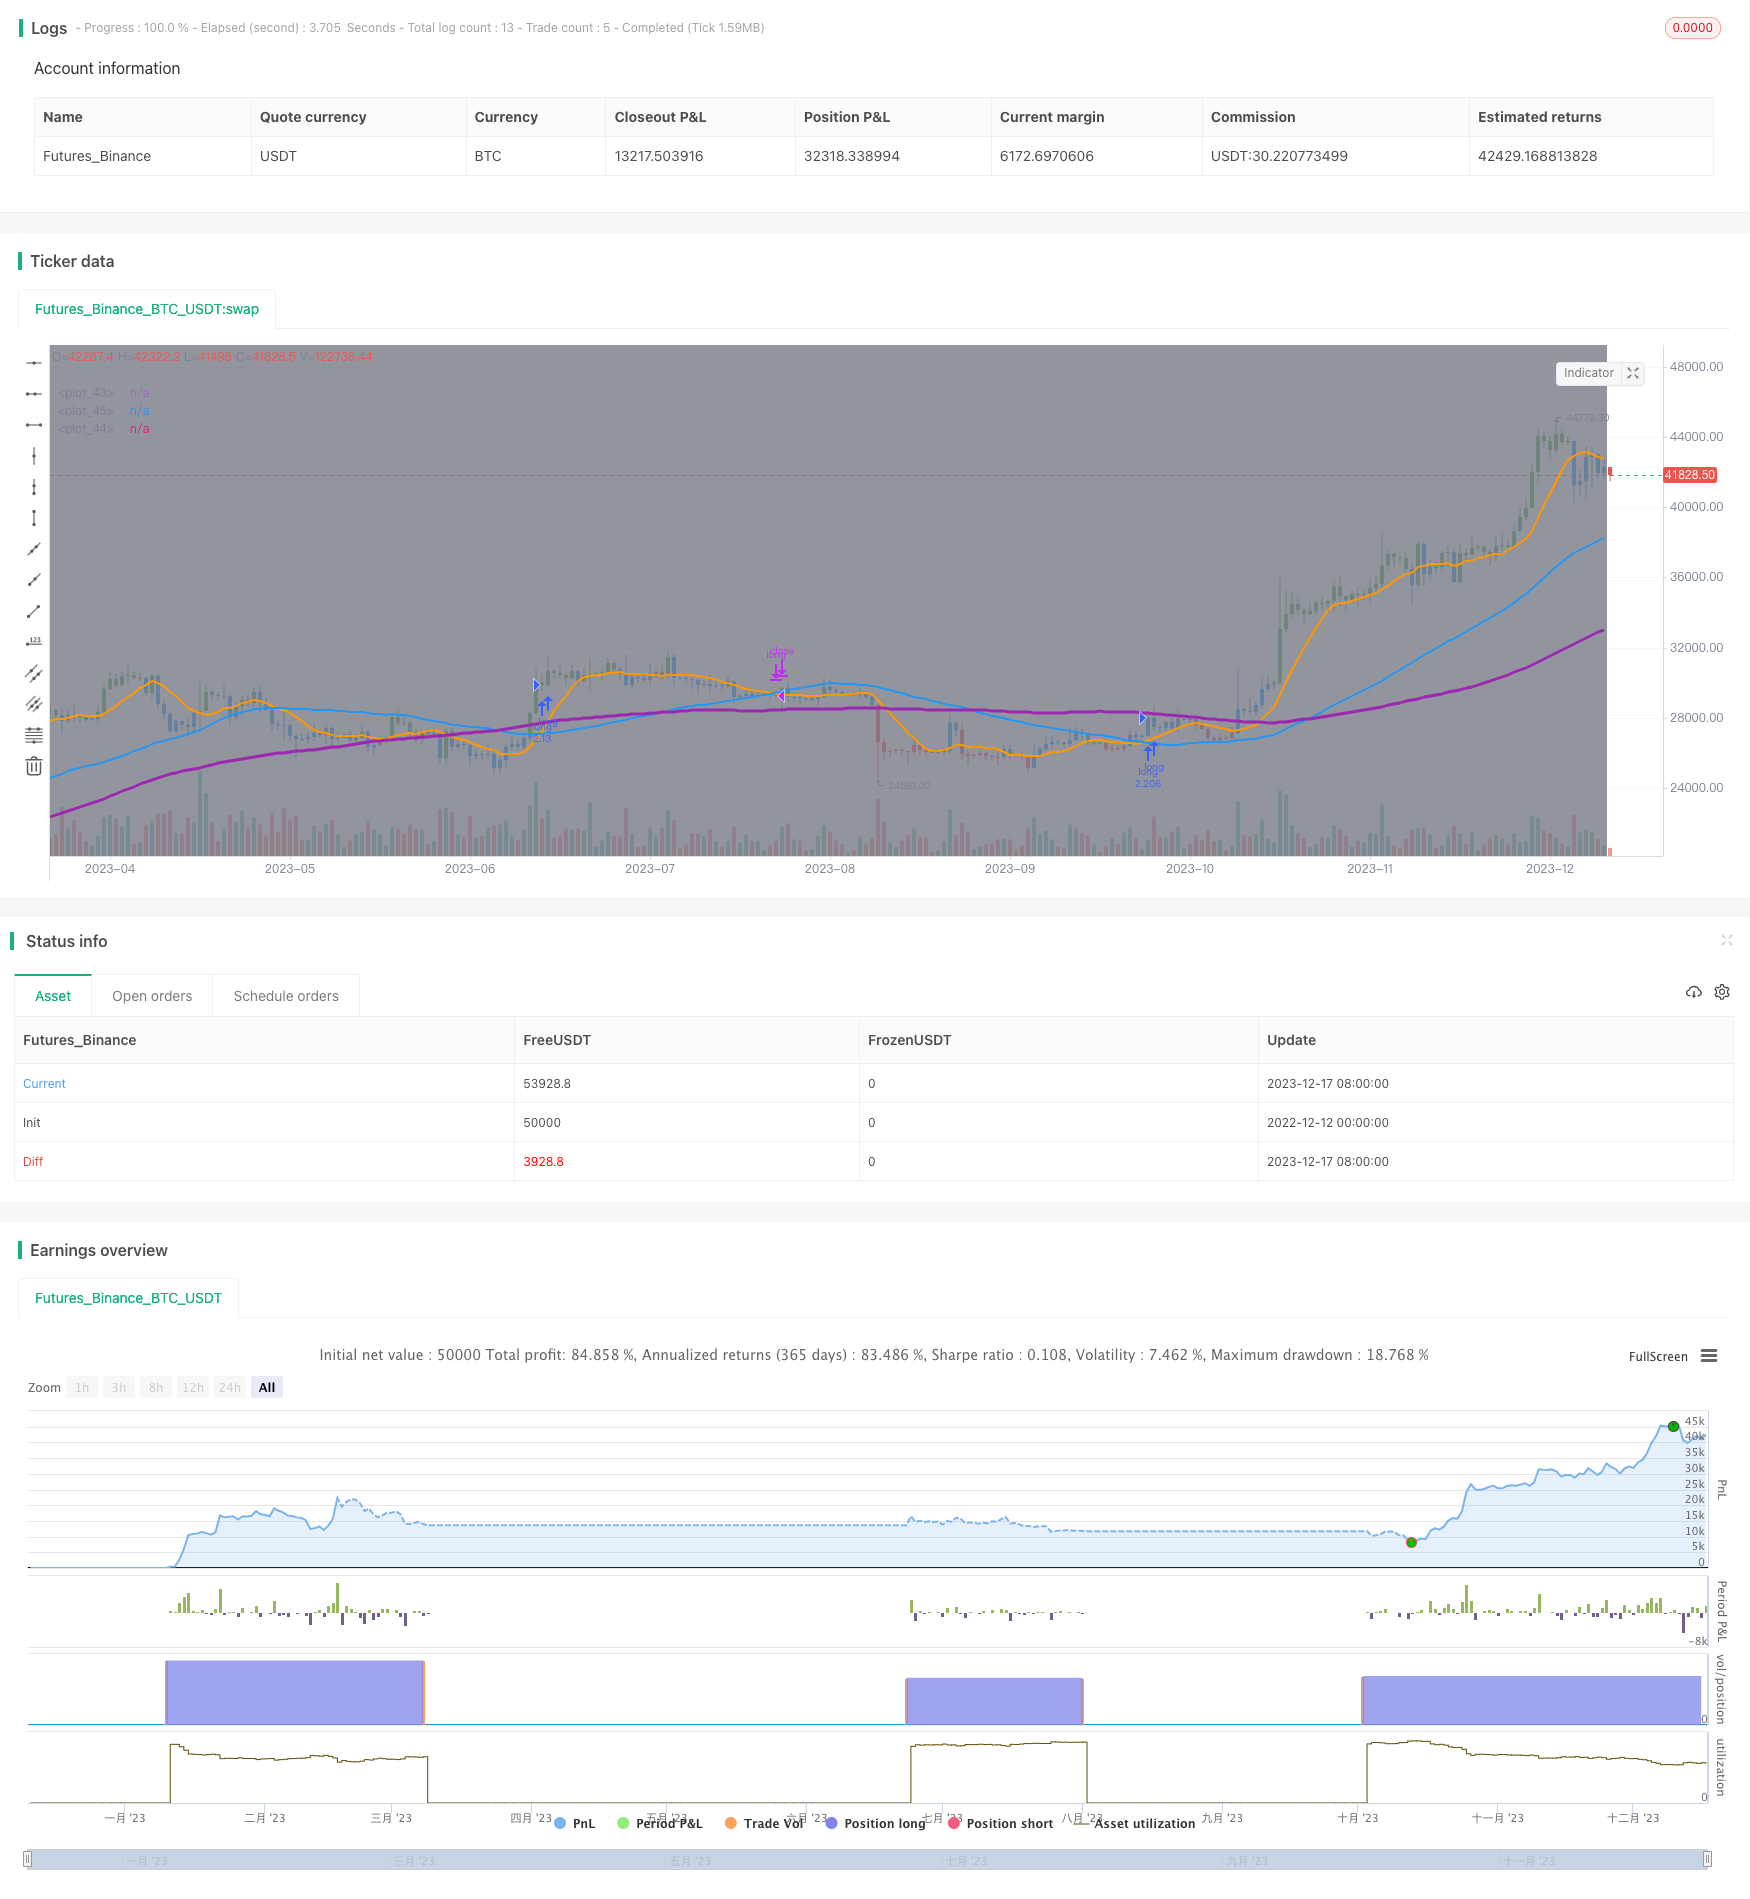
该策略通过优化常规的移动平均线交叉策略,设定三条不同周期的移动平均线,采用9周期、50周期和100周期的移动平均线构建金叉形态,在中长线均线处于上升趋势的条件下,短期均线上穿中线均线形成金叉买入信号。策略名称为“移动平均线交叉金叉优化交易策略”。
该策略使用9周期、50周期和100周期三条移动平均线。其中,9周期移动平均线为短期均线,50周期移动平均线为中线均线,100周期移动平均线为长期均线。策略的交易信号来自短期均线与中线均线的交叉。具体逻辑是,在长期均线处于上升趋势(长期均线价高于中线均线)的条件下,短期均线上穿中线均线时产生买入信号;短期均线下穿中线均线时产生卖出信号,实现交易。
相比常规的双移动平均线交叉策略,该策略在产生交易信号前增加了中长期趋势判断的条件,可以有效过滤掉部分无效信号。在长期趋势不明朗的情况下,策略将不会产生信号,可以避免被套。同时,该策略适合在短中期内捕捉趋势性行情,降低了激进入场的可能性。
该策略在设定参数时需要调整均线的周期组合,不同的周期组合对策略的效果会产生影响。如果周期参数设置不当,将面临产生过多虚假信号的风险。此外,交易者需要警惕潜在的系统性风险,及时止损来规避风险。
可以考虑结合其他指标来辅助判断市场趋势,如MACD、BOLL等,设置更加严格的入场条件,或者结合波动率指标构建自适应移动平均线,使得参数可以根据市场环境自动调整,进一步优化策略。
该策略在常规双移动平均线交叉的基础上,添加长期均线判断和 filter 条件,可有效过滤虚假信号,适合捕捉短中期趋势行情,是一种简单实用的趋势跟踪策略。但交易者仍需关注参数优化和系统性风险,制定 scient 的资金管理策略。
||
This strategy optimizes the conventional moving average crossover strategy by setting three moving averages with different periods, constructing a golden cross pattern with 9-period, 50-period and 100-period moving averages. It generates buy signals when the short-term MA crosses above the medium-term MA while the long-term MA is in an uptrend. The strategy name is "Optimized Golden Cross Moving Average Crossover Trading Strategy".
The strategy utilizes three moving averages with periods of 9, 50 and 100. The 9-period MA is the short-term MA, 50-period MA is the medium-term MA, and 100-period MA is the long-term MA. Trading signals are generated by the crossover between the short-term MA and medium-term MA. Specifically, when the long-term MA is in an uptrend (above the medium-term MA), a buy signal is triggered when the short-term MA crosses above the medium-term MA. A sell signal is triggered when the short-term MA crosses below the medium-term MA.
Compared with the conventional dual moving average crossover strategy, this strategy adds the condition of judging medium and long-term trends before generating trading signals, which can effectively filter out some invalid signals. When long-term trends are unclear, the strategy will not generate signals, avoiding being trapped in consolidation. At the same time, this strategy is suitable for capturing trending moves in the short and medium term, reducing the possibility of aggressive entry.
When setting parameters for this strategy, the combination of moving average periods needs to be adjusted. Different period combinations will have an impact on the strategy's effectiveness. If the period parameters are not set properly, there is a risk of generating too many false signals. In addition, traders need to be aware of potential systemic risks and timely stop losses to mitigate risks.
Consider incorporating other indicators to aid in judging market trends, such as MACD, BOLL, etc., and set stricter entry conditions, or incorporate volatility indicators to construct adaptive moving averages so that parameters can automatically adjust based on market conditions to further optimize the strategy.
Based on the conventional dual moving average crossover, this strategy adds long-term MA judgment and filter conditions, which can effectively filter out false signals and is suitable for capturing short to medium-term trending moves. It is a simple and practical trend-following strategy. However, traders still need to pay attention to parameter optimization and systemic risks, and formulate scientific risk management strategies.
[/trans]
Strategy Arguments
| Argument | Default | Description |
|---|---|---|
| v_input_1 | true | Enable Bar Color? |
| v_input_2 | false | Show Fast Moving Average |
| v_input_3 | true | Show Slow Moving Average |
| v_input_4 | 9 | v_input_4 |
| v_input_5 | 100 | v_input_5 |
| v_input_6 | 50 | v_input_6 |
| v_input_7 | true | From Month |
| v_input_8 | true | From Day |
| v_input_9 | 2020 | From Year |
| v_input_10 | true | Thru Month |
| v_input_11 | true | Thru Day |
| v_input_12 | 2112 | Thru Year |
| v_input_13 | true | Show Date Range |
Source (PineScript)
/*backtest
start: 2022-12-12 00:00:00
end: 2023-12-18 00:00:00
period: 1d
basePeriod: 1h
exchanges: [{"eid":"Futures_Binance","currency":"BTC_USDT"}]
*/

//@version=4
strategy("Golden Cross, SMA 100, Moving Average Strategy (by Coinrule)", shorttitle="Golden_Cross_Strat_MA100_optimized", overlay=true, initial_capital = 1000,process_orders_on_close=true, default_qty_type = strategy.percent_of_equity, default_qty_value = 100)

// Input
switch1=input(true, title="Enable Bar Color?")
switch2=input(false, title="Show Fast Moving Average")
switch3=input(true, title="Show Slow Moving Average")

//Calculate Moving Averages
movingaverage_fast = sma(close, input(9))
movingaverage_slow = sma(close, input(100))
movingaverage_normal= sma(close, input(50))

//Backtest dates
fromMonth = input(defval = 1,    title = "From Month",      type = input.integer, minval = 1, maxval = 12)
fromDay   = input(defval = 1,    title = "From Day",        type = input.integer, minval = 1, maxval = 31)
fromYear  = input(defval = 2020, title = "From Year",       type = input.integer, minval = 1970)
thruMonth = input(defval = 1,    title = "Thru Month",      type = input.integer, minval = 1, maxval = 12)
thruDay   = input(defval = 1,    title = "Thru Day",        type = input.integer, minval = 1, maxval = 31)
thruYear  = input(defval = 2112, title = "Thru Year",       type = input.integer, minval = 1970)
showDate  = input(defval = true, title = "Show Date Range", type = input.bool)

start     = timestamp(fromYear, fromMonth, fromDay, 00, 00)        // backtest start window
finish    = timestamp(thruYear, thruMonth, thruDay, 23, 59)        // backtest finish window
window()  => time >= start and time <= finish ? true : false       // create function "within window of time"


// Calculation
bullish_cross = crossover(movingaverage_fast, movingaverage_normal)
bearish_cross = crossunder(movingaverage_fast, movingaverage_normal)

//Entry and Exit
if bullish_cross and window() and movingaverage_slow > movingaverage_normal
    strategy.entry("long", strategy.long)

strategy.close("long", when = bearish_cross and window())

// Colors
bartrendcolor = close > movingaverage_fast and close > movingaverage_slow and change(movingaverage_slow) > 0 ? color.green : close < movingaverage_fast and close < movingaverage_slow and change(movingaverage_slow) < 0 ? color.red : color.blue
barcolor(switch1?bartrendcolor:na)

// Output
plot(movingaverage_fast, color=color.orange, linewidth=2)
plot(movingaverage_slow, color=color.purple, linewidth=3)
plot(movingaverage_normal, color=color.blue, linewidth=2)

bgcolor(color = showDate and window() ? color.gray : na, transp = 90)
Detail
https://www.fmz.com/strategy/435864
Last Modified
2023-12-19 13:37:33
