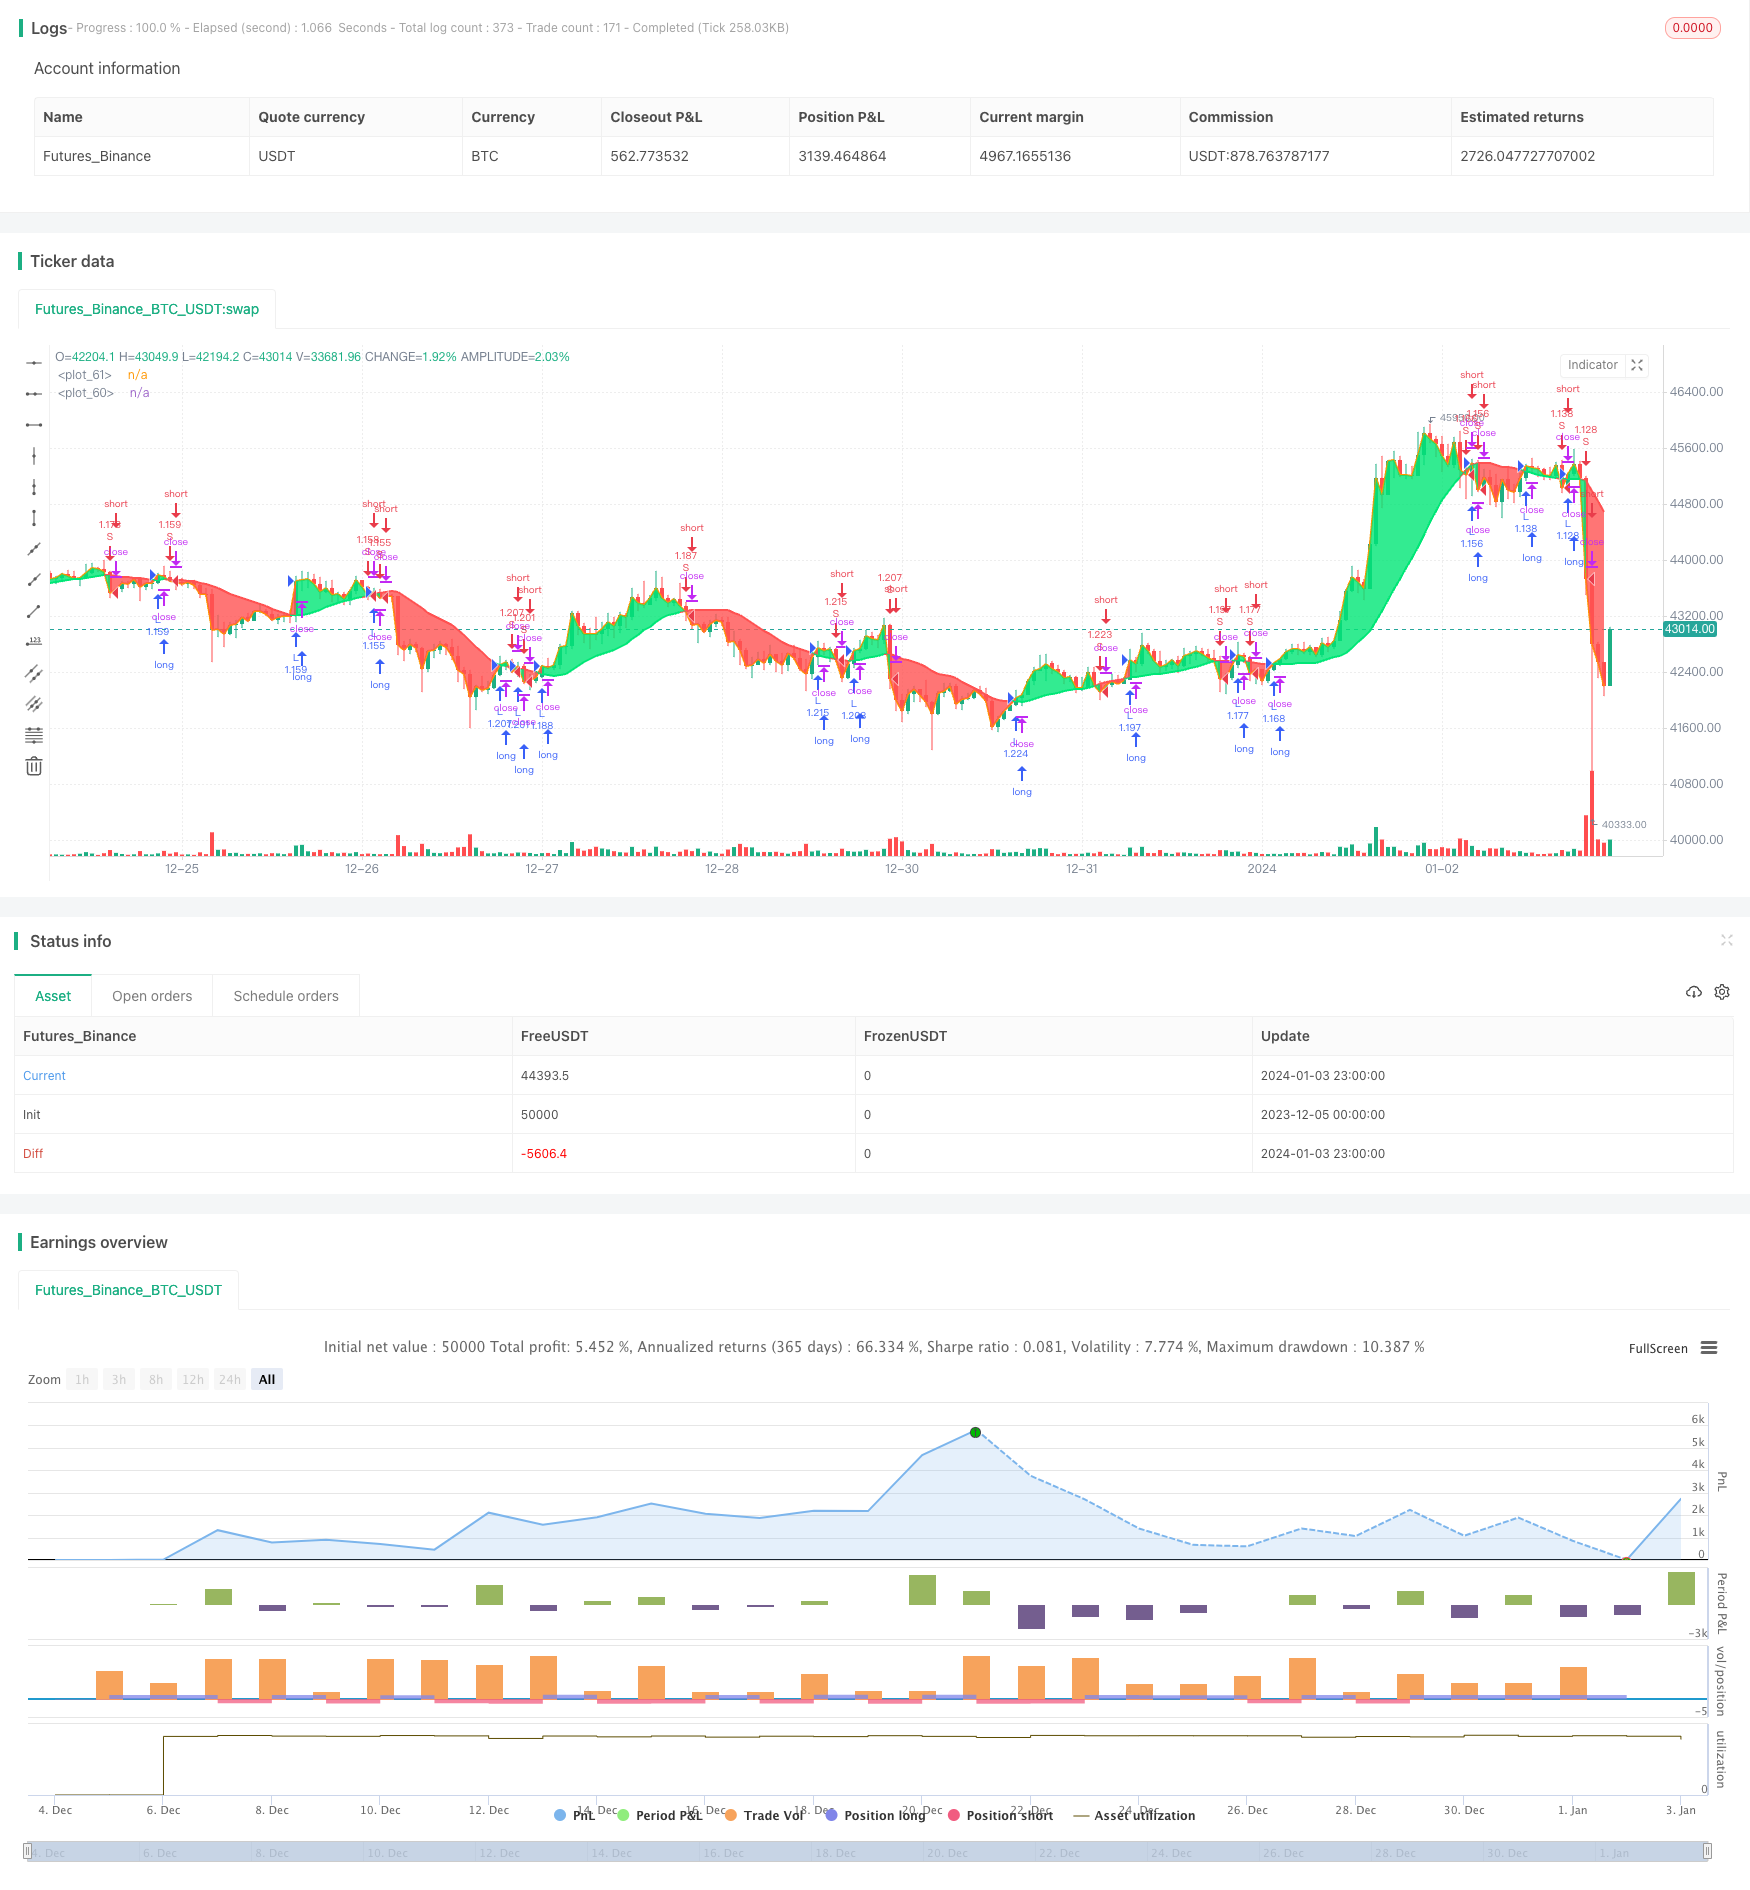
Name
移动平均线系统交易策略Moving-Average-System-Trading-Strategy
Author
ChaoZhang
Strategy Description
[trans]
本文讨论的是一个基于简单移动平均线的交易策略。该策略使用长度为17的移动平均线与收盘价进行比较,当收盘价上穿移动平均线时做多,下穿时做空。
该策略使用以下参数计算移动平均线:
- MA源:默认为OHLC的平均值(OHCL4)
- MA类型:默认为简单移动平均线(SMA)
- MA长度:默认为17
根据这些参数,会调用getMAType()函数计算出17周期的收盘价SMA。
然后比较收盘价与该移动平均线的关系:
- 收盘价 > 移动平均线:长仓信号
- 收盘价 < 移动平均线:空仓信号
当收盘价从下方上穿移动平均线时,产生做多信号;从上方下穿时,产生做空信号。
在回测周期内,遇到做多信号就开多仓,遇到做空信号就开空仓。
该策略最大的优势在于思路非常简单清晰。仅仅一个指标,通过其方向的转变来判断趋势的转变。策略容易理解,容易实现,适合新手学习。
另外,移动平均线属于趋势跟踪型指标,能够有效跟踪趋势转变,避免被市场上的短期噪音干扰。
通过参数调整,可以适应不同周期和不同品种。
首先,该策略仅基于一个指标,判断标准较为单一,可能会产生更多的错误信号。
并且,该策略属于趋势跟踪系统,无法在盘整和震荡的市场上正常工作。
此外,没有设置止损止盈,存在亏损扩大的风险。
解决方法是结合其它指标,优化参数组合,减少错误信号。设置止损止盈,控制风险,并优化回撤。
下面几个方面可以作为策略优化的思路:
-
调整移动平均线参数,优化周期数。比如改为30周期或50周期等。
-
尝试不同类型的移动平均线,如EMA,VIDYA等。它们对价格变化的敏感程度不同。
-
增加其他指标结合。例如与MACD组合,能够判断强弱。或与RSI组合,减少错误信号。
-
增加止损机制。设定固定百分比或ATR值的移动止损。控制单笔亏损。
-
增加止盈机制。设定目标利润百分比。让利润最大化。
这些优化能使策略表现更加稳定,避免回撤过大。
本文分析了一个基于17周期移动平均线的简单交易策略。策略信号来源简单,容易理解和实现,属于典型的趋势跟踪系统。通过对策略的深入解读,分析了其优势和风险,并给出了多个维度的优化思路。相信通过不断优化和丰富,该策略可以逐步演化,在实盘中也能获得稳定的收益。
||
This article discusses a trading strategy based on a simple moving average. The strategy compares the closing price with a 17-period moving average, going long when the closing price crosses above the moving average and going short when it crosses below.
The strategy uses the following parameters to calculate the moving average:
- MA Source: Default to average of OHLC (OHLC4)
- MA Type: Default to Simple Moving Average (SMA)
- MA Length: Default to 17
Based on these parameters, the getMAType() function is called to calculate the 17-period SMA of closing prices.
Then compare the relationship between the closing price and the moving average:
- Close > Moving Average: Long signal
- Close < Moving Average: Short signal
When the closing price crosses above the moving average from below, a long signal is generated. When it crosses below from above, a short signal is generated.
During the backtest period, open long positions when long signals appear and open short positions when short signals appear.
The biggest advantage of this strategy is that the logic is very simple and clear. With just one indicator, it judges the trend reversal based on the direction change of the indicator. The strategy is easy to understand and implement, suitable for beginners to learn.
In addition, moving averages belong to trend-following indicators, which can effectively track trend changes and avoid interference from short-term market noise.
By adjusting parameters, it can adapt to different cycles and different products.
Firstly, this strategy relies solely on one indicator, so the judgment criteria are relatively single, which may generate more false signals.
Also, as a trend following system, it does not work well in range-bound and sideways markets.
Besides, without stop loss or take profit, there is a risk of expanding losses.
The solutions are to incorporate other indicators, optimize parameter combinations to reduce false signals. Add stop loss and take profit to control risks and optimize drawdowns.
Here are some ideas for optimizing the strategy:
-
Adjust moving average parameters, optimize period numbers, e.g. change to 30-period or 50-period.
-
Try different types of moving averages, like EMA, VIDYA etc. They have varying sensitivity to price changes.
-
Add other indicators in combination, e.g. MACD to judge strength; RSI to reduce false signals.
-
Add stop loss mechanisms. Set fixed percentage or ATR-based trailing stop loss to control single-trade loss amount.
-
Add take profit mechanisms. Set target profit percentage to maximize profits.
These optimizations can make the strategy performance more stable and avoid excessive drawdowns.
This article analyzes a simple trading strategy based on a 17-period moving average. The strategy has simple signal sources, easy to understand and implement, belonging to a typical trend following system. Through in-depth interpretation of the strategy, its pros and cons are analyzed, and multiple dimensions of optimization ideas are proposed. It is believed that through continuous optimization and enrichment, this strategy can gradually evolve and achieve stable returns in live trading as well.
[/trans]
Strategy Arguments
| Argument | Default | Description |
|---|---|---|
| v_input_1 | 2012 | Backtest Start Year |
| v_input_2 | true | Backtest Start Month |
| v_input_3 | true | Backtest Start Day |
| v_input_4 | 2019 | Backtest Stop Year |
| v_input_5 | 12 | Backtest Stop Month |
| v_input_6 | 31 | Backtest Stop Day |
| v_input_7_ohlc4 | 0 | MA Source: ohlc4 |
| v_input_8 | 0 | MA Type: sma |
| v_input_9 | 17 | MA Length |
Source (PineScript)
/*backtest
start: 2023-12-05 00:00:00
end: 2024-01-04 00:00:00
period: 1h
basePeriod: 15m
exchanges: [{"eid":"Futures_Binance","currency":"BTC_USDT"}]
*/

//@version=4
strategy("Simple 17 BF ?", overlay=true, initial_capital=10000, default_qty_type=strategy.percent_of_equity, default_qty_value=100, commission_type=strategy.commission.percent, commission_value=0.0)

/////////////// Time Frame ///////////////
testStartYear = input(2012, "Backtest Start Year")
testStartMonth = input(1, "Backtest Start Month")
testStartDay = input(1, "Backtest Start Day")
testPeriodStart = timestamp(testStartYear,testStartMonth,testStartDay, 0, 0)

testStopYear = input(2019, "Backtest Stop Year")
testStopMonth = input(12, "Backtest Stop Month")
testStopDay = input(31, "Backtest Stop Day")
testPeriodStop = timestamp(testStopYear,testStopMonth,testStopDay, 0, 0)

testPeriod() => true

///////////// Moving Average /////////////
source = input(title="MA Source", defval=ohlc4)
maType = input(title="MA Type", defval="sma", options=["sma", "ema", "swma", "wma", "vwma", "rma"])
length = input(title="MA Length", defval=17)

///////////// Get MA Function /////////////
getMAType(maType, sourceType, maLen) =>
    res = sma(close, 1)

    if maType == "ema"
        res := ema(sourceType, maLen)
    if maType == "sma"
        res := sma(sourceType, maLen)
    if maType == "swma"
        res := swma(sourceType)
    if maType == "wma"
        res := wma(sourceType, maLen)
    if maType == "vwma"
        res := vwma(sourceType, maLen)
    if maType == "rma"
        res := rma(sourceType, maLen)
    res

MA = getMAType(maType, source, length)

/////////////// Strategy ///////////////
long = close > MA
short = close < MA

last_long = 0.0
last_short = 0.0
last_long := long ? time : nz(last_long[1])
last_short := short ? time : nz(last_short[1])

long_signal = crossover(last_long, last_short)
short_signal = crossover(last_short, last_long)

/////////////// Execution ///////////////
if testPeriod()
    strategy.entry("L", strategy.long, when=long_signal)
    strategy.entry("S", strategy.short, when=short_signal)

/////////////// Plotting ///////////////
p1 = plot(MA, color = long ? color.lime : color.red, linewidth=2)
p2 = plot(close, linewidth=2)
fill(p1, p2, color=strategy.position_size > 0 ? color.lime : strategy.position_size < 0 ? color.red : color.white, transp=80)
Detail
https://www.fmz.com/strategy/437786
Last Modified
2024-01-05 15:36:00
