Name
移动平均线转折点交叉交易策略Moving-Average-Turning-Point-Crossover-Trading-Strategy
Author
ChaoZhang
Strategy Description
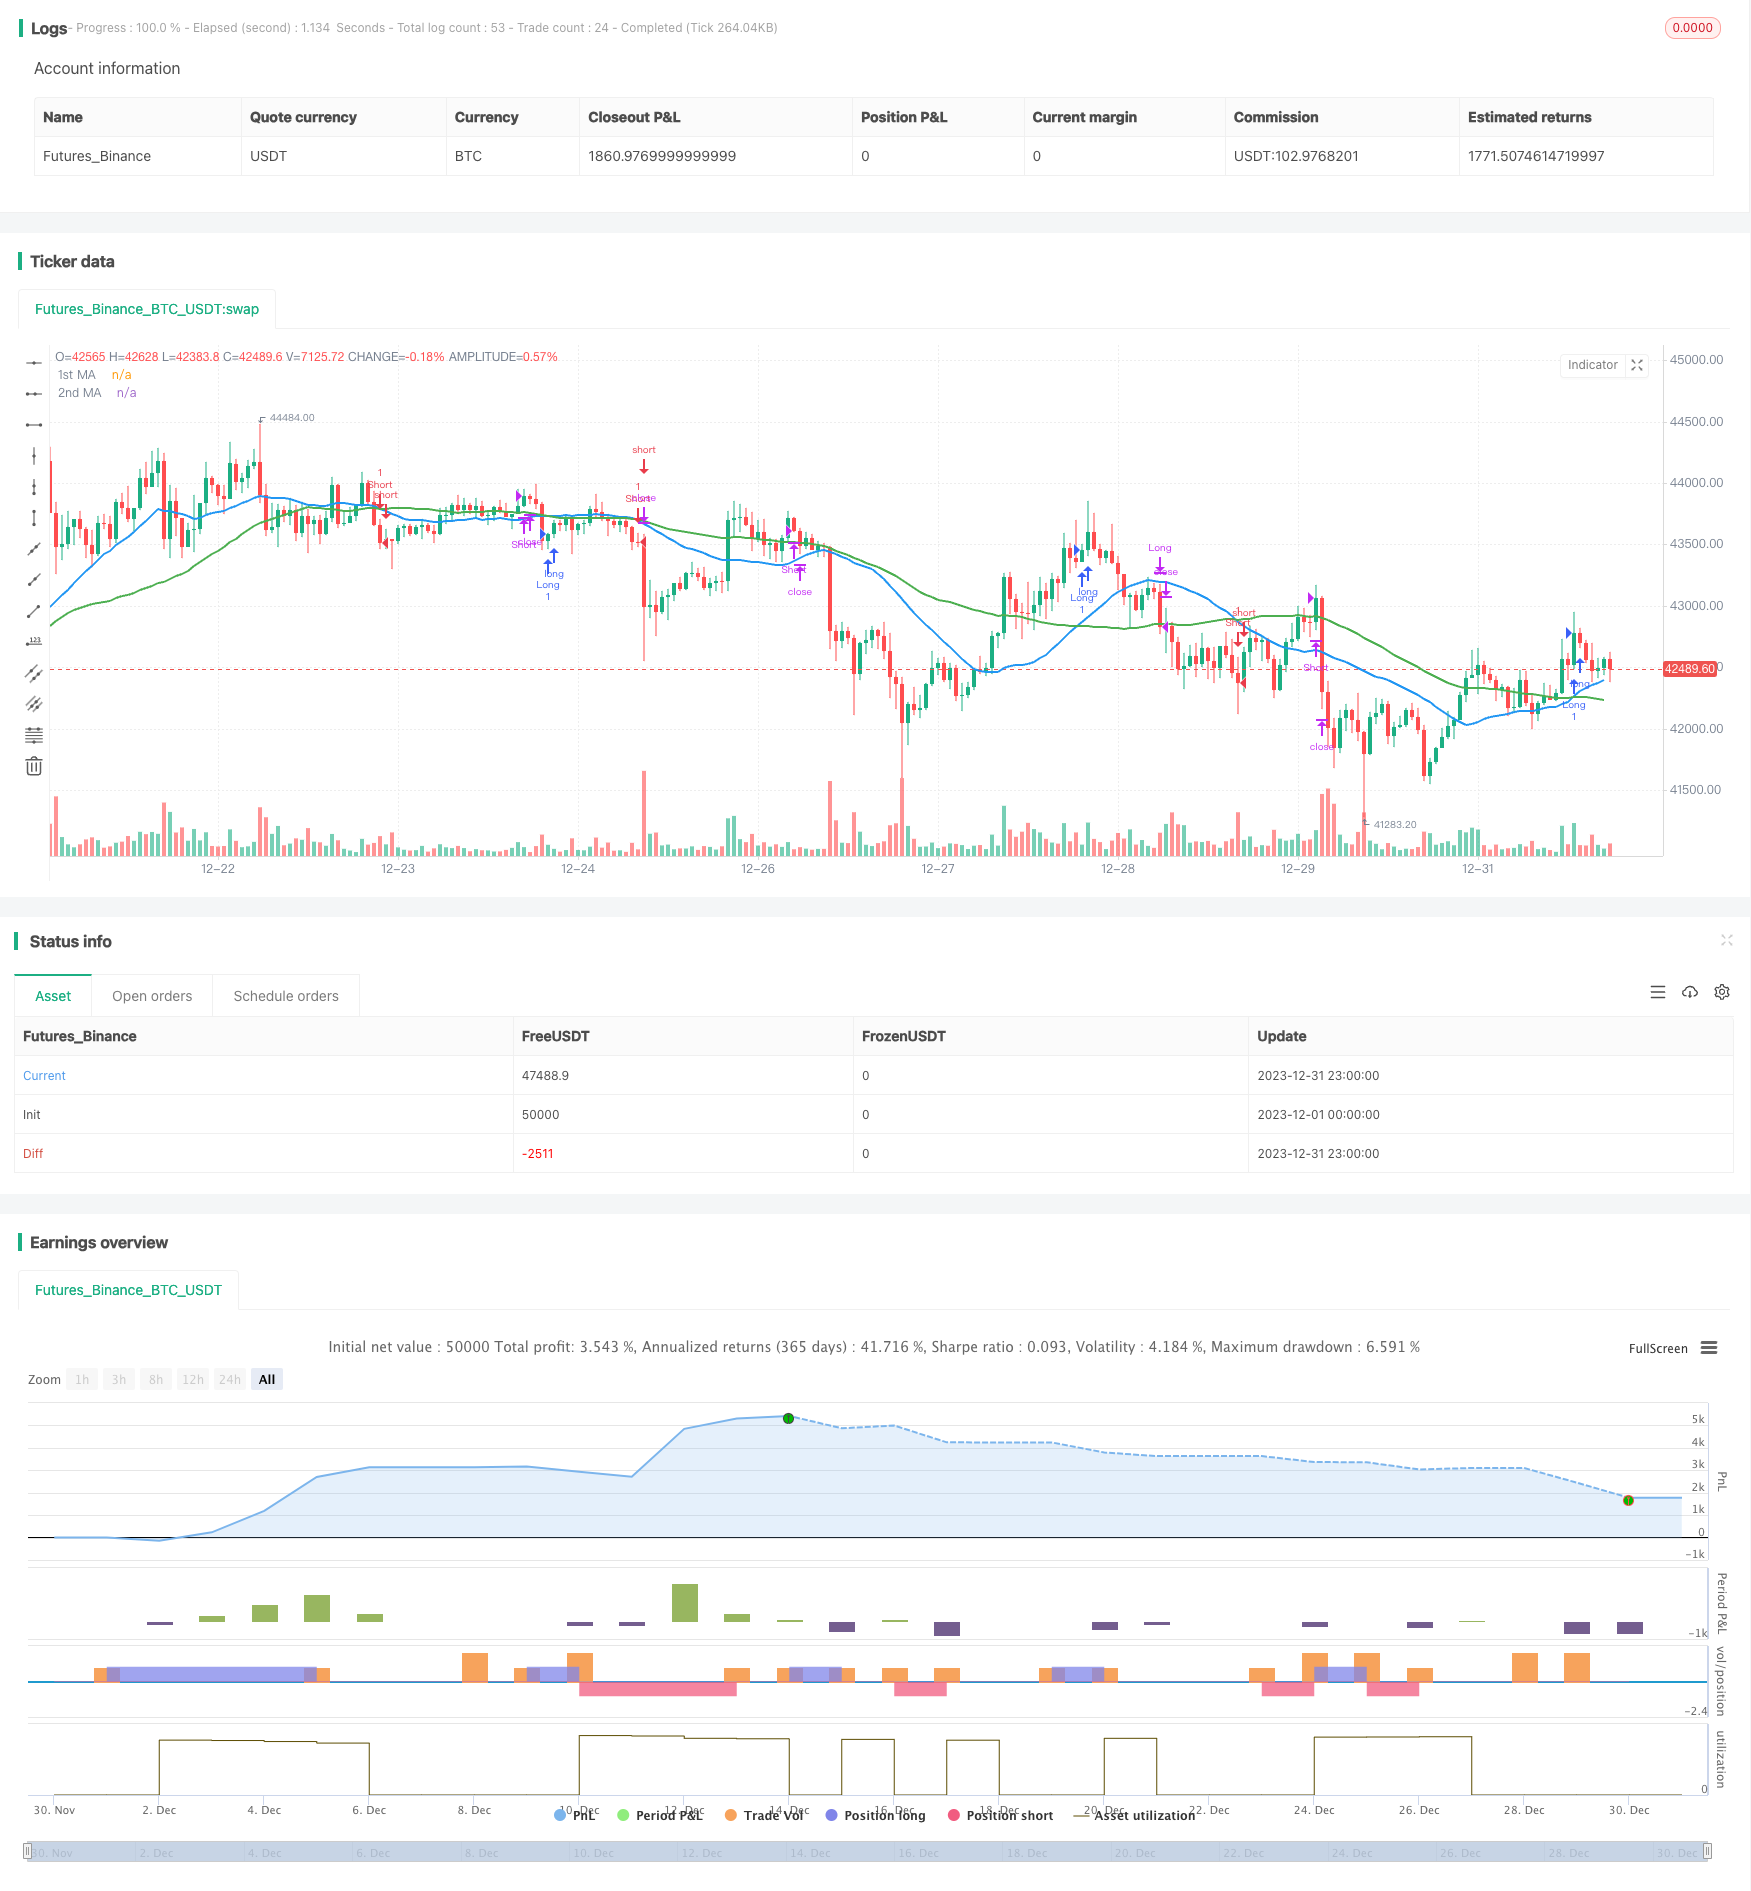
移动平均线转折点交叉交易策略是一种经典的技术指标策略。该策略的核心思想是结合不同周期的移动平均线进行买卖信号生成,并利用移动平均线转折点进一步优化交易 exit。这种策略适用于各种时间周期和品种,可以获得稳定的收益。
该策略主要使用两条移动平均线,一条较短周期作为快线,另一条较长周期作为慢线。当快线从下方向上突破慢线时产生买入信号;当快线从上方向下跌破慢线时产生卖出信号。这就是经典的移动平均线交叉策略的交易信号生成机制。
进一步地,该策略利用移动平均线的转折点退出交易。当快线从上涨转为下跌时,多单会离场;当快线从下跌转为上涨时,空单会离场。移动平均线转折点可以捕捉市场短期反转时点,这有助于策略及时止损或止盈,从而提高整体收益率。
移动平均线转折点交叉交易策略具有以下几个优势:
-
操作简单,容易实现。该策略仅运用两个指标:移动平均线和ROC指标。代码实现不复杂。
-
抗连续亏损能力强。移动平均线本身具有一定的滞后性和平滑价格趋势的特点,这可以过滤掉部分噪音,避免在震荡趋势中产生过多无效交易。
-
能够有效控制单边亏损。利用移动平均线转折点及时止损,可以减少单边大幅亏损的出现。
-
适用性广泛。该策略原理简单,可以适用于各种品种和不同的交易时间框架,如日线、小时线等。参数优化空间大。
-
收益稳定。相比追逐市场热点的策略,该策略偏重风险控制,不追求超高收益,但可以获得稳定的正收益。
移动平均线转折点交叉交易策略也存在一些风险,主要集中在以下几个方面:
-
移动平均线滞后性。当快速行情来临时,移动平均线的交叉信号会有一定滞后,可能错过最佳入场时机。
-
空仓时间长。该策略出场比较及时,但进场信号较慢。这会导致部分时候存在过多空仓时间。空仓期间会错过一定行情获利机会。
-
参数优化难度大。移动平均线长度、ROC周期等参数的选择会对策略表现产生很大影响。但参数优化需要大量历史数据进行回测,优化难度较大。
-
大幅震荡行情下效果欠佳。当出现大幅震荡行情时,移动平均线会产生多次无效交叉,这时策略表现会受到影响。
可以从以下几个方面进一步优化该交易策略:
-
结合趋势滤波指标。加入像ADX,ATR等指标,用于判断趋势状态。在无明确趋势时通过阈值关闭策略,避免无效交易。
-
多时间框架结合。在更高时间框架判断主趋势方向,避免逆势交易。
-
参数自适应优化。使移动平均线长度等参数能够根据实时市场波动程度进行自适应调整,提高参数健壮性。
-
介绍模式识别。在MA交叉点识别蜡烛图案以过滤掉假信号。
移动平均线转折点交叉交易策略整体来说是一种风险收益平衡的策略。它有着易于实现,抗连续亏损,收益稳定等优势,也存在移动平均线滞后性,空仓时间过长等问题。通过参数优化,引入趋势判断,模式识别等手段,可以进一步提升该策略的效果。
||
The Moving Average Turning Point Crossover Trading Strategy is a classic technical indicator strategy. The core idea of this strategy is to generate buy and sell signals by combining moving averages of different periods and further optimize trade exits using moving average turning points. This strategy is suitable for various timeframes and products and can achieve stable returns.
The strategy mainly uses two moving averages, one with a shorter period as the fast line and the other with a longer period as the slow line. When the fast line breaks through the slow line upward, a buy signal is generated. When the fast line breaks through the slow line downward, a sell signal is generated. This is the trading signal generation mechanism of the classic moving average crossover strategy.
Furthermore, the strategy exits trades using the turning points of the moving averages. When the fast line turns from rising to falling, long positions will exit. When the fast line turns from falling to rising, short positions will exit. Moving average turning points can capture short-term market reversal points, which helps the strategy to cut losses or take profits in time, thereby improving overall return.
The Moving Average Turning Point Crossover Trading Strategy has the following advantages:
-
Simple to implement. The strategy only uses two indicators: Moving Average and ROC indicator. The code is not complicated.
-
Strong ability to withstand consecutive losses. The inherent lag and price smoothing characteristics of moving averages can filter out some noise and avoid generating too many invalid trades in ranging trends.
-
Can effectively control unilateral losses. Timely stop losses using moving average turning points can reduce large unilateral losses.
-
Wide applicability. The strategy principle is simple and can be applied to different products and trading timeframes such as daily and hourly bars. Large parameter optimization space.
-
Stable returns. Compared with strategies chasing market hotspots, this strategy focuses more on risk control instead of pursuing super high returns, but it can obtain stable positive returns.
The Moving Average Turning Point Crossover Trading Strategy also has some risks, mainly in the following aspects:
-
Lagging of moving averages. When fast market comes, the crossover signals of moving averages will lag, possibly missing the best entry point.
-
Long empty holding periods. This strategy has timely exits but slower entry signals. This can lead to excessive empty holding periods. Profit opportunities are missed during empty holding periods.
-
Difficult parameter optimization. The choice of parameters like moving average length and ROC cycle will have great impact on the strategy's performance. But parameter optimization requires a lot of historical data for backtesting, posing difficulties in optimization.
-
Poor performance in high volatility trends. In high volatility ranging trends, moving averages will generate multiple invalid crossovers, impairing the strategy's performance.
The trading strategy can be further optimized in the following aspects:
-
Incorporate trend filtering indicators. Add indicators like ADX and ATR to judge trend status. Disable the strategy when there is no clear trend to avoid useless trades.
-
Combine multiple timeframes. Identify main trend direction on higher timeframes to avoid trading against main trend.
-
Adaptive parameter optimization. Enable parameters like moving average length to adjust adaptively based on real-time market volatility to improve parameter robustness.
-
Introducing pattern recognition. Identify candlestick patterns at MA crossover points to filter out false signals.
Overall, the Moving Average Turning Point Crossover Trading Strategy balances risk and returns. It has advantages like ease of implementation, resistance to consecutive losses, and stable returns. It also has disadvantages like the lagging issue of MAs and excessive empty holding periods. By optimizing parameters, incorporating trend judgment, pattern recognition etc, the strategy's performance can be further improved.
[/trans]
Strategy Arguments
| Argument | Default | Description |
|---|---|---|
| v_input_1_close | 0 | Source: close |
| v_input_2 | 25 | 1st MA Length |
| v_input_3 | 0 | 1st MA Type: SMA |
| v_input_4 | 50 | 2nd MA Length |
| v_input_5 | 0 | 2nd MA Type: SMA |
| v_input_6 | true | Lookback 1 |
| v_input_7 | 2 | Minimum slope magnitude * 100 |
Source (PineScript)
/*backtest
start: 2023-12-01 00:00:00
end: 2023-12-31 23:59:59
period: 1h
basePeriod: 15m
exchanges: [{"eid":"Futures_Binance","currency":"BTC_USDT"}]
*/

//@version=4
//study(title="MA Crossover Strategy", overlay = true)
strategy("MA Crossover Strategy with MA Turning Point Exits", overlay=true)
src = input(close, title="Source")

price = request.security(syminfo.tickerid, timeframe.period, src)
ma1 = input(25, title="1st MA Length")
type1 = input("SMA", "1st MA Type", options=["SMA", "EMA"])

ma2 = input(50, title="2nd MA Length")
type2 = input("SMA", "2nd MA Type", options=["SMA", "EMA"])

price1 = if (type1 == "SMA")
    sma(price, ma1)
else
    ema(price, ma1)

price2 = if (type2 == "SMA")
    sma(price, ma2)
else
    ema(price, ma2)


//plot(series=price, style=line,  title="Price", color=black, linewidth=1, transp=0)
plot(series=price1, style=line,  title="1st MA", color=blue, linewidth=2, transp=0)
plot(series=price2, style=line, title="2nd MA", color=green, linewidth=2, transp=0)


longCondition = crossover(price1, price2)
if (longCondition)
    strategy.entry("Long", strategy.long)

shortCondition = crossunder(price1, price2)
if (shortCondition)
    strategy.entry("Short", strategy.short)

lookback1 = input(1, "Lookback 1")
roc1 = roc(price1, lookback1)

ma1up = false
ma1down = false
ma2up = false
ma2down = false

ma1up := nz(ma1up[1])
ma1down := nz(ma1down[1])
ma2up := nz(ma2up[1])
ma2down := nz(ma2down[1])

trendStrength1 = input(2, title="Minimum slope magnitude * 100", type=float) * 0.01

if crossover(roc1, trendStrength1)
    ma1up := true
    ma1down := false

if crossunder(roc1, -trendStrength1)
    ma1up := false
    ma1down := true

shortexitCondition = ma1up and ma1down[1]
if (shortexitCondition)
    strategy.close("Short")

longexitCondition = ma1down and ma1up[1]
if (longexitCondition)
    strategy.close("Long")
Detail
https://www.fmz.com/strategy/440310
Last Modified
2024-01-29 11:15:42
