Name
移动平均线金叉死叉交易策略Moving-Average-Crossover-MACD-Trading-Strategy
Author
ChaoZhang
Strategy Description
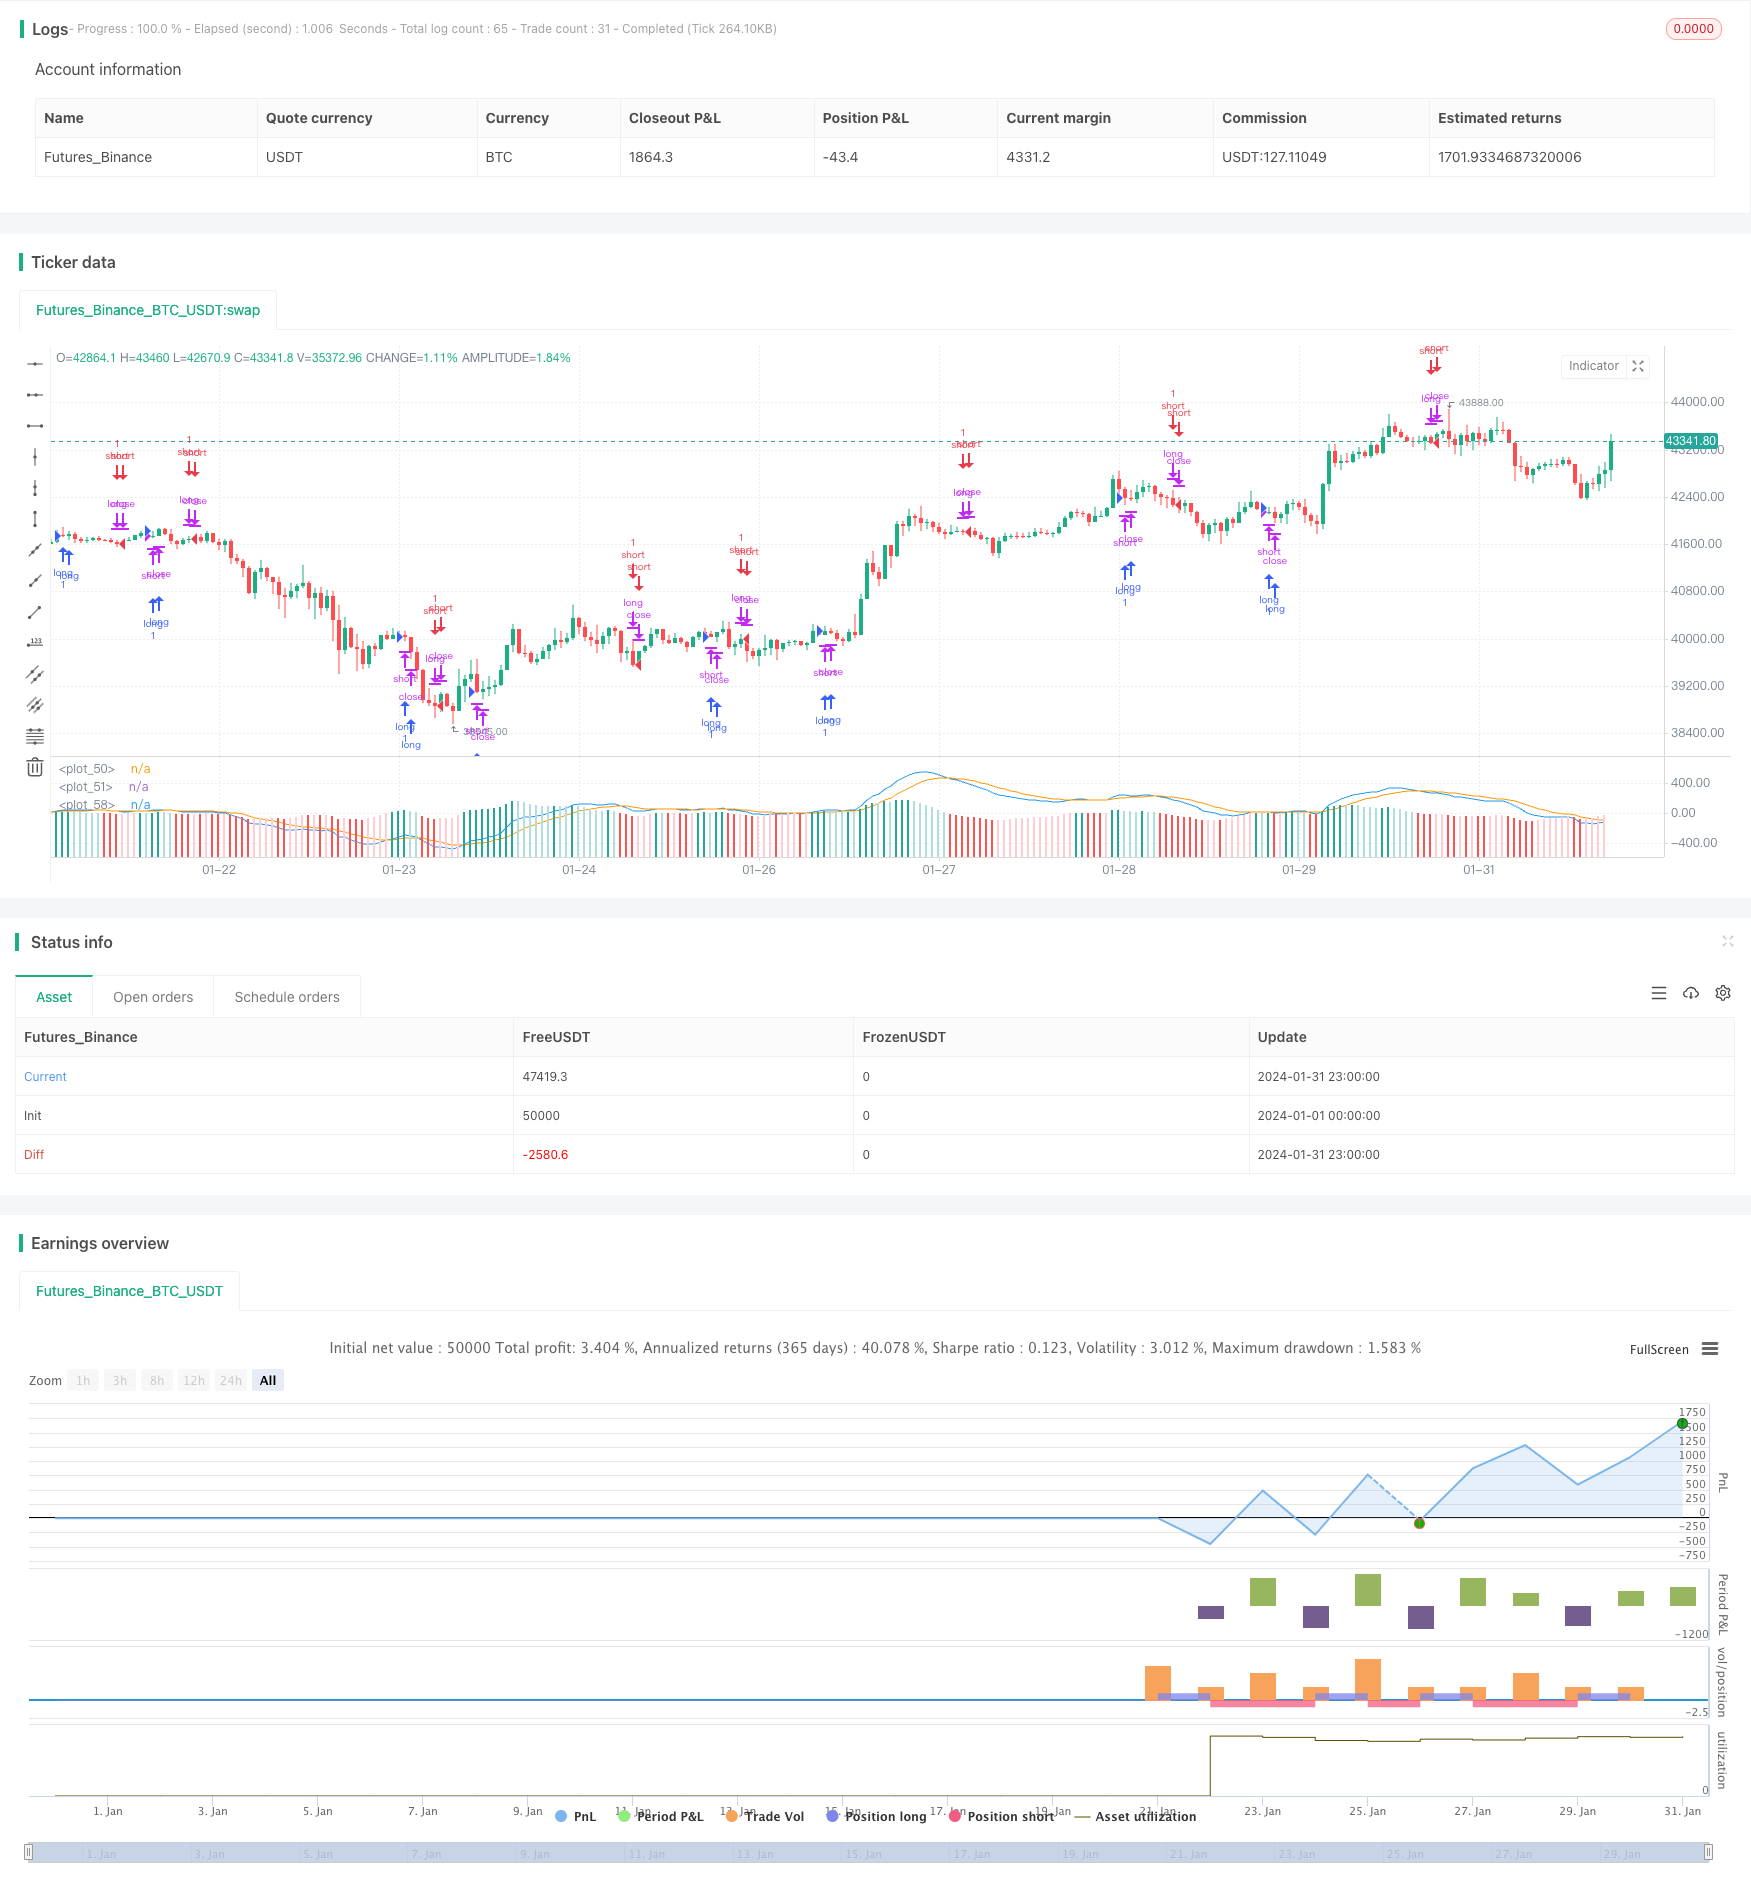
移动平均线金叉死叉交易策略是一种追踪短期和长期移动平均线(EMA)的交叉情况,在金叉和死叉时进行买入和卖出操作的量化交易策略。该策略结合MACD指标进行交易信号判断。
该策略主要依赖12日EMA、26日EMA和MACD指标。具体逻辑是:
- 计算12日EMA和26日EMA。
- 计算MACD(即12日EMA减26日EMA)。
- 计算MACD的9日EMA作为信号线。
- 当MACD上穿信号线时,产生买入信号。
- 当MACD下穿信号线时,产生卖出信号。
- 在产生信号的第二根K线收盘时,进行对应的买入或者卖出操作。
另外,该策略还设置了一些过滤条件:
- 交易时间为每天的非收市时间。
- MACD和信号线差值的绝对值需要大于0.08。
- 每次只允许单向持仓。
该策略结合移动平均线交叉和MACD指标,可以有效捕捉市场短期和中期趋势的转折点。主要优势有:
- 策略规则简单清晰,容易理解和实现。
- 指标参数经过优化,表现较为稳定。
- 兼顾追踪中短期趋势与及时止损退出。
- 交易逻辑严谨,避免无效交易。
该策略也存在一些风险:
- 回测数据拟合风险。实际运用时,参数和阈值可能需要调整。
- 频繁交易带来的滑点成本过高的风险。
- 趋势反转没有及时退出带来的亏损风险。
- 量化交易本身的杠杆风险放大。
对应缓解方法:
- 动态优化参数,调整阈值。
- 适当放宽交易规则,减少不必要交易。
- 结合更多指标判断反转信号。
- 严格控制仓位和杠杆。
该策略主要可从以下方面进行优化:
- 测试更长周期的移动平均线组合,寻找最优参数。
- 增加公司业绩、重大事件等基本面因素作为过滤器。
- 结合更多指标判断趋势反转时机,如布林带、KDJ等。
- 开发止损机制。当亏损达到事先设定的止损点时,主动止损。
- 添加 dangere ratio 以控制最大回撤。
移动平均线金叉死叉结合MACD交易策略,通过简单的趋势跟踪形成交易信号,易于实现,并结合适当的过滤条件控制风险,是一种行之有效的量化交易策略。该策略可通过参数优化、止损机制增加、结合更多辅助指标等方式得到改进。
||
The moving average crossover MACD trading strategy is a quantitative trading strategy that tracks the crossover situations of short-term and long-term exponential moving averages (EMA) and makes buy and sell operations when golden cross and dead cross occur. This strategy combines the MACD indicator for trading signal judgment.
This strategy mainly relies on 12-day EMA, 26-day EMA and MACD indicator. The specific logic is:
- Calculate the 12-day EMA and 26-day EMA.
- Calculate the MACD (that is, the 12-day EMA minus the 26-day EMA).
- Calculate the 9-day EMA of MACD as the signal line.
- When the MACD goes above the signal line, a buy signal is generated.
- When the MACD falls below the signal line, a sell signal is generated.
- Make the corresponding buy or sell operation at the close of the second candlestick after the signal is generated.
Additionally, this strategy also sets some filtering conditions:
- The trading time is the non-closing time of each trading day.
- The absolute value of the difference between the MACD and signal line needs to be greater than 0.08.
- Only one direction of position is allowed at a time.
This strategy combines moving average crossover and MACD indicator, which can effectively capture the inflection points of market short-term and medium-term trends. The main advantages are:
- The strategy rules are simple and clear, easy to understand and implement.
- The indicator parameters are optimized for relatively stable performance.
- It takes into account tracking medium and short term trends and timely stop loss exit.
- The trading logic is rigorous to avoid invalid trading.
This strategy also has some risks:
- Backtesting data overfitting risk. Actual application may require parameter and threshold adjustment.
- High slippage cost risk from frequent trading.
- Loss risk from failure to exit timely when trend reverses.
- Leverage risk amplification inherent in quantitative trading itself.
Corresponding mitigation methods:
- Dynamically optimize parameters and adjust thresholds.
- Appropriately relax trading rules to reduce unnecessary trading.
- Combine more indicators to judge reversal signals.
- Strictly control positions and leverage.
The main aspects for optimizing this strategy include:
- Test longer cycle moving average combinations to find optimal parameters.
- Add fundamentals like financial performance, significant events etc. as filters.
- Incorporate more indicators to determine trend reversal timing, like Bollinger Bands, KDJ etc.
- Develop stop loss mechanisms. Actively cut losses when losses reach pre-set stop loss points.
- Add drawdown ratio to control maximum drawdown.
The moving average crossover MACD trading strategy generates trading signals through simple trend tracking and effectively controls risks with appropriate filtering conditions. It is an effective quantitative trading strategy. The strategy can be improved in ways like parameter optimization, adding stop loss mechanisms, incorporating more auxiliary indicators etc.
[/trans]
Source (PineScript)
/*backtest
start: 2024-01-01 00:00:00
end: 2024-01-31 23:59:59
period: 1h
basePeriod: 15m
exchanges: [{"eid":"Futures_Binance","currency":"BTC_USDT"}]
*/

//@version=5
strategy("EMMA", max_bars_back = 200)

var up1 = #26A69A
var up2 = #B2DFDB
var down1 = #FF5252
var down2 = #FFCDD2
var confirmationLength = 2

var earliest = timestamp("20 Jan 2024 00:00 +0000")

// Regn u
shortEMA = ta.ema(close, 12)
longEMA = ta.ema(close, 26)
macd = shortEMA - longEMA
signal = ta.ema(macd, 9)
delta = macd - signal
absDelta = math.abs(delta)
previousDelta = delta[1]

signalCrossover = ta.crossover(macd, signal)
signalCrossunder = ta.crossunder(macd, signal)

harskiftetdag = hour(time[confirmationLength]) > hour(time)

enterLongSignal = signalCrossover[confirmationLength] and (macd > signal) and (absDelta >= 0.08)
exitLongSignal = signalCrossunder[confirmationLength] and (macd < signal)

enterShortSignal = signalCrossunder[confirmationLength] and (macd < signal) and (absDelta >= 0.08)
exitShortSignal = signalCrossover[confirmationLength] and (macd > signal)

// Så er det tid til at købe noe
qty = math.floor(strategy.equity / close)

if time >= earliest and not harskiftetdag
    if exitLongSignal
        strategy.close("long")
    else if enterLongSignal
        strategy.close("short")
        strategy.entry("long", strategy.long, qty = qty)

    if exitShortSignal
        strategy.close("short")
    else if enterShortSignal
        strategy.close("long")
        strategy.entry("short", strategy.short, qty = qty)

// Så er det tid til at vise noe

plot(macd, color=color.blue)
plot(signal, color=color.orange)

// bgcolor(color = delta > 0.1 ? color.new(color.green, 90) : color.new(color.green, 100))
// bgcolor(color = signalCrossover ? color.purple : signalCrossunder ? color.aqua : color.new(color.green, 100))

histogramColor = delta > 0 ? (previousDelta < delta ? up1 : up2) : (previousDelta > delta ? down1 : down2)

plot(
     delta,
     style=plot.style_columns,
     color=histogramColor
     )
Detail
https://www.fmz.com/strategy/442539
Last Modified
2024-02-22 16:25:13
