Name
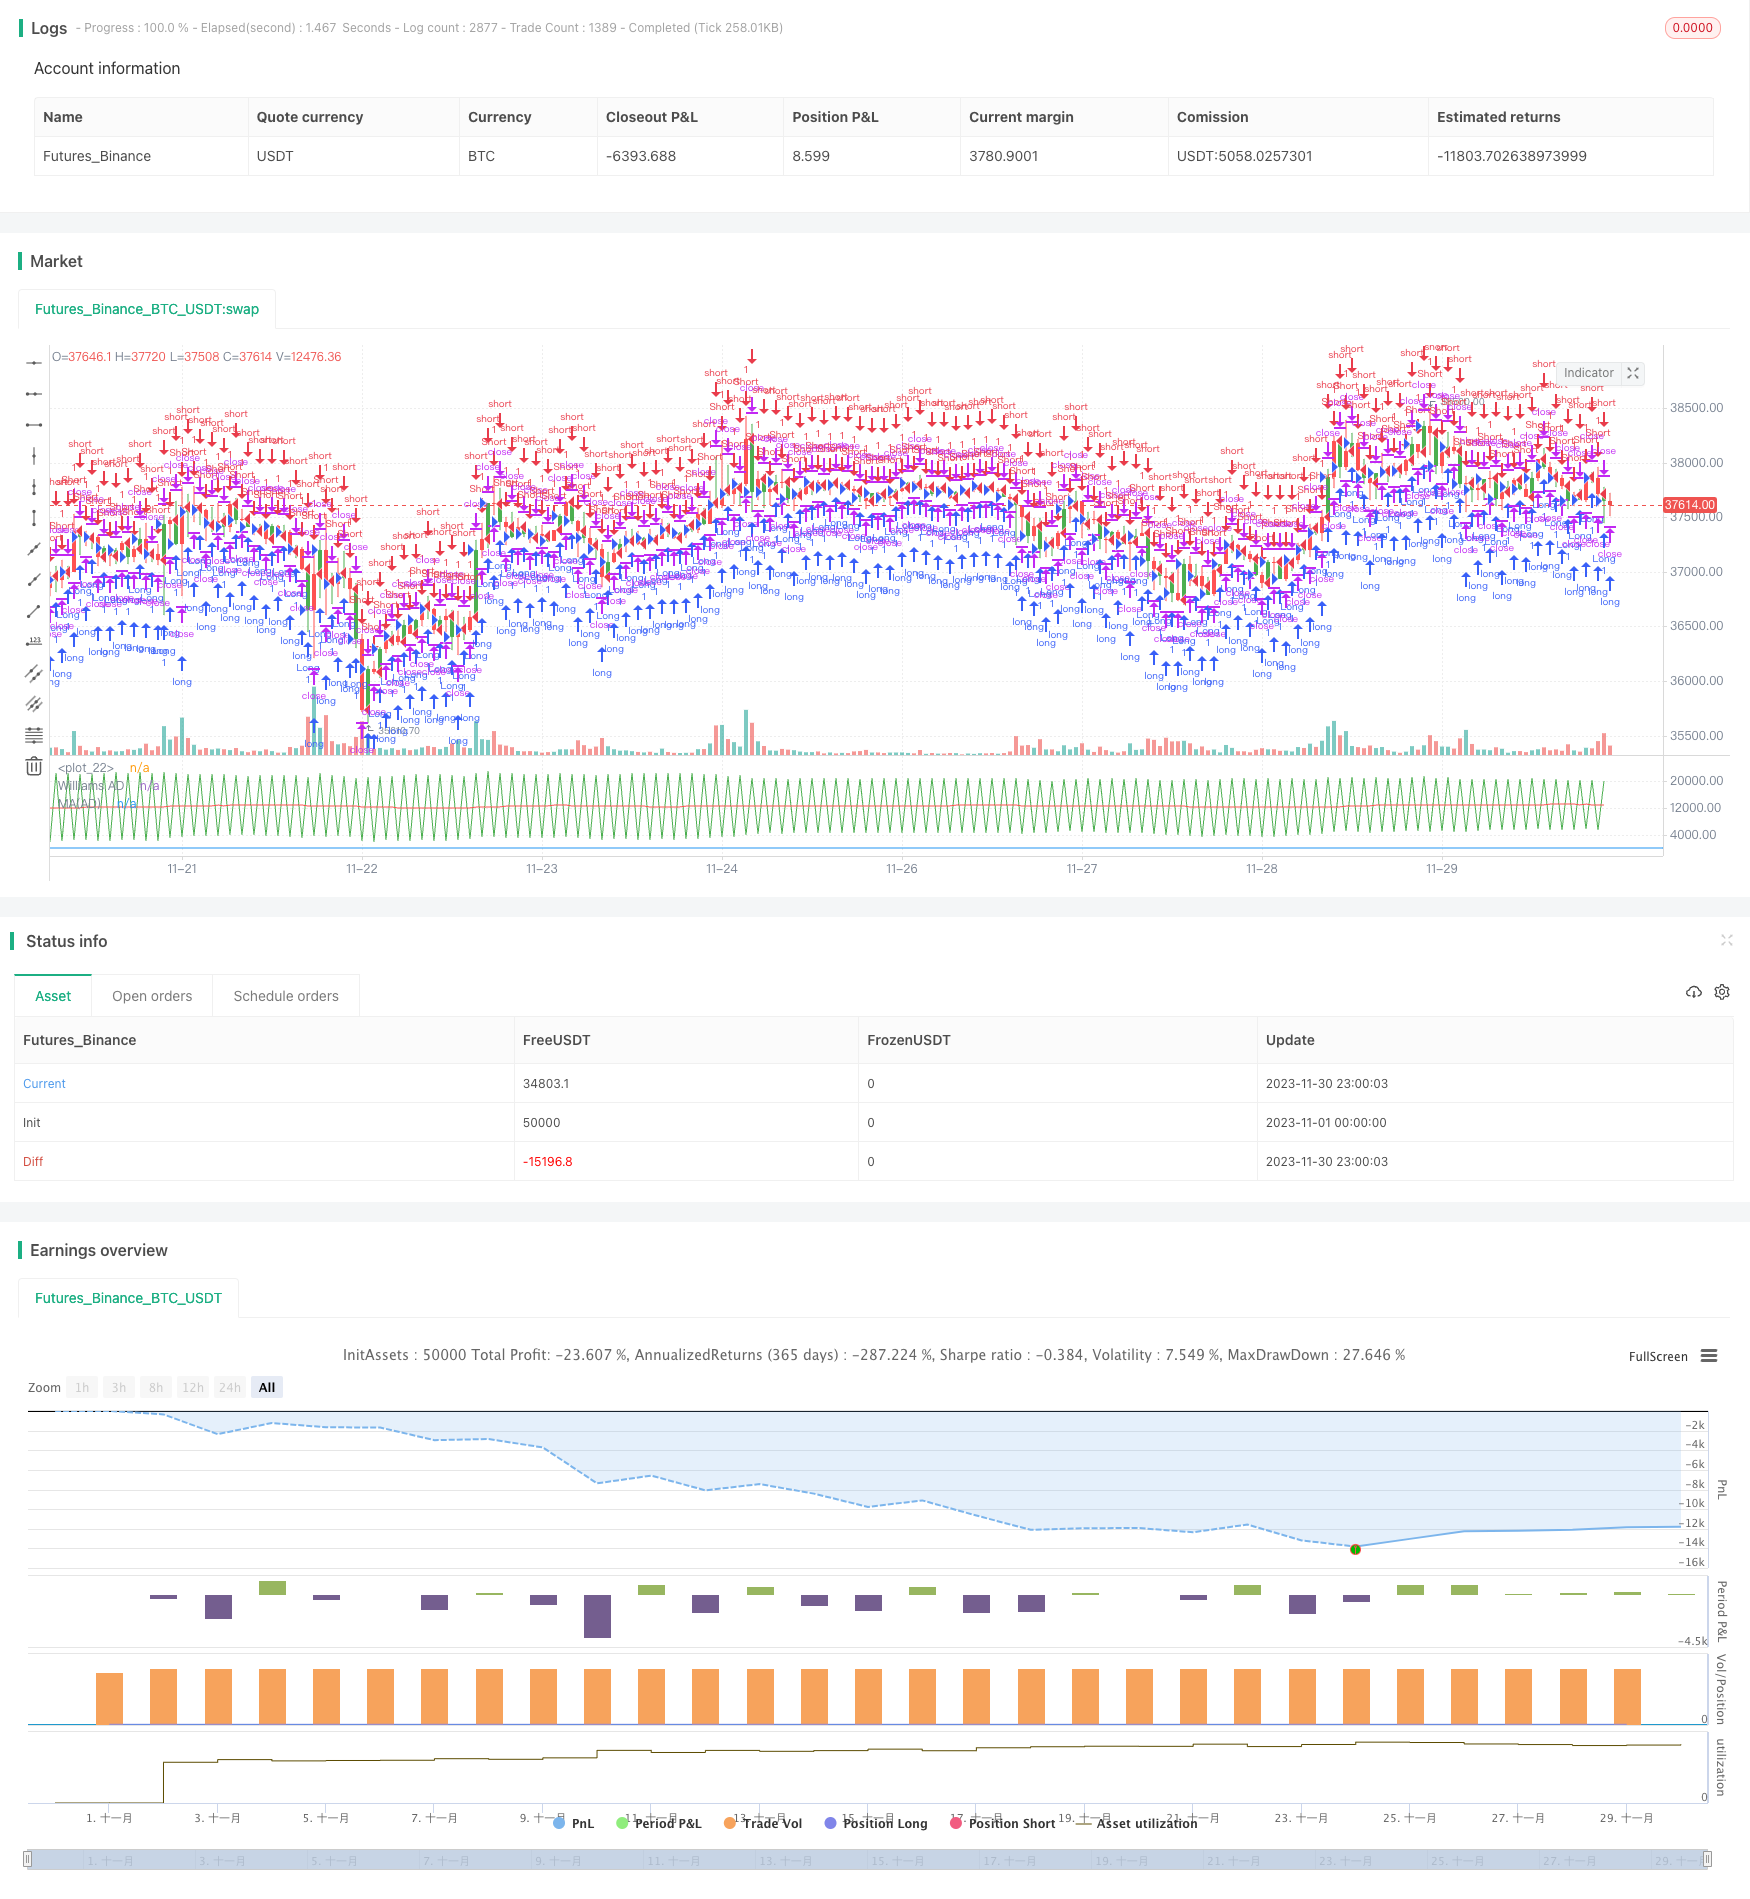
移动平均聚合Williams商业区买卖压力指标策略Moving-Average-Aggregation-Williams-Commercial-Bid-Ask-Pressure-Indicator-Strategy
Author
ChaoZhang
Strategy Description
该策略的主要思想是利用Williams商业区买卖压力指标判断市场的累积与分配阶段,以发现价格和Williams指标之间的背离,从而产生交易信号。当安全资产创下新高但Williams指标没有创下新高时,代表博弈参与者分配,应卖出;当安全资产创下新低但Williams指标没有创下新低时,代表博弈参与者累积,应买入。
策略原理详述如下:
该策略基于Williams商业区买卖压力指标,该指标反映市场的买卖压力,判断市场被买方或卖方所控制。Williams指标通过对收盘价、最高价和最低价的计算,判断价格的累积与分配。当价格创新高但Williams指标没有创新高,代表分配,应卖出;当价格创新低但Williams指标没有创新低,代表累积,应买入。
本策略运用Williams指标判断市场的累积和分配,以发现价格背离并产生交易信号。同时,利用移动平均线来平滑Williams指标,避免出现错误信号。当Williams指标高于其移动平均线时为累积阶段;低于移动平均线时为分配阶段。在发现背离时,若为长仓则在分配阶段卖出,在累积阶段买入;若为短仓则相反。
该策略主要优势有:
-
能准确判断市场的买卖压力,捕捉价格趋势的转折点。
-
运用移动平均线来平滑指标曲线,避免产生错误信号。
-
规则清晰明确,易于理解与实施。
-
可灵活调整参数,适用于不同市场环境。
主要风险及解决方法如下:
-
Williams指标可能产生错误信号,移动平均线可在一定程度上减轻这一问题。
-
若参数设置不当,可能错过价格转折或产生虚假信号。应调整参数使其适应不同周期。
-
须关注突发事件对价格的影响,必要时暂停交易计划。
该策略主要可优化的方向:
-
测试更多参数组合,寻找最佳参数。
-
增加其他技术指标进行组合,提高信号准确性。
-
增加止损策略,降低单笔损失。
-
优化入场时机,在趋势更加明确后进入。
总的来说,本策略利用Williams商业区买卖压力指标判断市场博弈参与者的意愿,再结合移动平均线发现价格背离,从而产生交易信号。该策略易于理解实施,可通过调整参数适用于不同市场,也可进行多方面优化,值得深入研究与运用。
||
The main idea of this strategy is to use the Williams Commercial Bid-Ask Pressure Indicator to judge the accumulation and distribution stages of the market, so as to discover the divergence between price and Williams Indicator and generate trading signals. When the security reaches a new high but the Williams Indicator does not reach a new high, it represents distribution by game participants and should sell. When the security reaches a new low but the Williams Indicator does not reach a new low, it represents accumulation by game participants and should buy.
The strategy principle is described in detail as follows:
This strategy is based on the Williams Commercial Bid-Ask Pressure Indicator, which reflects the buying and selling pressure in the market and judges whether the market is controlled by buyers or sellers. The Williams Indicator calculates the accumulation and distribution of prices based on the closing price, highest price and lowest price. When the price reaches a new high but the Williams Indicator does not reach a new high, it represents distribution and should sell. When the price reaches a new low but the Williams Indicator does not reach a new low, it represents accumulation and should buy.
This strategy uses the Williams Indicator to judge the accumulation and distribution of the market in order to discover price divergence and generate trading signals. At the same time, it uses moving averages to smooth the Williams Indicator to avoid false signals. When the Williams Indicator is above its moving average, it is in an accumulation stage. When below the moving average, it is in a distribution stage. When divergence occurs, go long in accumulation stage and go short in distribution stage.
The main advantages of this strategy are:
-
Accurately judge the buying and selling pressure in the market and capture inflection points of price trends.
-
Use moving averages to smooth the indicator curve and avoid false signals.
-
The rules are clear and easy to understand and implement.
-
Flexible parameter adjustment adaptable to different market environments.
The main risks and solutions are:
-
Williams Indicator may generate false signals. Moving averages can alleviate this to some extent.
-
Improper parameter settings may miss price reversals or generate false signals. Parameters should be adjusted to adapt to different cycles.
-
Pay attention to the impact of sudden events on prices and suspend trading plans if necessary.
The main directions for optimizing this strategy are:
-
Test more parameter combinations to find the optimal parameters.
-
Add other technical indicators for combination to improve signal accuracy.
-
Add stop loss strategies to reduce single loss.
-
Optimize entry timing to enter after trend becomes more obvious.
In summary, this strategy uses the Williams Commercial Bid-Ask Pressure Indicator to judge the willingness of market participants, combined with moving averages to discover price divergence, thus generating trading signals. This strategy is easy to understand and implement, adaptable to different markets through parameter adjustment, and can be optimized in many ways, worth in-depth research and application.
[/trans]
Strategy Arguments
| Argument | Default | Description |
|---|---|---|
| v_input_1 | 14 | Length |
| v_input_2 | false | Trade reverse |
Source (PineScript)
/*backtest
start: 2023-11-01 00:00:00
end: 2023-11-30 23:59:59
period: 1h
basePeriod: 15m
exchanges: [{"eid":"Futures_Binance","currency":"BTC_USDT"}]
*/

//@version=2
////////////////////////////////////////////////////////////
//  Copyright by HPotter v1.0 23/01/2018
// Accumulation is a term used to describe a market controlled by buyers;
// whereas distribution is defined by a market controlled by sellers.
// Williams recommends trading this indicator based on divergences:
//
//  Distribution of the security is indicated when the security is making
//  a new high and the A/D indicator is failing to make a new high. Sell.
//
//  Accumulation of the security is indicated when the security is making
//  a new low and the A/D indicator is failing to make a new low. Buy.
//
//You can change long to short in the Input Settings
//WARNING:
//- For purpose educate only
//- This script to change bars colors.
////////////////////////////////////////////////////////////
strategy(title="Smoothened Williams Accumulation/Distribution (Williams AD)", shorttitle="Williams AD")
Length = input(14, step = 1)
reverse = input(false, title="Trade reverse")
hline(0, color=blue, linestyle=line)
xPrice = close
xWAD = iff(close > nz(close[1], 0), nz(xWAD[1],0) + close - low[1],
         iff(close < nz(close[1],0), nz(xWAD[1],0) + close - high[1],0))
xWADMA = sma(xWAD, Length)
pos = iff(xWAD > xWADMA, 1,
       iff(xWAD < xWADMA, -1, nz(pos[1], 0)))
possig = iff(reverse and pos == 1, -1,
          iff(reverse and pos == -1, 1, pos))
if (possig == 1)
    strategy.entry("Long", strategy.long)
if (possig == -1)
    strategy.entry("Short", strategy.short)
barcolor(possig == -1 ? red: possig == 1 ? green : blue )
plot(xWAD, color=green, title="Williams AD")
plot(xWADMA, color=red, title="MA(AD)")
Detail
https://www.fmz.com/strategy/434609
Last Modified
2023-12-07 17:48:42
