Name
突破交易策略Volatility-Breakout-Trading-Strategy
Author
ChaoZhang
Strategy Description
[trans]
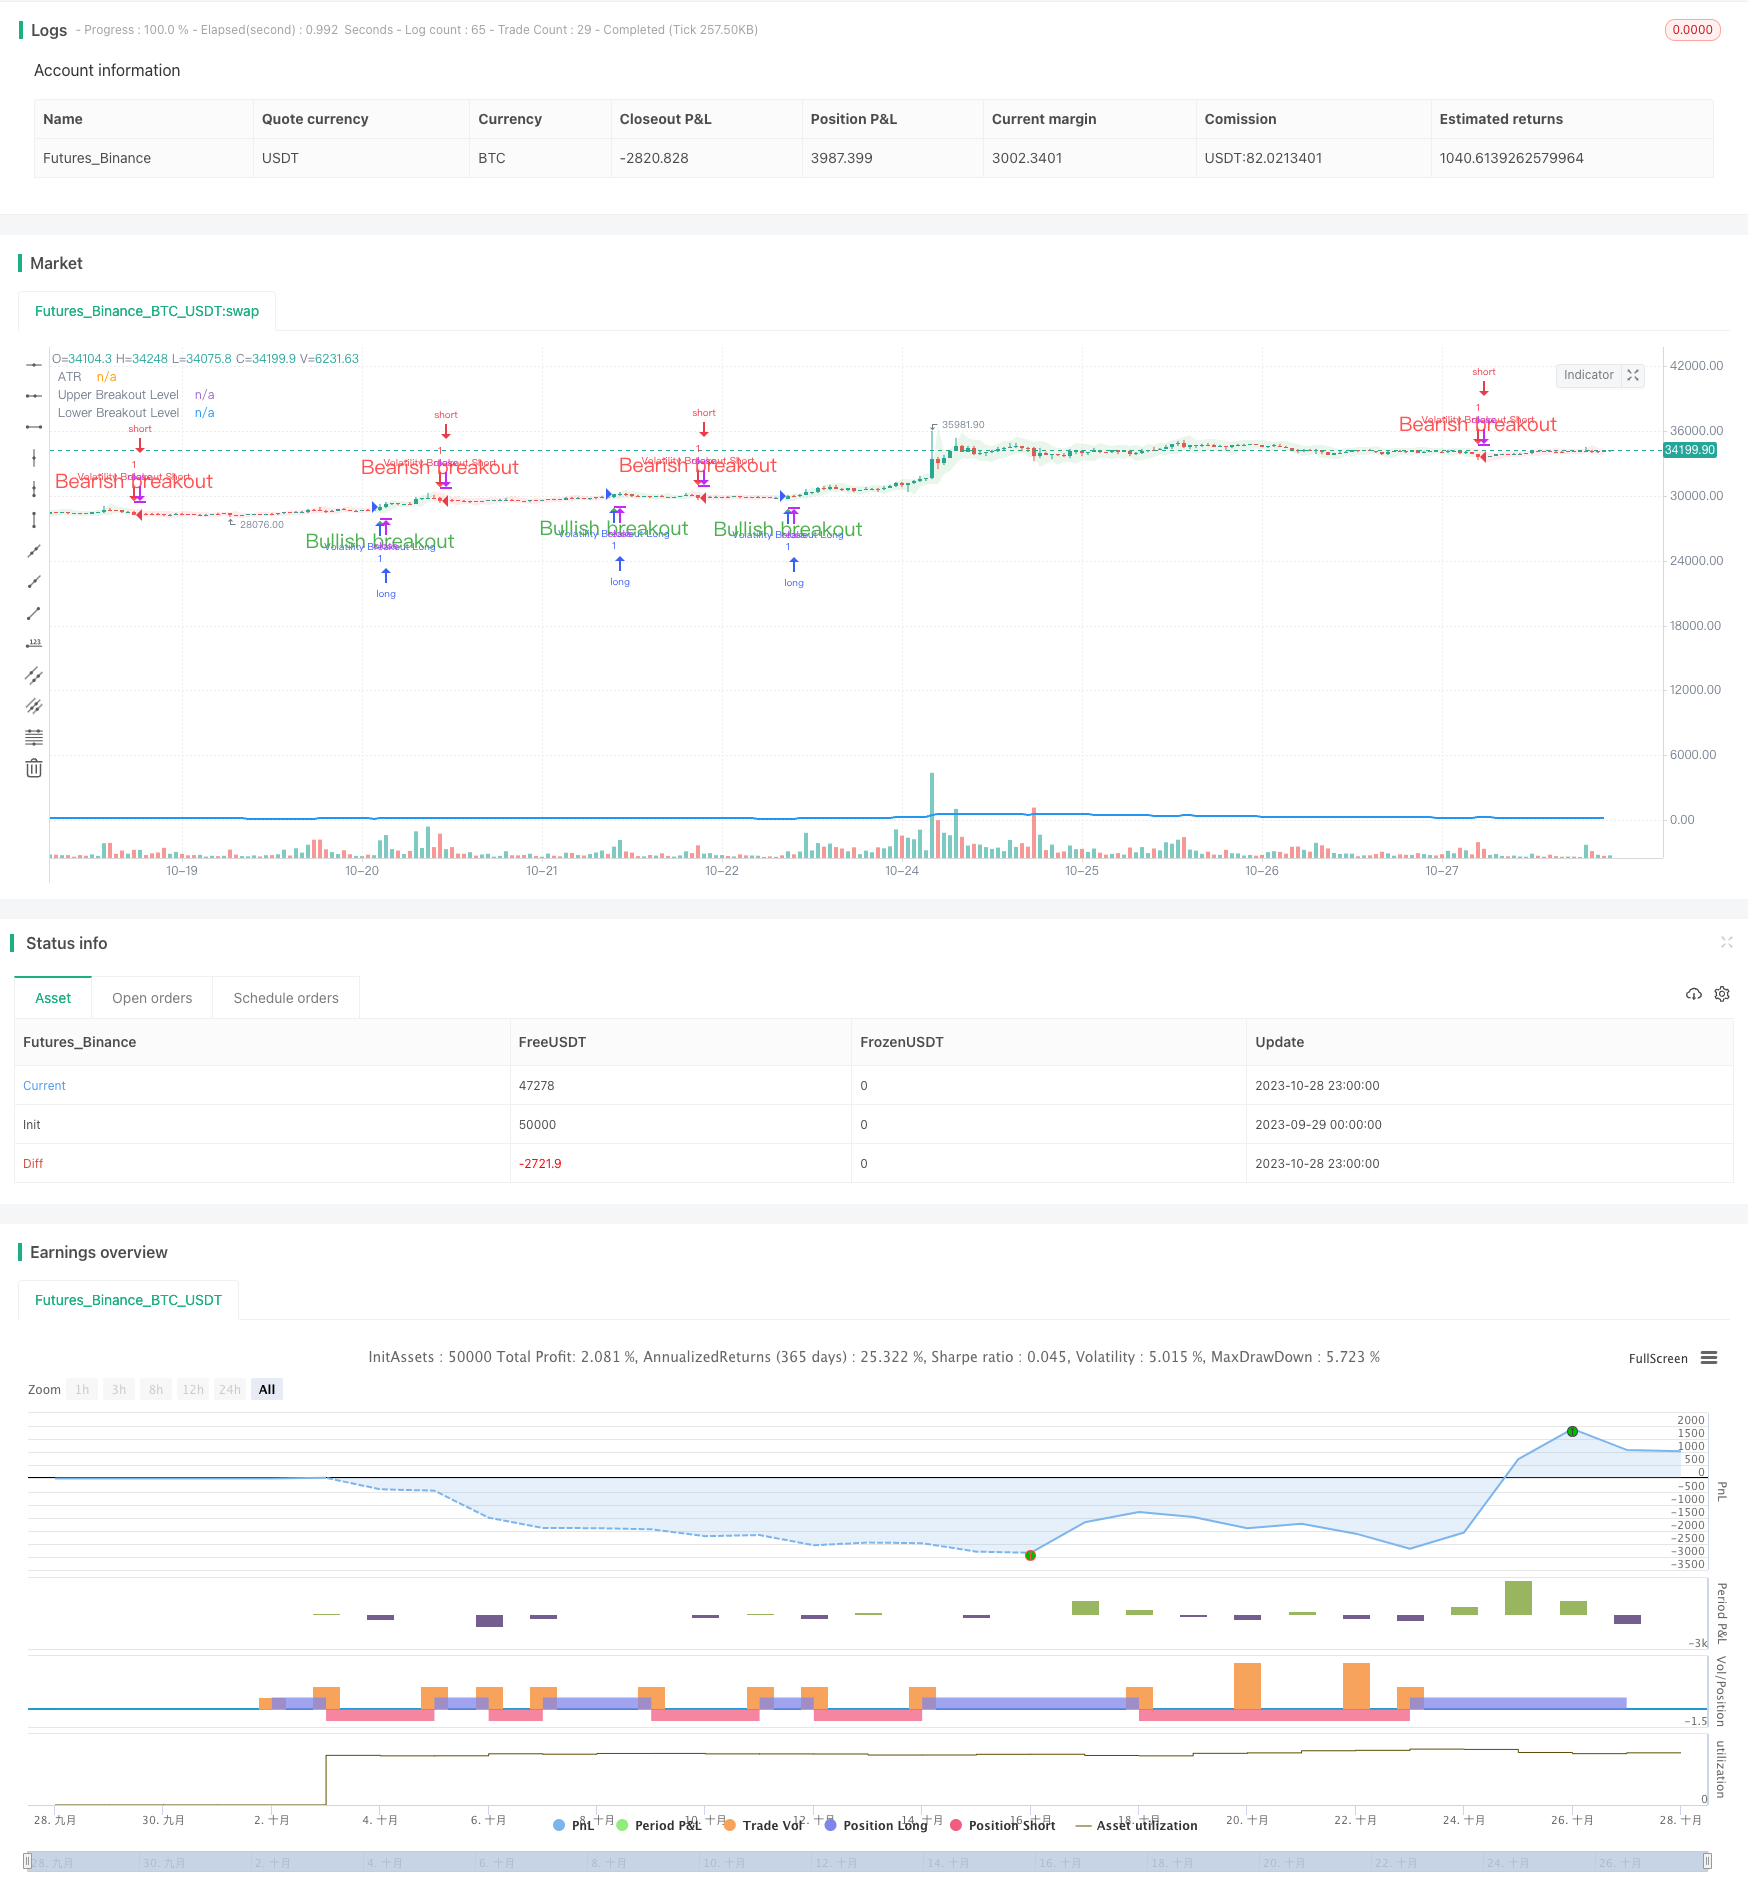
突破交易策略旨在捕捉由市场波动性增加引起的突破价格。该策略利用平均真实波动范围(ATR)指标来测量资产在特定周期内的波动性。当价格突破上下两条由ATR决定的突破线时,产生做多和做空信号。
该策略首先计算指定周期内的ATR。然后根据ATR计算上轨和下轨。当收盘价突破上轨时,产生做多信号;当收盘价跌破下轨时,产生做空信号。为了进一步确认信号,需要当前K线形态实体部分关闭。
收盘价突破上轨和下轨时,在突破方向填充突破间隙颜色。该特征有助于快速识别当前趋势方向。
当做多信号产生且当前无持仓时,策略开仓做多。当做空信号产生且当前无持仓时,策略开仓做空。
Length参数决定测量波动性的周期长度。更高的Length值意味着关注更长的价格波动。例如,Length为20时,每次交易跨越大约100根K线,包含多个波动。
减小Length值可以关注更短期的价格波动,增大交易频率。Length值与平均交易长度之间没有严格对应关系,需要通过试错来找到最佳Length值。
该策略利用突破原理,能抓住市场波动带来的较大行情。ATR指标动态计算突破位,避免使用固定参数。
使用实体K线确认信号,可过滤假突破。填充突破间隙颜色直观显示趋势方向。
Length参数提供调整策略的灵活性,可根据具体市场调整来优化参数。
突破交易存在被套利的风险。可以设置止损来控制单笔损失。
突破信号可能出现误报导致超短线交易。可以适当调整Length参数来滤除误报。
参数优化需要积累足够的交易数据支持。初期参数选择可能不当导致交易表现不佳。
可以在ATR周期内引入布林带,作为新的突破位计算方式。布林带突破可减少误报率。
可以在突破后继续追踪趋势,而不立即止损。例如加入趋势随行止损。
可以考虑在震荡市场使用不同的参数或完全不交易,避免被套。
突破交易策略利用市场波动性,在价格产生较大突破时进入趋势。ATR指标动态确定突破位,实体K线过滤假突破。Length参数提供调整策略周期的灵活性。该策略适合追踪中长线趋势,但需要注意突破交易的风险,并进行参数优化。
||
The Volatility Breakout Trading Strategy aims to capture price breakouts resulting from increased market volatility. The strategy uses the Average True Range (ATR) indicator to measure an asset's volatility over a specified period. Long and short signals are generated when the price breaks out above or below two levels determined by the ATR.
The strategy first calculates the ATR over a chosen period. It then uses the ATR to calculate an upper and lower breakout level. When the closing price breaks above the upper level, a long signal is generated. When the closing price breaks below the lower level, a short signal is generated. To further confirm the signals, the current bar needs to close for its body portion.
When the closing price breaks the upper or lower levels, the breakout zone is filled with a color indicating the breakout direction. This feature helps quickly identify the prevailing trend direction.
When a long signal is generated and there is no current position, the strategy goes long. When a short signal is generated and there is no current position, the strategy goes short.
The Length input determines the period over which volatility is measured. A higher Length value implies focusing on longer price moves. For example, with Length set to 20, each trade spans about 100 bars, capturing multiple swings.
Lowering the Length value allows targeting shorter-term price moves and potentially increasing trade frequency. There is no strict correlation between the Length input and average trade length. Optimal Length values must be found through experimentation.
The strategy capitalizes on breakout principles to catch significant moves arising from market volatility. The ATR indicator dynamically calculates breakout levels instead of using fixed parameters.
Using solid bar closes to confirm signals filters out false breakouts. Filling the breakout zone intuitively shows trend direction.
The Length input provides flexibility to optimize the strategy for specific market conditions.
Breakout trading carries the risk of being stopped out. Stop losses can control loss on individual trades.
Breakout signals may generate false signals leading to over-trading. Length values can be adjusted to filter out false signals.
Parameter optimization requires sufficient trading data. Poor initial parameters can lead to underperformance.
Bollinger Bands can be introduced within the ATR period to calculate new breakout levels. Bollinger breakouts reduce false signals.
Trends can be further tracked after breakouts instead of stopping out immediately. Trailing stops can be incorporated.
Different parameters or avoiding trades altogether can be considered in range-bound markets to prevent whipsaws.
The Volatility Breakout Trading Strategy capitalizes on increased market volatility to enter trending moves when prices break out significantly. The ATR indicator dynamically sets breakout levels and solid bars filter false breakouts. The Length input provides flexibility to adjust the strategy's period. The strategy is suitable for medium to long-term trend following, but breakout risks must be managed through parameter optimization.
[/trans]
Strategy Arguments
| Argument | Default | Description |
|---|---|---|
| v_input_1 | 20 | Length |
Source (PineScript)
/*backtest
start: 2023-09-29 00:00:00
end: 2023-10-29 00:00:00
period: 1h
basePeriod: 15m
exchanges: [{"eid":"Futures_Binance","currency":"BTC_USDT"}]
*/

// This source code is subject to the terms of the Mozilla Public License 2.0 at https://mozilla.org/MPL/2.0/

//@version=5
strategy("Volatility Breakout Strategy [Angel Algo]", overlay = true)

// Inputs
length = input(title="Length", defval=20)

// Calculate the average true range (ATR)
atr = ta.atr(length)

// Plot the ATR on the chart
plot(atr, color=color.blue, linewidth=2, title="ATR")

// Calculate the upper and lower breakouts
upper_breakout = high + atr
lower_breakout = low - atr

// Plot the upper and lower breakouts on the chart
ul = plot(upper_breakout[1], color = color.new(color.green, 100), linewidth=2, title="Upper Breakout Level")
ll = plot(lower_breakout[1], color = color.new(color.red, 100), linewidth=2, title="Lower Breakout Level")

// Create the signals
long_entry = ta.crossover(close, upper_breakout[1]) and barstate.isconfirmed
short_entry = ta.crossunder(close, lower_breakout[1]) and barstate.isconfirmed

active_signal_color =ta.barssince(long_entry) < ta.barssince(short_entry) ?
   color.new(color.green,85) : color.new(color.red,85)

// Plot the signals on the chart
plotshape(long_entry and ta.barssince(long_entry[1]) > ta.barssince(short_entry[1]), location=location.belowbar, style=shape.triangleup,
   color=color.green, size=size.normal, text = "Bullish breakout", textcolor = color.green)
plotshape(short_entry and ta.barssince(long_entry[1]) < ta.barssince(short_entry[1]), location=location.abovebar, style=shape.triangledown,
   color=color.red, size=size.normal,text = "Bearish breakout",  textcolor = color.red)

// Fill the space between the upper and lower levels with the color that indicates the latest signal direction
fill(ul,ll, color=active_signal_color)

long_condition = long_entry and strategy.position_size <= 0 and barstate.isconfirmed
short_condition = short_entry and strategy.position_size >= 0 and barstate.isconfirmed

if long_condition
    strategy.entry("Volatility Breakout Long", strategy.long)


if short_condition
    strategy.entry("Volatility Breakout Short", strategy.short)
Detail
https://www.fmz.com/strategy/430592
Last Modified
2023-10-30 16:58:03
