Name
突破均线交易策略Momentum-Breakout-Moving-Average-Trading-Strategy
Author
ChaoZhang
Strategy Description
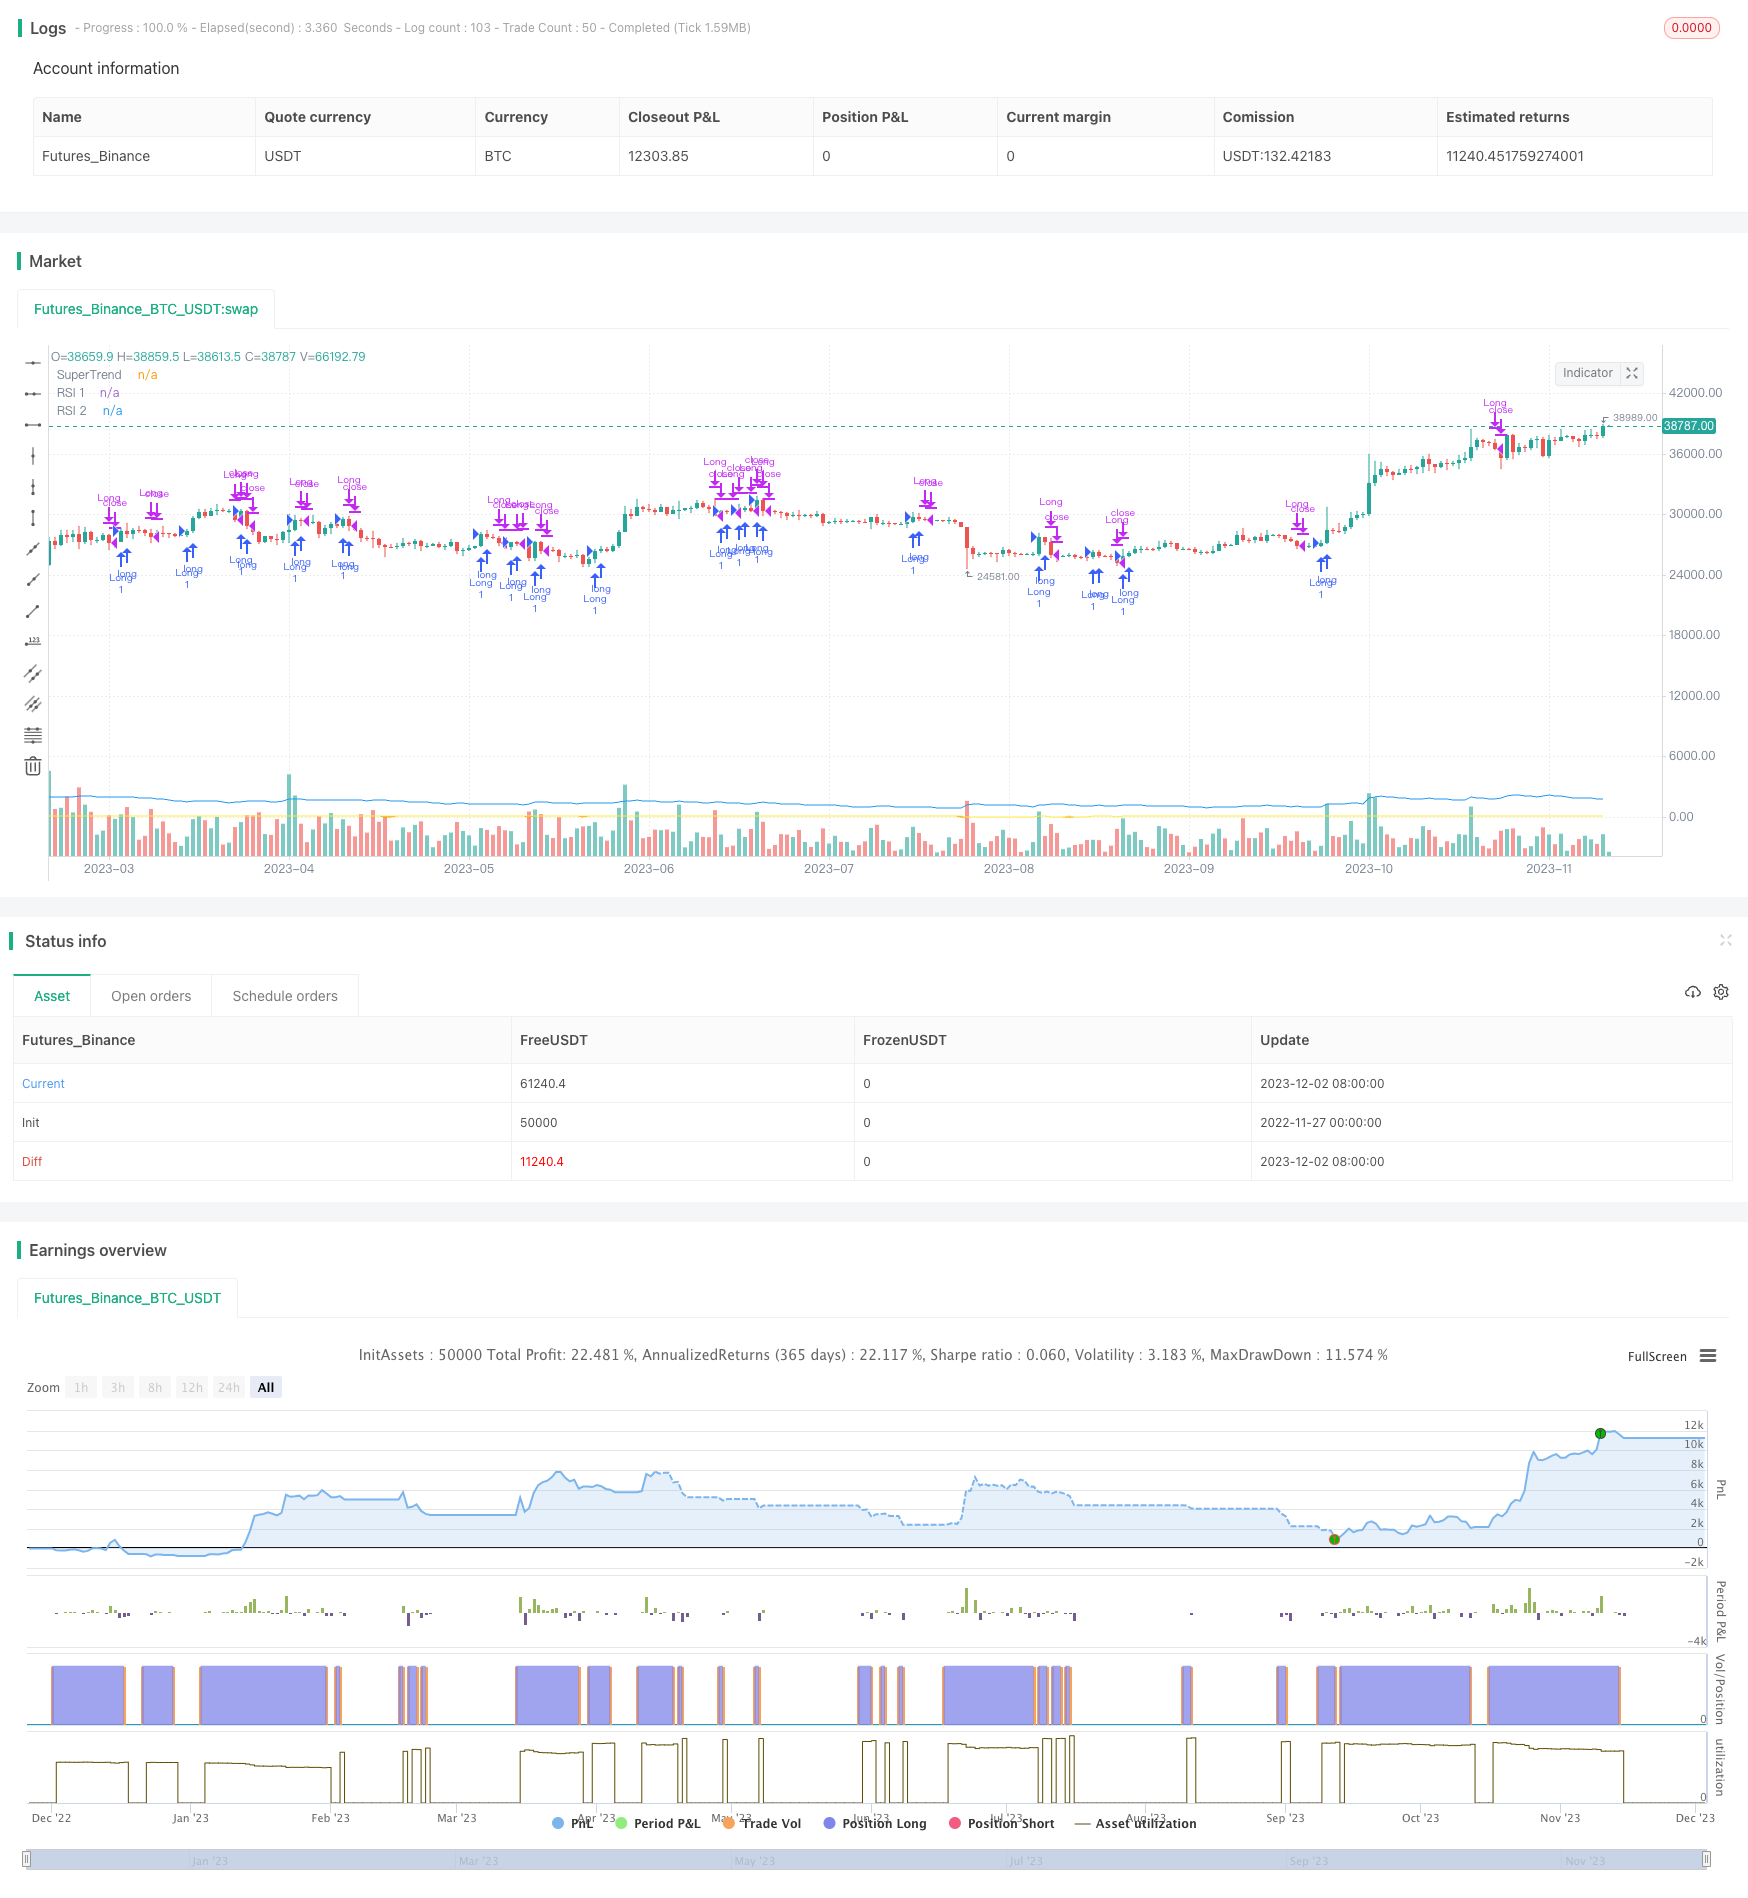
本策略综合运用了相对强弱指数(RSI)、超级趋势线(SuperTrend)和平均真实波动幅度(ATR)三个指标,构建了一个全面且实用的量化交易策略。
RSI是一个强大的震荡指标,通过测量价格变动的速度和力度来判断市场是超买还是超卖。当RSI低于超卖区域时为超卖信号,反之当高于超买区域时为超买信号。
SuperTrend是一种趋势跟踪指标,可用于识别当前的趋势方向。当价格高于SuperTrend线时,表示处于上升趋势;当价格低于SuperTrend线时,表示下降趋势。
ATR用于测量市场波动程度和风险水平。ATR越高表示市场越剧烈,反之则相对平稳。本策略利用ATR来设置止损位和盈亏比。
做多信号: 当快线RSI低于慢线RSI,同时价格高于SuperTrend线时,做多;
做空信号: 当快线RSI高于慢线RSI,同时价格低于SuperTrend线时,做空;
止损退出: 持有多单时,如果快线RSI高于慢线RSI或价格低于SuperTrend线则止损退出做多单;持有空单时,如果快线RSI低于慢线RSI或价格高于SuperTrend线则止损退出做空单。
-
趋势追踪:SuperTrend可清晰识别趋势方向;
-
动量确认:RSI可确保交易符合当前市场情绪;
-
波动自适应:基于ATR的止损可动态调整,适应市场变化。
-
趋势错配风险:概率出现SuperTrend与实际趋势方向不符时,将产生损失。可通过参数优化降低错误率。
-
止损被启发风险:止损过于接近可能被击破,应合理设置止损距离。
-
参数不当风险:RSI参数设置不当将影响交易时机选择。应充分回测确定合适参数。
-
结合其他指标过滤信号,提高系统稳定性;
-
基于最大回撤优化RSI参数组合;
-
利用启发式算法搜索最优SuperTrend参数。
本策略整合趋势、动量和波动率指标,构建了一个交易信号清晰、参数设置灵活、风险控制到位的量化交易策略。通过持续的测试和优化,可望获得稳定的超额收益。
||
This strategy integrates Relative Strength Index (RSI), SuperTrend indicator and Average True Range (ATR) to construct a comprehensive and practical quantitative trading strategy.
RSI is a powerful oscillating indicator that judges if the market is overbought or oversold by measuring the velocity and magnitude of price movements. RSI below oversold region indicates oversold signal, while RSI above overbought region is overbought signal.
SuperTrend is a trend following indicator that helps identify current trend direction. Price above SuperTrend line indicates an uptrend while price below SuperTrend line an downtrend.
ATR measures the degree of market volatility and risk level. Higher ATR represents higher market volatility while lower means relatively calm. This strategy leverages ATR to set stop loss and profit target.
Long Signal: When fast RSI crosses below slow RSI while price is above SuperTrend line to go long.
Short Signal: When fast RSI crosses above slow RSI while price is below SuperTrend line to go short.
Exit Rule: If holding long position, exit when fast RSI crosses above slow RSI OR price falls below SuperTrend line. If holding short position, exit when fast RSI crosses below slow RSI OR price rises above SuperTrend line.
-
Trend Following: SuperTrend identifies trend clearly.
-
Momentum Confirmation: RSI ensures trades align with market sentiment.
-
Volatility Adaptive: ATR-driven stop loss adapts to varying market conditions.
-
Trend Misalignment Risk: Probability of conflicts between SuperTrend and actual trend direction resulting losses. Parameter optimization helps to improve accuracy.
-
Premature Stop Loss Risk: Stop loss too close may get hit unintentionally. Reasonable stop distance should be set.
-
Parameter Risk: Improper RSI parameters setting affects timing of entries and exits. Careful backtests required to determine proper parameters.
-
Add other technical indicators to filter signals improving system stability.
-
Optimize RSI parameters based on maximum drawdown constraints.
-
Leverage heuristic algorithms to search optimal SuperTrend parameters.
This strategy integrates trend, momentum and volatility indicators constructing a quantitative model with clear signals, flexible parameter tuning, and sound risk control. With continuous testing and enhancement, it is promising to achieve steady above-average returns over the long run.
[/trans]
Strategy Arguments
| Argument | Default | Description |
|---|---|---|
| v_input_1 | 14 | RSI Length 1 |
| v_input_2 | 21 | RSI Length 2 |
| v_input_3 | 1.5 | SuperTrend Multiplier |
Source (PineScript)
/*backtest
start: 2022-11-27 00:00:00
end: 2023-12-03 00:00:00
period: 1d
basePeriod: 1h
exchanges: [{"eid":"Futures_Binance","currency":"BTC_USDT"}]
*/

//@version=5
strategy("RSI, SuperTrend, and ATR Strategy", overlay=true)

// Define input parameters
rsiLength1 = input(14, title="RSI Length 1")
rsiLength2 = input(21, title="RSI Length 2")
supertrendMultiplier = input(1.5, title="SuperTrend Multiplier")

// Calculate indicators
rsi1 = ta.rsi(close, rsiLength1)
rsi2 = ta.rsi(close, rsiLength2)
supertrend = ta.atr(14) * supertrendMultiplier

// Define trading conditions
rsiLongCondition = rsi1 > rsi2
rsiShortCondition = rsi1 < rsi2
supertrendLongCondition = close > supertrend
supertrendShortCondition = close < supertrend

// Execute trades
if (rsiLongCondition and supertrendLongCondition)
    strategy.entry("Long", strategy.long)

if (rsiShortCondition and supertrendShortCondition)
    strategy.entry("Short", strategy.short)

if (strategy.position_size > 0 and (rsiShortCondition or supertrendShortCondition))
    strategy.close("Long")

if (strategy.position_size < 0 and (rsiLongCondition or supertrendLongCondition))
    strategy.close("Short")

// Plot indicators on the chart
plot(rsi1, color=color.orange, title="RSI 1")
plot(rsi2, color=color.yellow, title="RSI 2")
plot(supertrend, color=color.blue, title="SuperTrend")
Detail
https://www.fmz.com/strategy/434187
Last Modified
2023-12-04 15:57:06
