Name
简单趋势跟随策略Simple-Trend-Following-Strategy
Author
ChaoZhang
Strategy Description

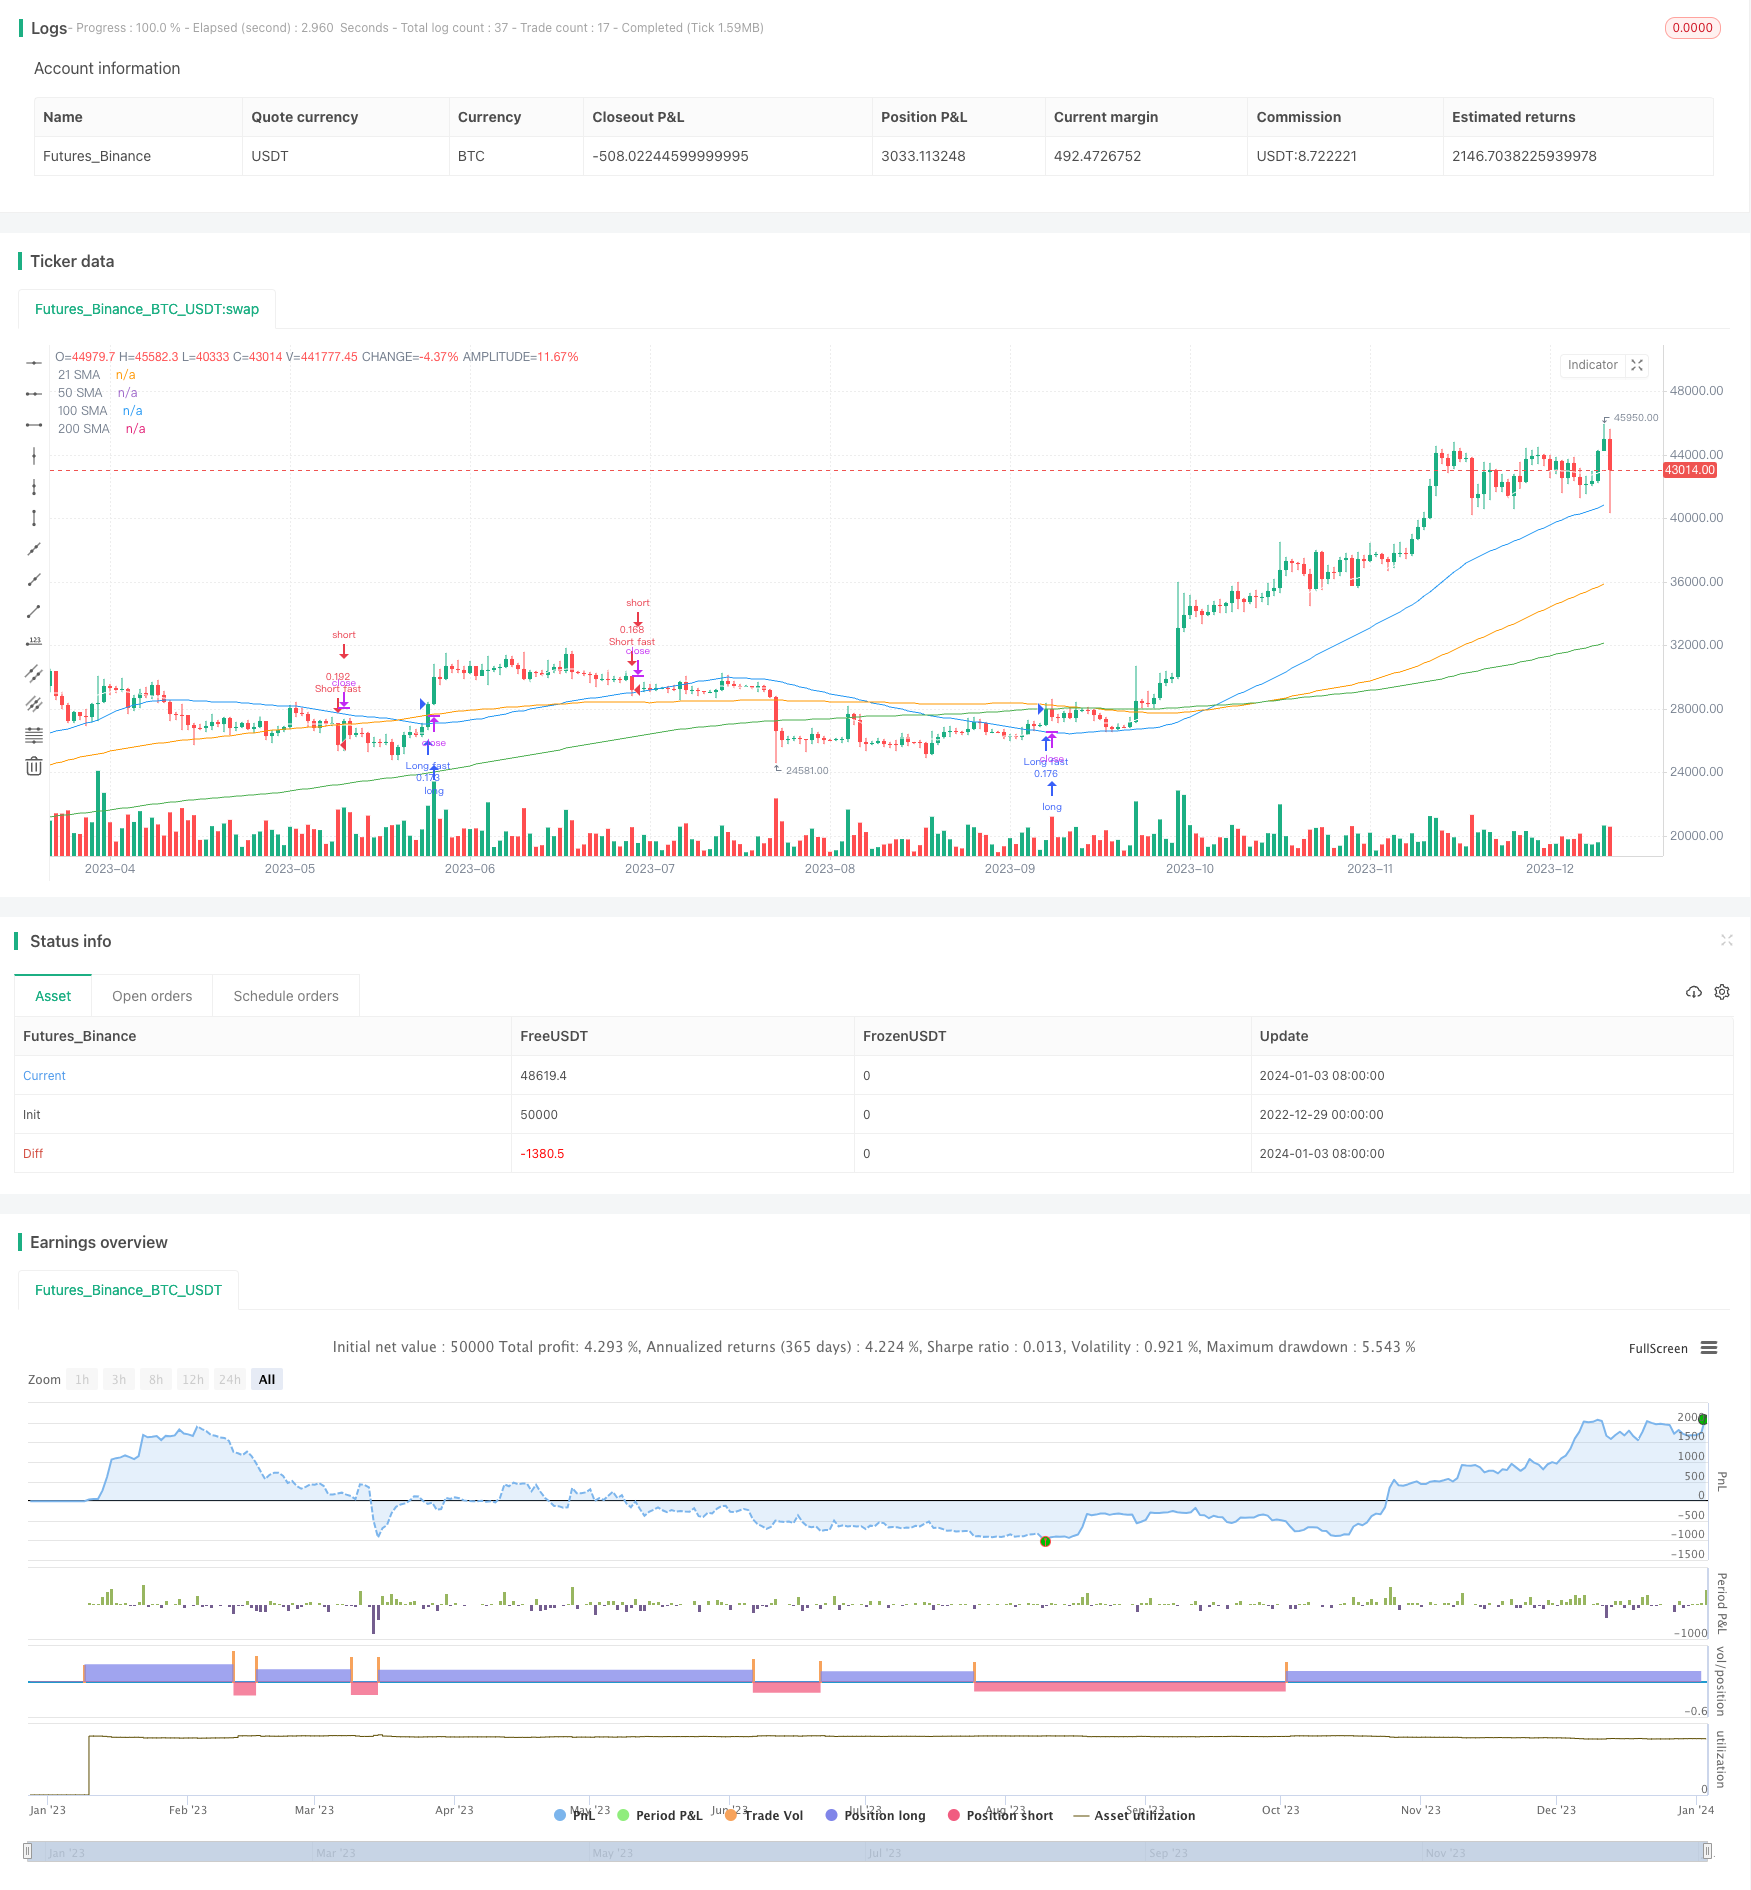
该策略同时使用 21 日、50 日、100 日和 200 日的简单移动平均线。当价格突破这些均线时产生买入和卖出信号。此外,策略还利用Donchian通道,在价格突破 20 日和 55 日的最高价或最低价时补充产生交易信号。该策略适合趋势较明显的市场,通过多个时间框架锁定趋势获利。
核心原理是使用多个均线时间框架判断趋势方向。具体来说,策略运用 4 条不同时间长度的简单移动平均线:21 日线、50 日线、100 日线和 200 日线。这些均线的时间跨度从短期到长期不断放大,用于识别不同级别的趋势。
当短期均线上穿长期均线时产生买入信号。这表示市场趋势可能发生转折,进入上升通道。而当短期均线下穿长期均线时,产生卖出信号。这标志着市场趋势可能开始反转,进入下行通道。
此外,策略还利用 Donchian 通道补充交易信号。也就是当价格突破 20 日或 55 日的最高价/最低价时,也会触发买入/卖出信号,锁定趋势利润。
综上,该策略同时结合均线理论和Donchian通道,通过多时间框架判断趋势方向,属于典型的趋势跟随策略。
- 多时间框架设计,可以有效捕捉中长线明确趋势
- 同时使用均线和Donchian通道,信号较为可靠
- 实现简单,适合量化交易初学者实践
- 虚假突破风险。价格可能出现一段时间的剧烈波动,导致均线或Donchian通道发出错误信号
- 震荡行情下容易止损。该策略更适合明确趋势的市场环境
- 参数优化空间有限。移动平均线和Donchian通道难以进行有效参数调整
对应风险的解决方案:
- 增加过滤条件,避免虚假突破。例如增加交易量条件
- 适当缩短止损幅度,应对震荡行情
- 尝试引入机器学习算法自动优化参数
- 增加基于交易量的过滤条件,避免在价格剧烈波动中产生错误信号
- 尝试将移动平均线替换为能更好平滑价格的指标,如Kaufman自适应移动平均线
- 应用机器学习算法自动优化策略参数,使之更好适应当前市场情况
- 结合波动率指标判断趋势强弱,避免在震荡行情中被套利
本文详细解析了一个基于多时间框架移动平均线和Donchian通道的简单趋势跟随策略。该策略运用不同长度均线组合判断趋势方向,原理简单清晰,容易实现。与此同时,也分析了策略的优势、可能存在的风险和后续的优化思路。通过深入理解和适当优化,相信该策略可以成为量化交易的有利工具。
||
This article will analyze in detail a trend following strategy based on simple moving averages. The strategy generates trading signals using a combination of moving averages of different timeframes, belonging to a typical trend following strategy.
The strategy uses 21-day, 50-day, 100-day and 200-day simple moving averages simultaneously. It generates buy and sell signals when price breaks through these moving averages. In addition, the strategy also uses the Donchian Channel to supplement trading signals when price breaks through the 20-day or 55-day highest/lowest price. This strategy is suitable for markets with obvious trends, locking in trend profits through multiple time frames.
The core principle is to use multiple moving average time frames to determine the trend direction. Specifically, the strategy utilizes 4 simple moving averages with different time spans: 21-day, 50-day, 100-day and 200-day. The time spans of these moving averages expand gradually from short-term to long-term, used to identify trends at different levels.
When the short-term moving average crosses above the long-term one, a buy signal is generated. This indicates the market trend may have reversed and entered an uptrend. When the short-term moving average crosses below the long-term one, a sell signal is generated. This signifies the market trend may have started to reverse and enter a downtrend.
In addition, the strategy also uses the Donchian Channel to supplement trading signals. That is, when the price breaks through the 20-day or 55-day highest/lowest price, buy/sell signals will also be triggered to lock in trend profits.
In summary, the strategy combines moving average theory and Donchian Channel through multiple time frames to determine the trend direction, belonging to a typical trend following strategy.
- Multi-timeframe design can effectively capture medium and long-term trends
- Use of both moving averages and Donchian Channel makes signals more reliable
- Simple to implement, suitable for beginners to practice quantitative trading
- Risk of false breakout. Prices may fluctuate violently for a period of time, causing incorrect signals from moving averages or Donchian Channel
- Easy to stop loss in rangy markets. The strategy is more suitable for markets with obvious trends
- Limited room for parameter optimization. It’s difficult to effectively tune parameters of moving averages and Donchian Channel
Solutions to the risks:
- Add filter conditions to avoid false breakouts, such as adding volume condition
- Appropriately reduce stop loss range to cope with rangy market
- Try introducing machine learning algorithms to auto-optimize parameters
- Add volume-based filters to avoid wrong signals during violent price fluctuations
- Try replacing moving averages with indicators that can smooth prices better, such as Kaufman's Adaptive Moving Average
- Apply machine learning algorithms to auto-optimize parameters for better adaptation to current market conditions
- Incorporate volatility indicators to gauge trend strength, avoiding being trapped in rangy markets
This article has analyzed in detail a simple trend following strategy based on multi-timeframe moving averages and Donchian Channel. The strategy determines trend direction using different length moving averages, with simple and clear principles that are easy to implement. At the same time, the advantages, potential risks and future optimization ideas are also discussed. With in-depth understanding and proper optimization, I believe this strategy can become a useful tool for quantitative trading. [/trans]
Strategy Arguments
| Argument | Default | Description |
|---|---|---|
| v_input_1 | true | Max Intraday Loss(%) |
| v_input_2 | 21 | 21 SMA |
| v_input_3_close | 0 | 21 SMA: close |
| v_input_4 | 50 | 50 SMA |
| v_input_5_close | 0 | 50 SMA: close |
| v_input_6 | 100 | 100 SMA |
| v_input_7_close | 0 | 100 SMA: close |
| v_input_8 | 200 | 200 SMA |
| v_input_9_close | 0 | 200 SMA: close |
Source (PineScript)
/*backtest
start: 2022-12-29 00:00:00
end: 2024-01-04 00:00:00
period: 1d
basePeriod: 1h
exchanges: [{"eid":"Futures_Binance","currency":"BTC_USDT"}]
*/

//@version=3
strategy("Trend Following", overlay=true, default_qty_type = strategy.percent_of_equity, default_qty_value = 10)

maxIdLossPcnt = input(1, "Max Intraday Loss(%)", type=float)
entryLong = false
entryShort = false

// strategy.risk.max_intraday_loss(maxIdLossPcnt, strategy.percent_of_equity)

if (close > highest(high[1], 20))
    strategy.entry("Long fast", strategy.long)
    entryLong = true


if (close < lowest(low[1], 20))
    strategy.entry("Short fast", strategy.short)
    entryShort = true

if (close > highest(high[1], 55))
    strategy.entry("Long slow", strategy.long)
    entryLong = true

if (close < lowest(low[1], 55))
    strategy.entry("Short slow", strategy.short)
    entryShort = true

len1 = input(21, minval=1, title="21 SMA")
src1 = input(close, title="21 SMA")
out1 = sma(src1, len1)
plot(out1, title="21 SMA", color= white)

len2 = input(50, minval=1, title="50 SMA")
src2 = input(close, title="50 SMA")
out2 = sma(src2, len2)
plot(out2, title="50 SMA", color= blue)

len3 = input(100, minval=1, title="100 SMA")
src3 = input(close, title="100 SMA")
out3 = sma(src3, len3)
plot(out3, title="100 SMA", color= orange)

len4 = input(200, minval=1, title="200 SMA")
src4 = input(close, title="200 SMA")
out4 = sma(src4, len4)
plot(out4, title="200 SMA", color= green)
Detail
https://www.fmz.com/strategy/437753
Last Modified
2024-01-05 13:09:37