Name
简易枢轴反转量化交易策略Simple-Pivot-Reversal-Algorithmic-Trading-Strategy
Author
ChaoZhang
Strategy Description
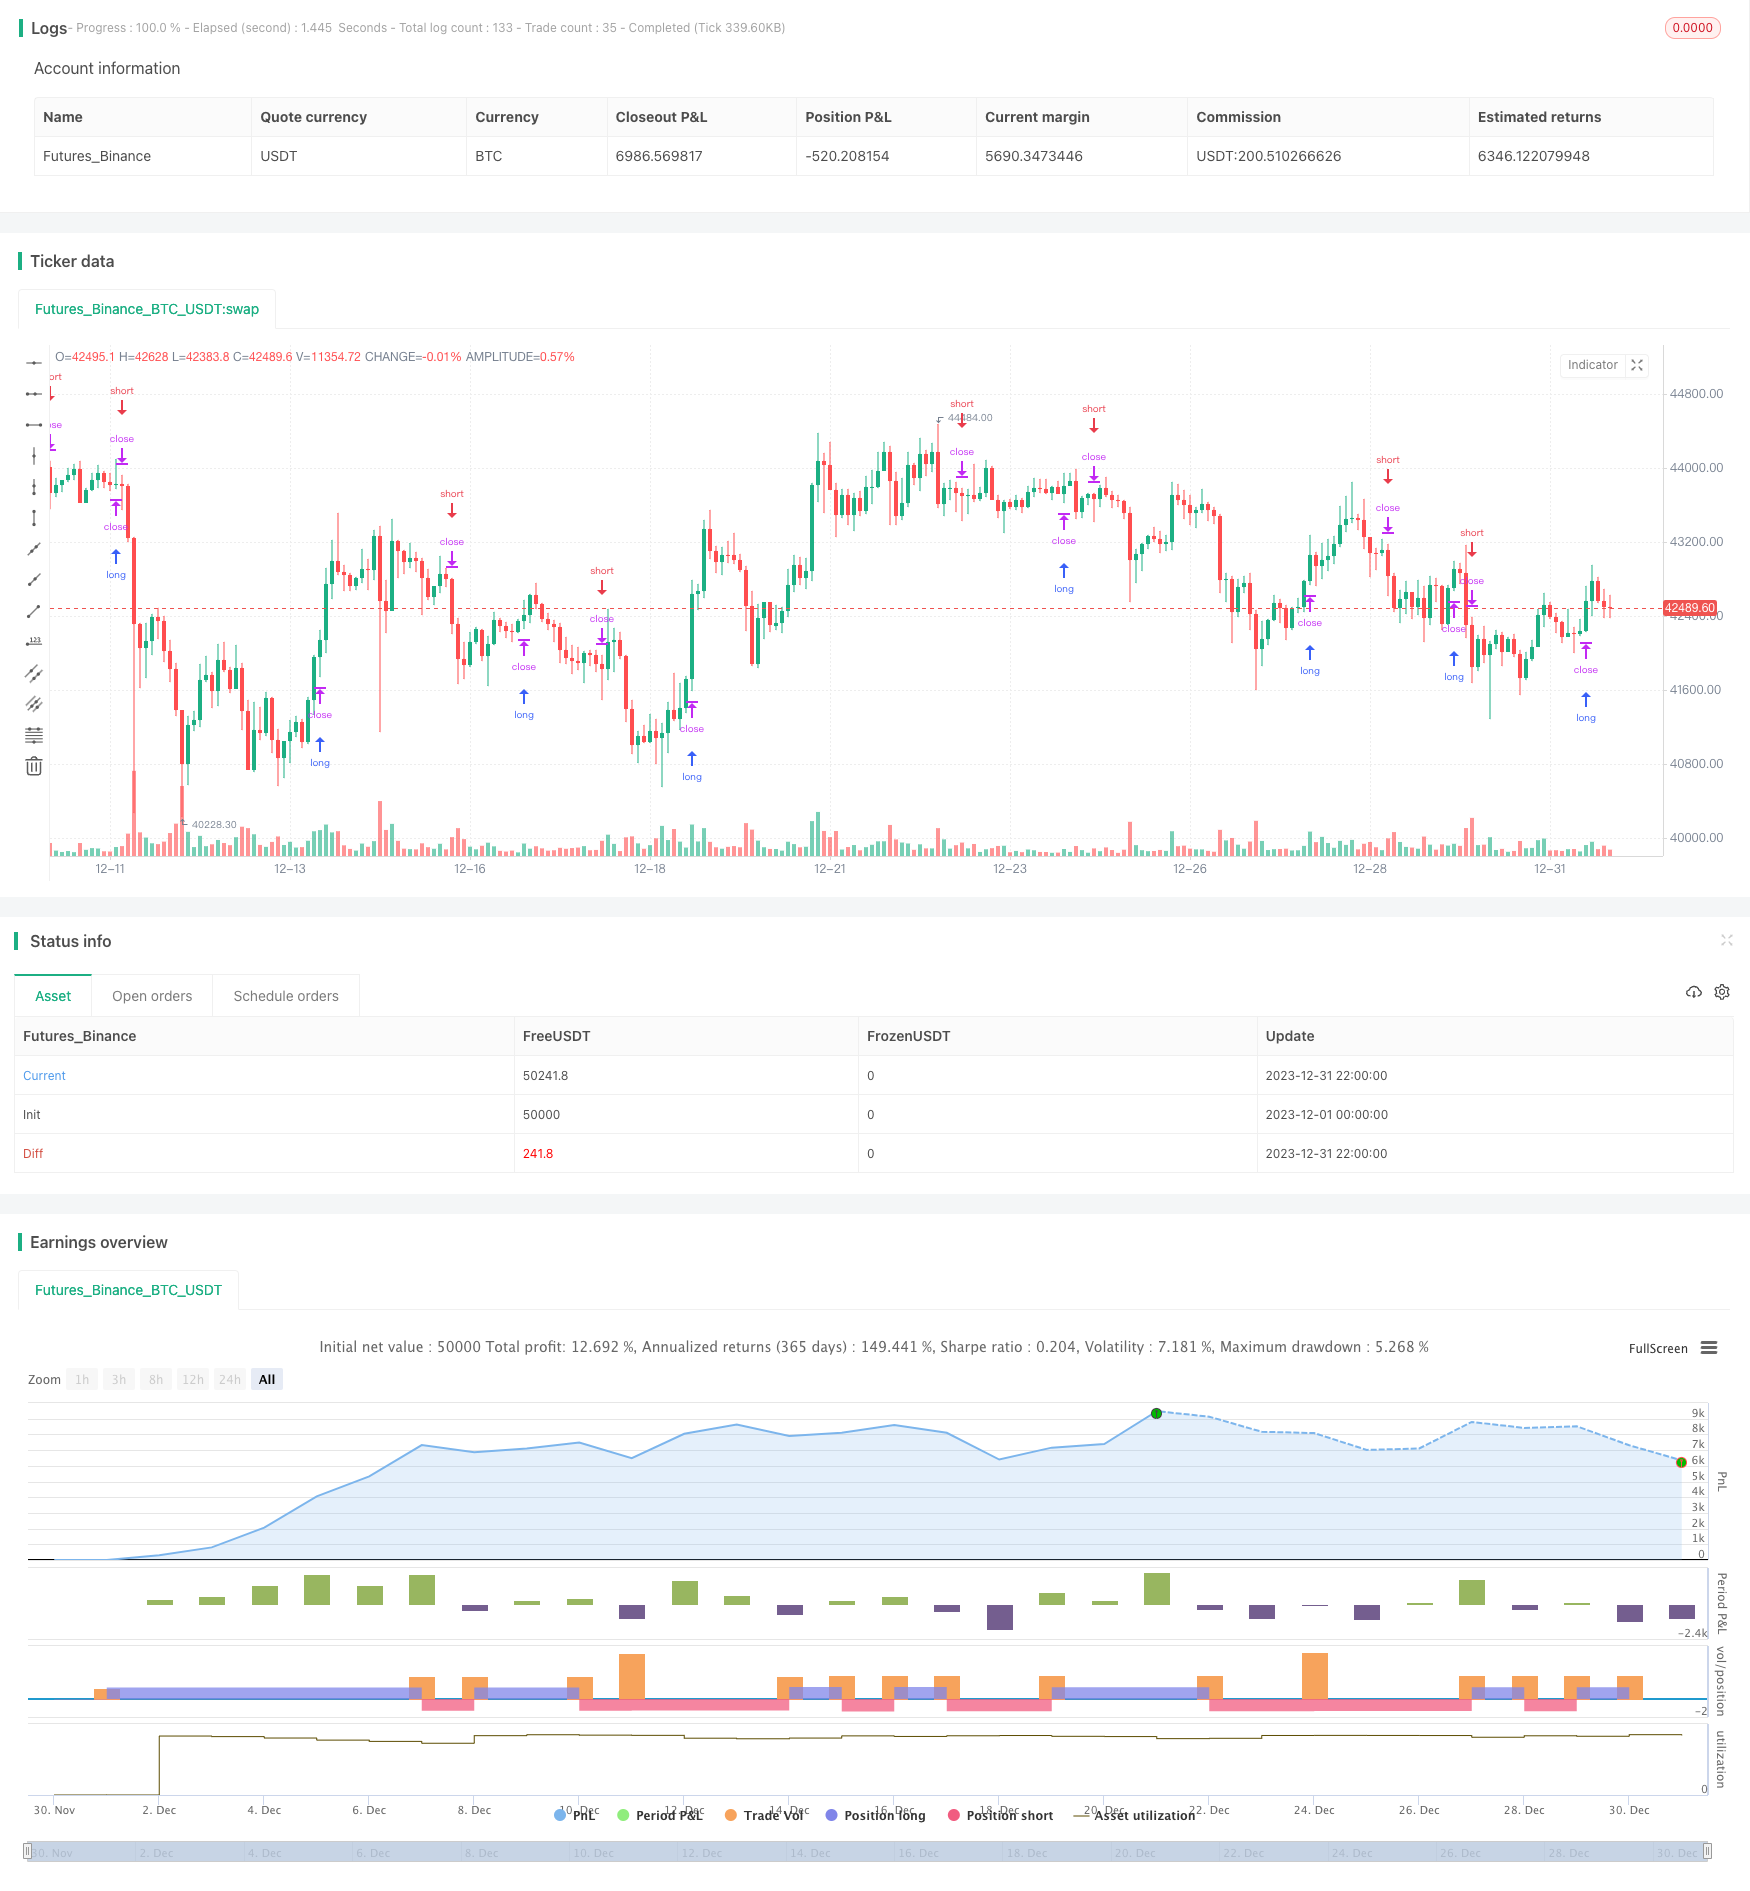
本策略基于枢轴点的突破来进行反转交易。它会计算指定周期的最高价和最低价,以此确定枢轴高点和枢轴低点。当价格超过枢轴高点时,做空;当价格低于枢轴低点时,做多。这是一个典型的短线反转策略。
该策略的核心逻辑是计算枢轴高点和枢轴低点。枢轴高低点的计算公式如下:
枢轴高点 = 最近N1根K线的最高价之和 / N1
枢轴低点 = 最近N2根K线的最低价之和 / N2
其中N1和N2是可以设置的两个参数,代表计算枢轴点所需要的K线数量。
计算出枢轴高低点后,策略就可以进行交易了。具体交易规则是:
- 当价格上穿枢轴高点时,做空仓位
- 当价格下破枢轴低点时,做多仓位
- 持仓后设置止损位
这样,它就实现了一个基于枢轴点突破的短线反转策略。
这是一个非常简单的反转策略,具有如下优势:
- 原理简单,容易理解和实现
- 适合短线频繁交易
- 可以捕捉突破枢轴后的反转行情
- 可以通过调整参数进行优化
该策略也存在一些风险:
- 反转失败的风险。枢轴点突破后的反转不一定会成功,存在继续原趋势运行的可能。
- 止损被击破的风险。设置的止损价格可能会被突破,造成较大损失。
- 参数不当带来的风险。如果参数设置不当,将严重影响策略效果。
可以通过调整参数、设置离场策略等方法来控制这些风险。
该策略还有很大的优化空间:
- 结合其他技术指标,确定更准确的入场时机
- 增加离场条件,例如移动止损、盈利后止损等
- 动态调整参数,让策略更具有适应性
- 优化参数,找到最佳的参数组合
本策略是一个非常简单的短线枢轴反转策略。它的优点是简单易理解,适合频繁交易,可以捕捉反转行情。但也存在一定的风险,需要进一步优化以减少风险。总体来说,这是一个非常适合新手练习的策略,也为高级策略奠定了基础。
||
This strategy performs reversal trading based on pivot point breakouts. It calculates the pivot high and pivot low over a specified period to determine the pivot levels. It goes short when the price breaks above the pivot high, and goes long when the price breaks below the pivot low. This is a typical short-term mean reversion strategy.
The core logic of this strategy is to calculate the pivot high and low points. The formulas are:
Pivot High = Sum of highest high over the past N1 bars / N1
Pivot Low = Sum of lowest low over the past N2 bars / N2
Where N1 and N2 are parameters that define the number of bars used to calculate the pivot points.
After obtaining the pivot high/low levels, the trading rules are:
- Short when price breaks above pivot high
- Long when price breaks below pivot low
- Set stop loss after entry
So it realizes a short-term reversal strategy based on pivot point breakouts.
The advantages of this simple strategy are:
- Simple logic, easy to understand and implement
- Suitable for high-frequency short-term trading
- Captures reversal after pivot breakouts
- Optimizable through parameter tuning
There are some risks:
- Failed reversal risk - The reversal after pivot breakout may fail and the trend continues
- Stop loss risk - The preset stop loss could be hit resulting in big loss
- Parameter risk - Inappropriate parameters greatly impacts results
These risks can be managed by parameter tuning, applying exit rules etc.
There is large room for optimization:
- Combine with other technical indicators to improve entry timing
- Add exit rules like trailing stop loss, profit-taking etc
- Dynamic adjustment of parameters to improve adaptiveness
- Parameter optimization to find the best parameter combinations
In summary, this is a very simple short-term pivot reversal strategy. Its advantages are simplicity and ability to capture reversals. But there are some risks that need to be addressed through optimization. Overall this serves as a good practice strategy for beginners and builds foundation for advanced strategies.
[/trans]
Strategy Arguments
| Argument | Default | Description |
|---|---|---|
| v_input_1 | 4 | leftBars |
| v_input_2 | 2 | rightBars |
| v_input_3 | true | From Day |
| v_input_4 | true | From Month |
| v_input_5 | 2018 | From Year |
| v_input_6 | true | To Day |
| v_input_7 | true | To Month |
| v_input_8 | 9999 | To Year |
Source (PineScript)
/*backtest
start: 2023-12-01 00:00:00
end: 2023-12-31 23:59:59
period: 2h
basePeriod: 15m
exchanges: [{"eid":"Futures_Binance","currency":"BTC_USDT"}]
*/

//@version=4
strategy("Pivot Reversal Strategy - FIGS & DATES 2.0", overlay=true, pyramiding=0, initial_capital=10000, currency="USD", default_qty_type=strategy.percent_of_equity, default_qty_value=100.0, commission_value=0.075)

leftBars = input(4)
rightBars = input(2)

// backtesting date range
from_day = input(defval=1, title="From Day", minval=1, maxval=31)
from_month = input(defval=1, title="From Month", minval=1, maxval=12)
from_year = input(defval=2018, title="From Year", minval=1900)

to_day = input(defval=1, title="To Day", minval=1, maxval=31)
to_month = input(defval=1, title="To Month", minval=1, maxval=12)
to_year = input(defval=9999, title="To Year", minval=1900)

time_cond = true

swh = pivothigh(leftBars, rightBars)
swl = pivotlow(leftBars, rightBars)

middle = (swh+swl)/2

swh_cond = not na(swh)


hprice = 0.0
hprice := swh_cond ? swh : hprice[1]

le = false
le := swh_cond ? true : le[1] and high > hprice ? false : le[1]

if le and time_cond
    strategy.entry("LONG", strategy.long, comment="LONG", stop=hprice + syminfo.mintick)

swl_cond = not na(swl)

lprice = 0.0
lprice := swl_cond ? swl : lprice[1]


se = false
se := swl_cond ? true : se[1] and low < lprice ? false : se[1]

if se and time_cond
    strategy.entry("SHORT", strategy.short, comment="SHORT", stop=lprice - syminfo.mintick)

//plot(strategy.equity, title="equity", color=red, linewidth=2, style=areabr)
Detail
https://www.fmz.com/strategy/439078
Last Modified
2024-01-17 15:37:33
