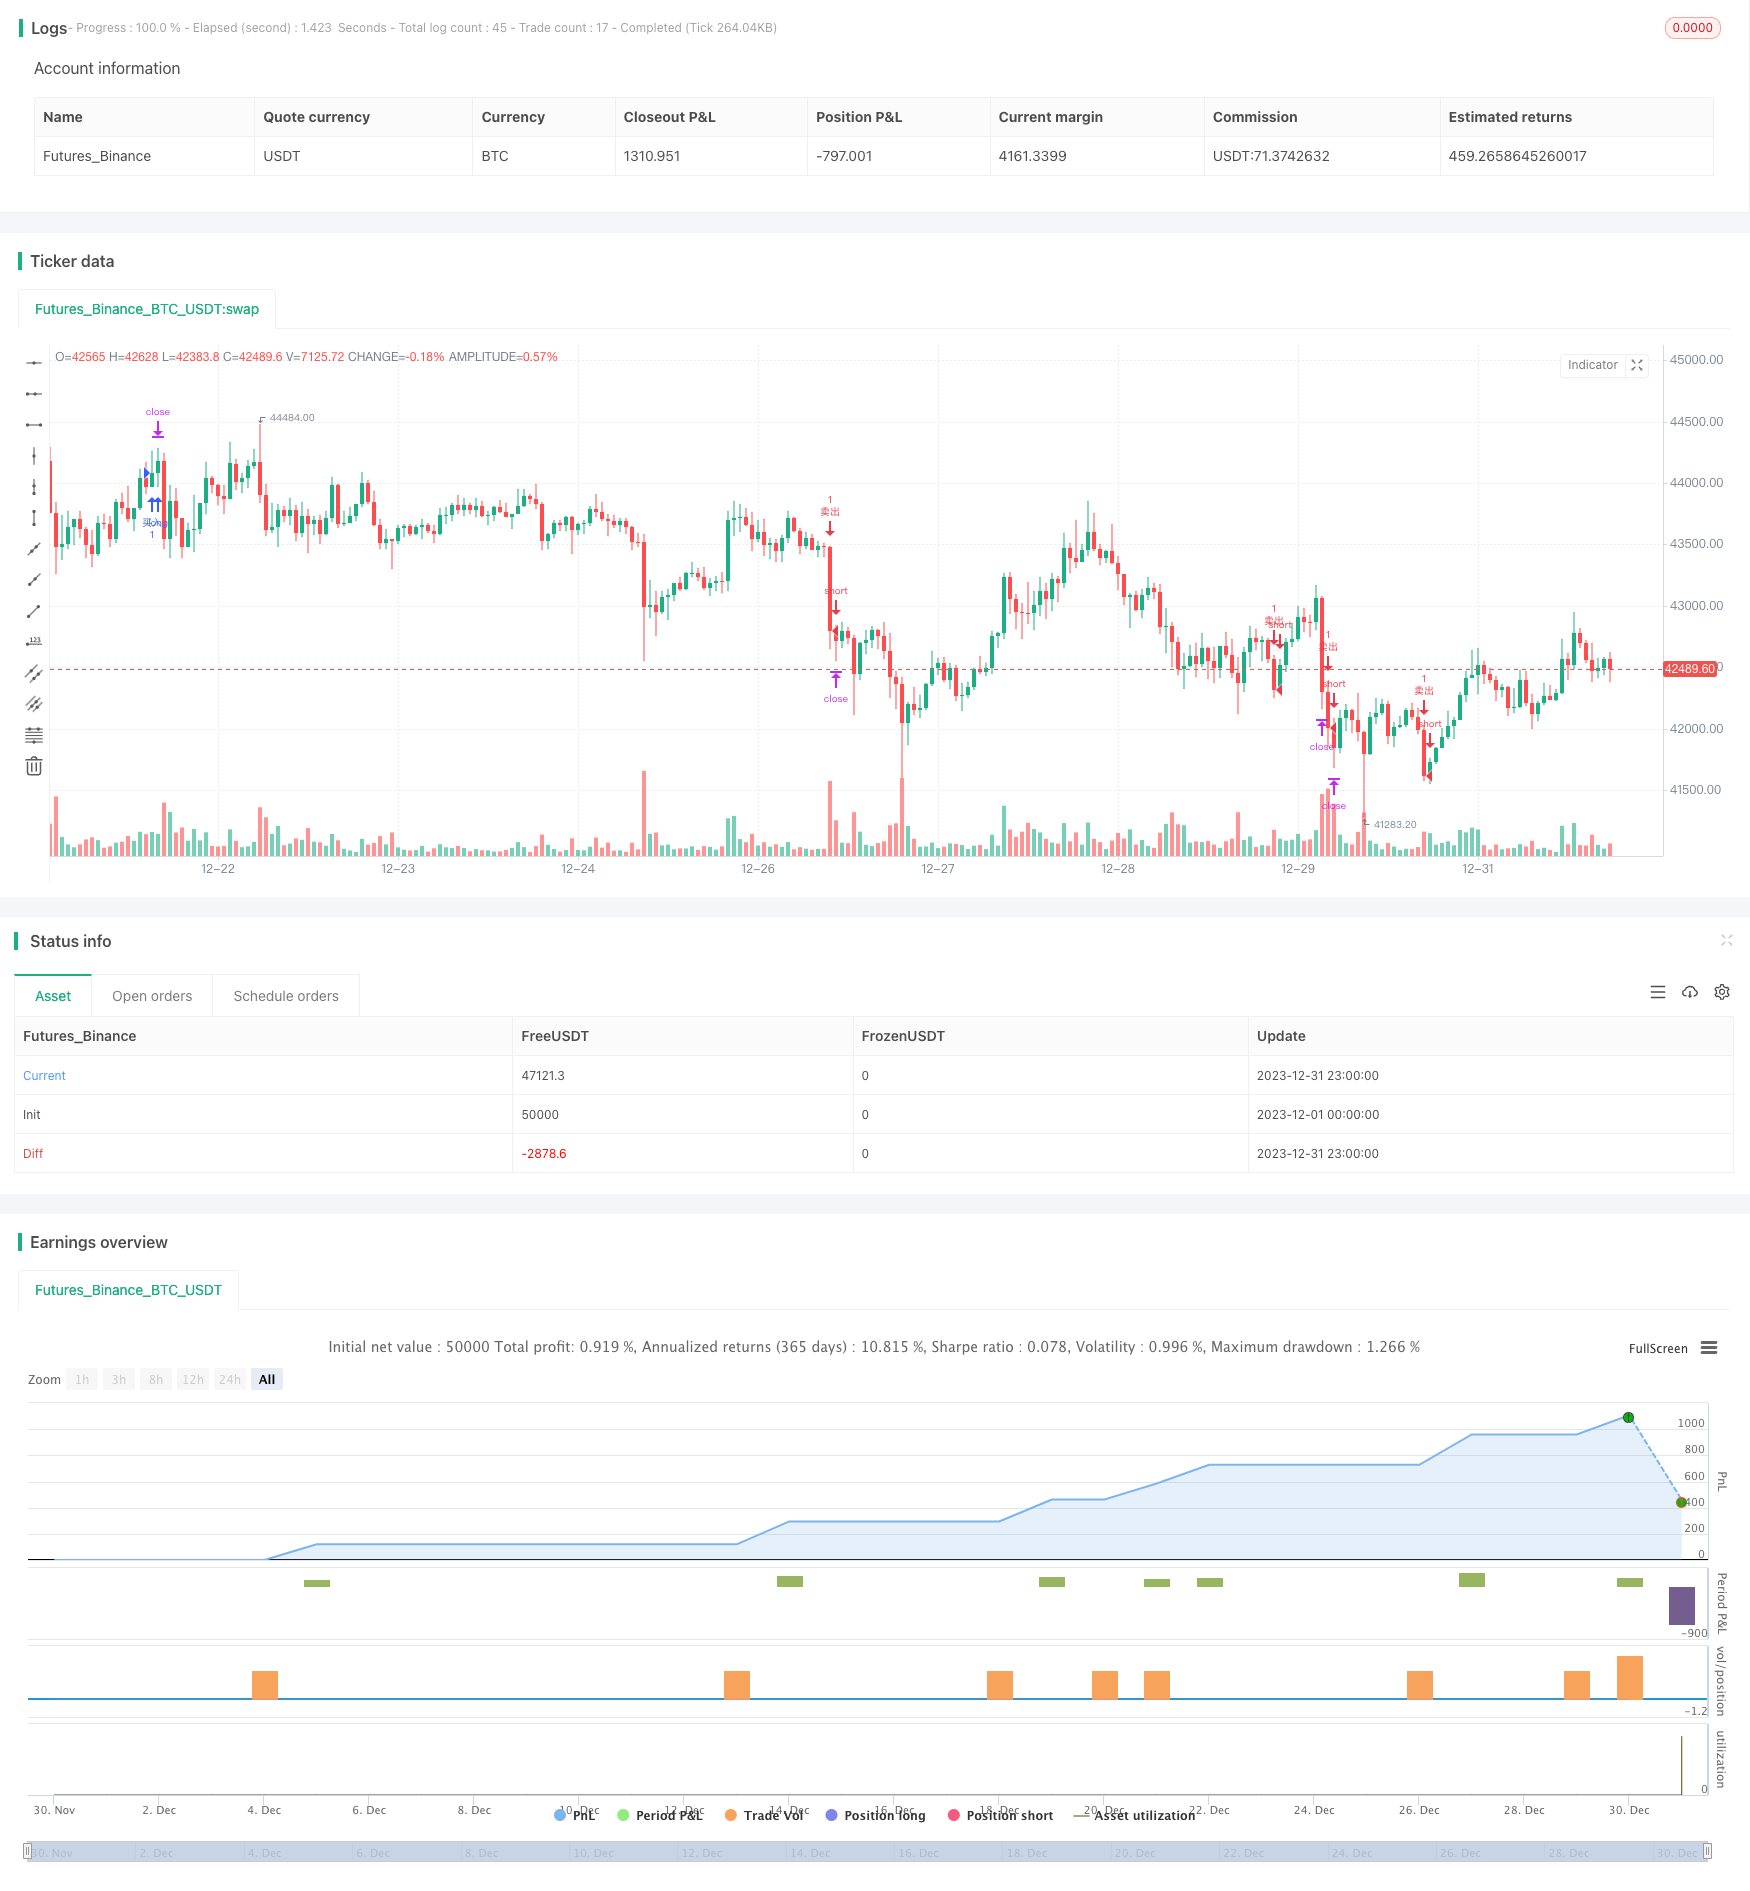
Name
经典动态MACD优化交易策略Dynamic-MACD-Optimization-Trading-Strategy
Author
ChaoZhang
Strategy Description
本策略通过对经典MACD指标进行多项优化,实现更准确可靠的交易信号产生和更严格的风险控制。主要优化内容包括:1引入RSI指标避免过度买卖;2加入成交量确认;3设置止损止盈;4优化参数组合。
基本原理仍然是MACD指标的快慢线金叉做多,死叉做空。主要优化体现在:
-
引入RSI指标,这样可以避免在市场被高估或低估的情况下产生虚假信号。RSI可以有效反映市场的买卖压力。
-
加入成交量的判断,只有在成交量放大的情况下才产生信号,避免无效突破。成交量的放大可以证实趋势的力度。
-
设置止损止盈机制,可以动态跟踪市场波动将风险控制在可承受范围。止损可以有效控制单笔损失;止盈可以锁定利润,避免利润回吐。
-
优化MACD参数组合,调整快慢线和信号线的参数,取得更好的参数组合,产生更精确的交易信号。
这套策略通过多重优化后的MACD具有以下显著优势:
-
减少了虚假信号的产生,信号的可靠性和准确性大为提高。
-
严格的止损止盈机制控制了交易风险,最大程度锁定了盈利。
-
MACD的参数经过优化调整,更契合不同品种和时间周期。
-
多指标组合产生信号,系统性强,适应更广泛的市场环境。
-
整体而言,资金效率和收益风险比有很大提高。
本策略也存在一些风险需要防范:
-
优化后参数不一定百分之百适合所有品种和周期,需要根据实际情况调整。
-
信号产生频率会有所降低,存在一定程度的漏单风险。
-
在极端市场情况下,多个指标可能会发出冲突信号,需要人工进行判断。
-
自动止损在快速跳空的情况下可能会过早止损,给利润带来一定风险。
对策主要是人工监控判断,根据市场情况适当调整参数,并控制好仓位规模。
本策略可以继续从以下方面进行优化:
-
测试更多指标的组合,如布林带、KD等,形成指标群体判定。
-
应用机器学习算法自动优化参数,使之更智能化。
-
加入更严格的资金管理策略,如固定份额、Kelly公式等。
-
开发自动止盈策略,根据趋势和波动率调整止盈点。
-
应用深度学习等前沿算法实现更准确预测。
本策略通过原始MACD指标的多重优化,解决了MACD容易产生假信号和风险控制不足的缺点。多指标组合与止损止盈的运用使得信号更加准确可靠,风险控制也更为严密。本策略值得进一步开发与应用,是MACD指标改进的一个典范。
||
This strategy optimizes the classic MACD indicator in multiple ways to generate more accurate and reliable trading signals and achieve stricter risk control. The main optimizations include: 1introducing RSI indicator to avoid overbuying/overselling; 2adding volume confirmation; 3setting stop loss and take profit; 4optimizing parameter combination.
The basic principle still uses the MACD golden cross for long and death cross for short. The main optimizations are reflected in:
-
Introducing the RSI indicator to avoid generating false signals when the market is overestimated or underestimated. RSI can effectively reflect the buying/selling pressure in the market.
-
Adding volume judgment, signals are only generated when the trading volume increases, avoiding invalid breakouts. The enlargement of trading volume can confirm the strength of the trend.
-
Setting stop loss and take profit mechanisms that can dynamically track market fluctuations and control risks within bearable ranges. Stop loss can effectively limit per trade loss; take profit locks in profits and avoids profit retracement.
-
Optimizing MACD parameter combination to obtain better parameter portfolio and generate more precise trading signals.
This multi-optimized MACD strategy has the following significant advantages:
-
Greatly increased signal reliability and accuracy by reducing false signals.
-
The strict stop loss and take profit mechanism controls trading risks and locks in profits to the maximum extent.
-
MACD parameters are optimized and more suitable for different products and time frames.
-
Signals generated from multiple indicator combinations have higher robustness and adaptability to broader market environments.
-
Overall capital efficiency and risk reward ratio are greatly improved.
Some risks of this strategy also need to be prevented:
-
The optimized parameters may not be 100% suitable for all products and periods, requiring situational adjustments.
-
The frequency of signal generation will be reduced, resulting in certain missed trade risks.
-
Conflicting signals may appear from multiple indicators under extreme market conditions, requiring manual judgment.
-
Automatic stop loss may stop out prematurely in fast gap scenarios, posing some risk to profits.
The counter measures are mainly manual monitoring and judgment, adjusting parameters according to market conditions when necessary, and controlling position sizing.
The strategy can be further optimized in the following aspects:
-
Test more indicator combinations such as Bollinger Bands, KD to form a group judgment.
-
Apply machine learning algorithms to automatically optimize parameters for higher intelligence.
-
Introduce stricter money management strategies such as fixed fractional, Kelly formula etc.
-
Develop automatic take profit strategies to adjust take profit points based on trends and volatility.
-
Apply cutting edge algorithms like deep learning for more accurate predictions.
By multi-dimensional optimization of the original MACD indicator, this strategy solves the problems of MACD’s tendency to generate false signals and inadequate risk control. The application of multiple indicators combined with stop loss and take profit makes the signals more accurate and reliable, and the risk control is also more strict. This strategy deserves further development and application, and is a paradigm of MACD indicator enhancement.
[/trans]
Strategy Arguments
| Argument | Default | Description |
|---|---|---|
| v_input_1 | 16 | 快速线周期 |
| v_input_2 | 34 | 慢速线周期 |
| v_input_3 | 10 | 信号线平滑 |
| v_input_4 | 19 | RSI周期 |
| v_input_5 | 13 | 成交量平均周期 |
| v_input_float_1 | 10.5 | 止损百分比 |
| v_input_float_2 | 0.3 | 止盈百分比 |
Source (PineScript)
/*backtest
start: 2023-12-01 00:00:00
end: 2023-12-31 23:59:59
period: 1h
basePeriod: 15m
exchanges: [{"eid":"Futures_Binance","currency":"BTC_USDT"}]
*/

//@version=5
strategy("优化版MACD交易策略 ", overlay=true)

// 输入参数
fastLength = input(16, "快速线周期")
slowLength = input(34, "慢速线周期")
signalSmoothing = input(10, "信号线平滑")
rsiPeriod = input(19, "RSI周期")
overboughtRsi = 70
oversoldRsi = 30
volumeAvgPeriod = input(13, "成交量平均周期")
stopLossPerc = input.float(10.5, "止损百分比", step=0.1)
takeProfitPerc = input.float(0.3, "止盈百分比", step=0.1)

// 计算指标
[macdLine, signalLine, _] = ta.macd(close, fastLength, slowLength, signalSmoothing)
rsi = ta.rsi(close, rsiPeriod)
volumeAvg = ta.sma(volume, volumeAvgPeriod)

// 交易信号
longCondition = ta.crossover(macdLine, signalLine) and macdLine > 0 and rsi < overboughtRsi and volume > volumeAvg
shortCondition = ta.crossunder(macdLine, signalLine) and macdLine < 0 and rsi > oversoldRsi and volume > volumeAvg

// 止损和止盈
longStopLossPrice = close * (1 - stopLossPerc / 100)
longTakeProfitPrice = close * (1 + takeProfitPerc / 100)
shortStopLossPrice = close * (1 + stopLossPerc / 100)
shortTakeProfitPrice = close * (1 - takeProfitPerc / 100)

// 执行交易
if longCondition
    strategy.entry("买入", strategy.long)
    strategy.exit("买入止损止盈", "买入", stop=longStopLossPrice, limit=longTakeProfitPrice)

if shortCondition
    strategy.entry("卖出", strategy.short)
    strategy.exit("卖出止损止盈", "卖出", stop=shortStopLossPrice, limit=shortTakeProfitPrice)
Detail
https://www.fmz.com/strategy/439746
Last Modified
2024-01-23 14:40:38
