Name
综合多空自动期货交易策略Comprehensive-Futures-Automated-Trading-Strategy-for-Both-Long-and-Short
Author
ChaoZhang
Strategy Description
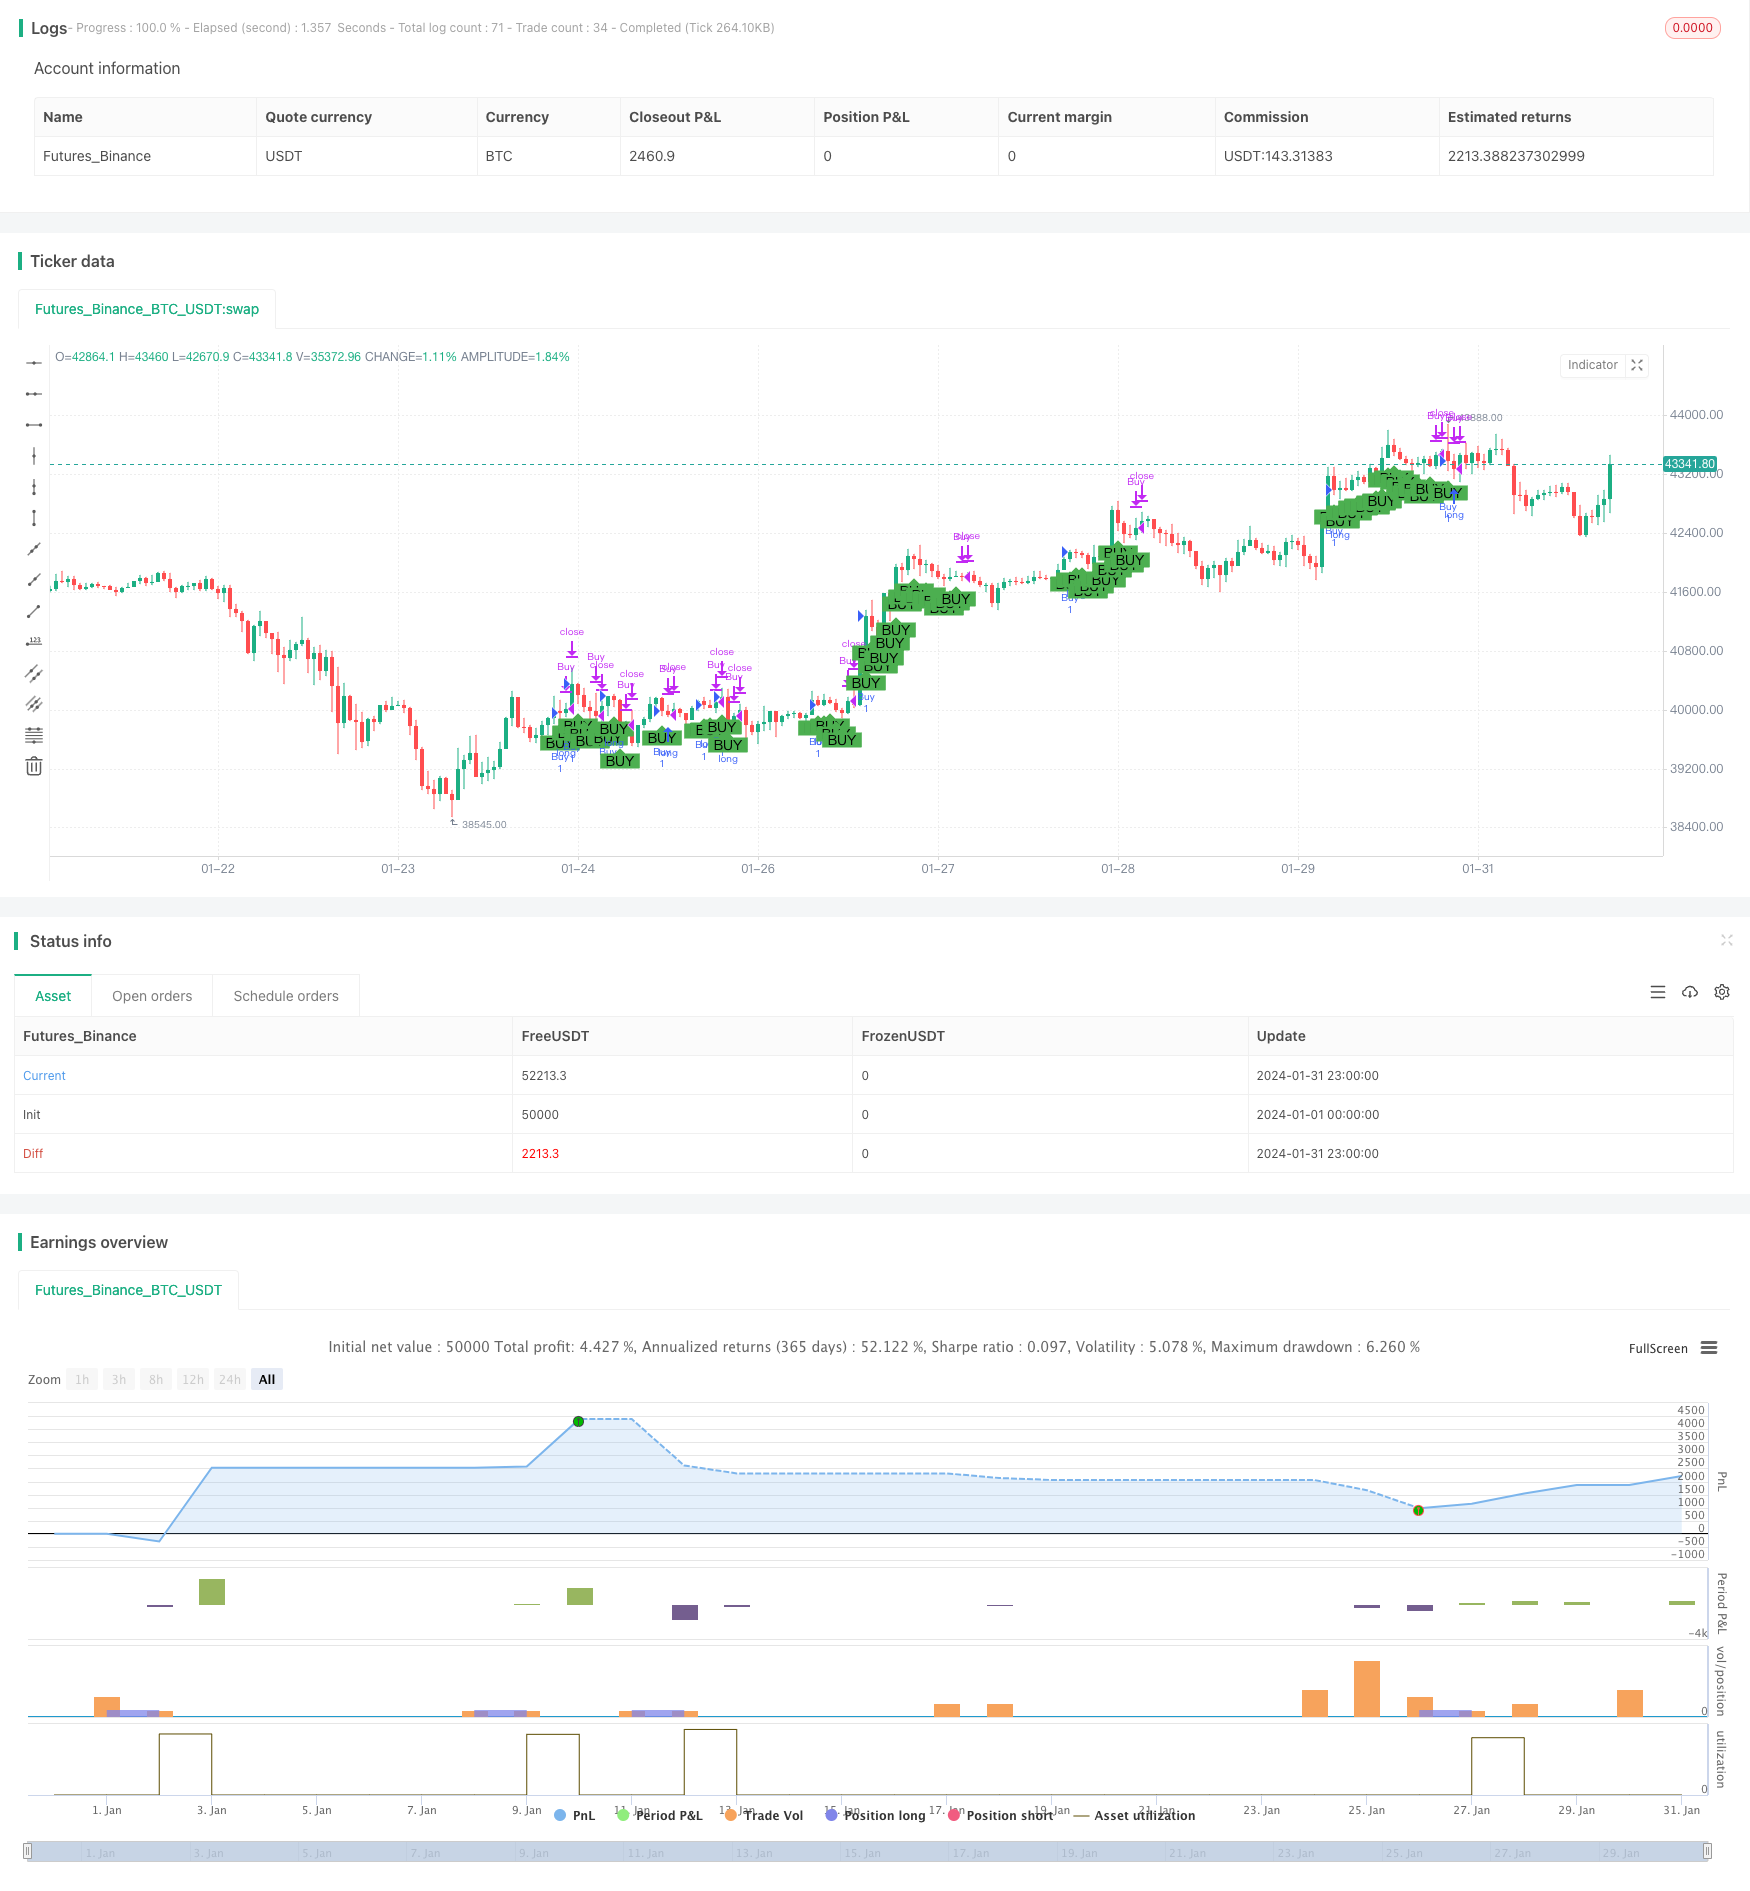
本策略是一款创新的综合多空自动期货交易策略,整合SuperTrend、QQE和Trend Indicator A-V2多个指标,实现自动发现交易讯号并进行多空交易。本策略旨在发掘市场主要趋势,在控制好风险的前提下获得稳定收益。
策略原理
本策略主要基于三个部分:
-
SuperTrend指标负责判断市场主要趋势方向。当价格超过上转向线时为看涨,下破下转向线时为看跌。
-
QQE指标结合RSI判断超买超卖状态。根据RSI的平均值、标准差计算出动态上下限,RSI高于上限时为超买讯号,低于下限时为超卖讯号。
-
Trend Indicator A-V2指标通过计算EMA快慢线位置判断趋势,快线高于慢线为看涨讯号。
在判断市场方向时,当SuperTrend为看涨,且QQE判断非超卖,且A-V2为看涨时,发出做多讯号进场;当SuperTrend为看跌,且QQE判断非超买,且A-V2为看跌时,发出做空讯号进场。
策略优势
-
综合使用多个指标,使交易决策更加可靠,减少假讯号。
-
可实现自动发现交易讯号,无需人工干预判断,降低人为错误。
-
利用指标有机结合,在发现讯号的同时控制好风险,达到稳定盈利。
-
参数可调,用户可根据自己偏好个性化策略。
-
支持单边多单或双边交易,交易灵活。
风险及解决
-
市场特殊情况下,指标可能发出错误讯号,可通过优化指标参数减少。
-
交易成本和滑点可能影响策略盈利空间,可通过实现止损止盈机制优化。
-
指标参数设定不当可能导致策略表现不佳,可尝试不同参数寻找最佳配置。
优化方向
-
增加机器学习算法,根据历史数据自动优化指标参数,使策略更加智能化。
-
结合更多市场微结构因素,如交易量、外盘等数据发掘更有效的交易讯号。
-
应用高频交易技术,通过算法模型自动提交订单进行交易执行。
总结
本策略整合多个指标判断市场结构,在控制风险的前提下实现稳定盈利,既考虑趋势方向又兼顾超买超卖状态,交易决策更加细緻。优化空间还很大,可从参数优化、结构优化、执行优化等方面进一步提升策略表现。
||
This strategy is an innovative Comprehensive Futures Automated Trading Strategy for Both Long and Short. It integrates SuperTrend, QQE and Trend Indicator A-V2 to automatically discover trading signals and make long/short trades. This strategy aims to identify main market trends and achieve steady profits with good risk control.
Strategy Principle
The strategy consists of three main parts:
-
SuperTrend indicator determines the main market trend. When price breaks above the up trendline, it indicates an uptrend. When price breaks below the down trendline, it indicates a downtrend.
-
QQE indicator combines RSI to identify overbought/oversold status. Dynamic overbought/oversold levels are calculated based on RSI average and standard deviation. RSI above upper level indicates overbought signal and RSI below lower level indicates oversold signal.
-
Trend Indicator A-V2 judges the trend by comparing fast and slow EMA lines. When fast EMA is higher than slow EMA, it sends a buy signal.
When judging market direction, long signals are triggered when SuperTrend shows uptrend, QQE not oversold and A-V2 buy signal occurs. Short signals are triggered when opposite conditions occur.
Advantages
-
Using multiple indicators improves reliability and reduces false signals.
-
Automated signal discovery without manual interference reduces human errors.
-
Organic combination of indicators provides effective risk control while discovering trading opportunities.
-
Customizable parameters to meet users' needs.
-
Support both long-only and long/short trading for flexibility.
Risks and Solutions
-
Indicators may generate false signals under extreme market conditions. Fine-tune parameters to minimize such cases.
-
Transaction costs and slippage could erode profits. Optimize with stop loss/take profit.
-
Inadequate parameter setup leads to poor performance. Try different values to find optimal configuration.
Optimization Directions
-
Increase machine learning to auto optimize parameters based on historical data.
-
Incorporate more market micro-structure factors like volume to discover better signals.
-
Implement high frequency trading techniques to auto submit orders.
Conclusion
The strategy combines indicators to assess market structure and achieves steady profits under risk control. It considers both trend direction and overbought/oversold status for nuanced trading decisions. Much room remains for parameter optimization, logic improvements and execution enhancements to further lift strategy performance.
[/trans]
Strategy Arguments
| Argument | Default | Description |
|---|---|---|
| v_input_1 | true | 單邊 |
| v_input_2 | 9 | ST ATR Period |
| v_input_3 | 3.9 | ST ATR Multiplier |
| v_input_4_hl2 | 0 | ST Source: hl2 |
| v_input_5 | 6 | QQE RSI Length |
| v_input_6 | 5 | QQE RSI Smoothing |
| v_input_7 | 3 | QQE Fast Factor |
| v_input_8 | 3 | QQE Thresh-hold |
| v_input_9_close | 0 | QQE RSI Source: close |
| v_input_10 | 52 | TIA-V2 EMA Period |
Source (PineScript)
/*backtest
start: 2024-01-01 00:00:00
end: 2024-01-31 23:59:59
period: 1h
basePeriod: 15m
exchanges: [{"eid":"Futures_Binance","currency":"BTC_USDT"}]
*/

//@version=4
//author:盧振興 芙蓉中華中學畢業 育達科技大學畢業碩士
//參考資料 : QQE MOD By:Mihkel00 ,SuperTrend By:KivancOzbilgic , TrendIndicator A-V2 By:Dziwne

strategy("綜合交易策略", shorttitle="Comprehensive Strategy", overlay=true)

// 添加單邊或多空參數
OnlyLong = input(true, title="單邊")

// SuperTrend 参数
PeriodsST = input(9, title="ST ATR Period")
MultiplierST = input(3.9, title="ST ATR Multiplier")
srcST = input(hl2, title="ST Source")

atrST = atr(PeriodsST)
upST = srcST - (MultiplierST * atrST)
upST := close[2] > upST[1] ? max(upST, upST[1]) : upST
dnST = srcST + (MultiplierST * atrST)
dnST := close[2] < dnST[1] ? min(dnST, dnST[1]) : dnST
trendST = 1
trendST := nz(trendST[1], trendST)
trendST := trendST == -1 and close[2] > dnST[1] ? 1 : trendST == 1 and close[2] < upST[1] ? -1 : trendST

// QQE 参数
RSI_PeriodQQE = input(6, title='QQE RSI Length')
SFQQE = input(5, title='QQE RSI Smoothing')
QQE = input(3, title='QQE Fast Factor')
ThreshHoldQQE = input(3, title="QQE Thresh-hold")
srcQQE = input(close, title="QQE RSI Source")

Wilders_PeriodQQE = RSI_PeriodQQE * 2 - 1

RsiQQE = rsi(srcQQE, RSI_PeriodQQE)
RsiMaQQE = ema(RsiQQE, SFQQE)
AtrRsiQQE = abs(RsiMaQQE[1] - RsiMaQQE)
MaAtrRsiQQE = ema(AtrRsiQQE, Wilders_PeriodQQE)
darQQE = ema(MaAtrRsiQQE, Wilders_PeriodQQE) * QQE

basisQQE = sma(RsiMaQQE - 50, 50)
devQQE = 0.35 * stdev(RsiMaQQE - 50, 50)
upperQQE = basisQQE + devQQE
lowerQQE = basisQQE - devQQE

qqeCondition = RsiMaQQE[1] - 50 > upperQQE[1] ? true : RsiMaQQE[1] - 50 < lowerQQE[1] ? false : na

// Trend Indicator A-V2 参数
ma_periodA_V2 = input(52, title="TIA-V2 EMA Period")
oA_V2 = ema(open, ma_periodA_V2)
cA_V2 = ema(close, ma_periodA_V2)
trendIndicatorAV2Condition = cA_V2[1] >= oA_V2[1] ? true : false

// 综合交易逻辑
longCondition = trendST == 1 and qqeCondition and trendIndicatorAV2Condition
shortCondition = trendST == -1 and not qqeCondition and not trendIndicatorAV2Condition

// 针对多单的开平仓逻辑
if (OnlyLong)
    if (longCondition)
        strategy.entry("Buy", strategy.long)
    else
        strategy.close("Buy")

// 多空都做时的逻辑
if (not OnlyLong)
    if (longCondition)
        strategy.entry("Buy", strategy.long)
    else if (shortCondition)
        strategy.entry("Sell",strategy.short)

    // 添加多空平仓逻辑
    if (not longCondition)
        strategy.close("Buy")
    if (not shortCondition)
        strategy.close("Sell")

// 可视化信号
plotshape(series=longCondition, title="Buy Signal", location=location.belowbar, color=color.green, style=shape.labelup, text="BUY")
plotshape(series=shortCondition and not OnlyLong, title="Sell Signal", location=location.abovebar, color=color.red, style=shape.labeldown, text="SELL")
Detail
https://www.fmz.com/strategy/441988
Last Modified
2024-02-18 14:25:04
