Name
自适应价格通道策略Adaptive-Price-Channel-Strategy
Author
ChaoZhang
Strategy Description
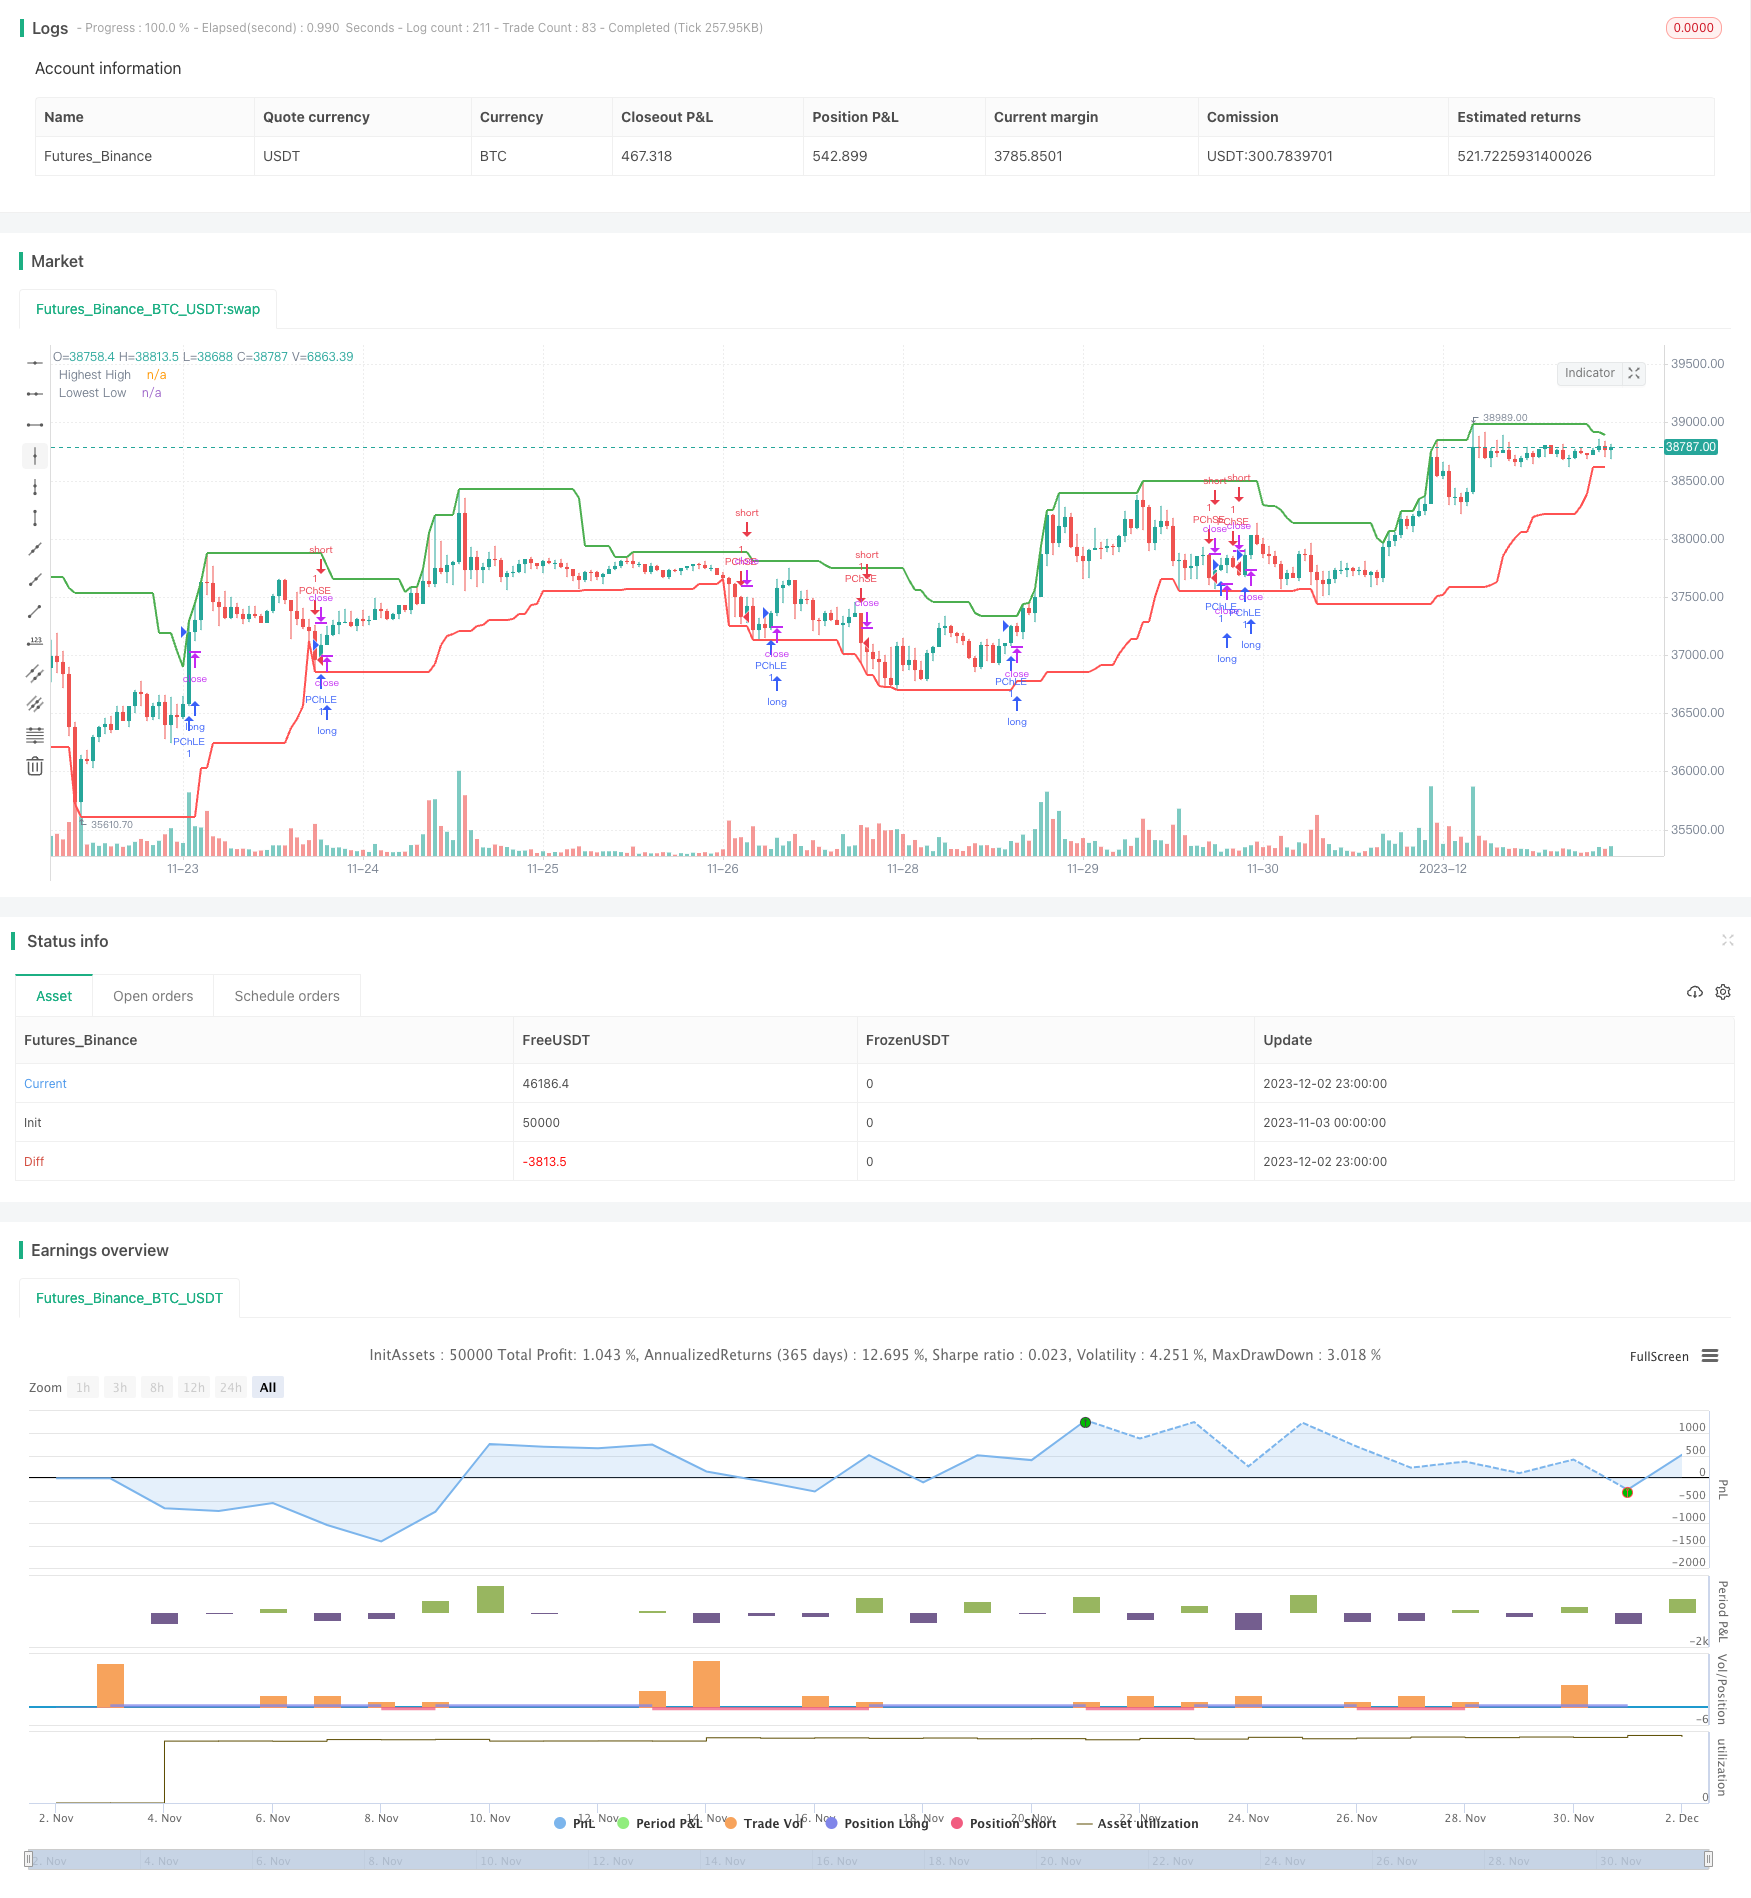
该策略是一种基于平均真实范围(ATR)指标和平均方向指数(ADX)的自适应价格通道策略。它旨在识别价格运动中的盘整市场和趋势,并相应进行交易。
-
计算最近length根K线的最高价(HH)和最低价(LL)。同时计算length根K线上的ATR。
-
根据价格的上涨和下跌计算+DI和-DI,再计算ADX。
-
如果ADX<25,则判断为盘整市场。此时如果收盘价高于价格通道上限(HH - ATR乘数ATR),做多;如果收盘价低于价格通道下限(LL + ATR乘数ATR),做空。
-
如果ADX>=25且+DI>-DI,则判断为牛市。此时如果收盘价高于价格通道上限,做多。
-
如果ADX>=25且+DI<-DI,则判断为空头市场。此时如果收盘价低于价格通道下限,做空。
-
进入仓位后,若超过exit_length根K线未止损,则强制止损平仓。
-
该策略可自动适应市场环境。在盘整市场采用价格通道策略,在趋势市场跟随趋势方向交易。
-
ATR和ADX指标的运用确保了策略的自适应性。ATR用于调整价格通道的宽度,ADX用于判断市场趋势。
-
强制止损机制有助于策略的稳定性。
-
ADX判断产生错误信号的概率较大。
-
ATR和ADX指标设置不当可能导致策略效果差。
-
无法有效规避行情突变的风险。
-
优化ATR和ADX指标的参数,使自适应效果更好。
-
增加止损线以降低亏损风险。
-
增加 filter条件过滤错误信号。
自适应价格通道策略综合运用多种指标和机制,在不同行情环境下采取不同策略,具有一定的自适应性和稳定性。但由于指标设置和参数选择的局限性,该策略也面临一定的误判风险。未来的优化方向在于参数优化、风险控制等方面。
||
This strategy is an adaptive price channel strategy based on the Average True Range (ATR) indicator and Average Directional Index (ADX). It aims to identify sideways markets and trends in price movements and make trades accordingly.
-
Calculate the highest high (HH) and lowest low (LL) over a given length. Also calculate ATR over the same length.
-
Calculate +DI and -DI based on upward and downward price moves. Then calculate ADX.
-
If ADX < 25, the market is considered sideways. If close > upper channel (HH - ATR multiplier * ATR), go long. If close < lower channel (LL + ATR multiplier * ATR), go short.
-
If ADX >= 25 and +DI > -DI, market is bullish. If close > upper channel, go long.
-
If ADX >= 25 and +DI < -DI, market is bearish. If close < lower channel, go short.
-
Exit position after exit_length bars since entry.
-
The strategy adapts automatically based on market conditions, using channel strategy in sideways market and trend following in trending market.
-
Using ATR and ADX ensures adaptiveness. ATR adjusts channel width, ADX determines trend.
-
Forced exit adds stability.
-
ADX can generate false signals frequently.
-
Poor ATR and ADX parameters lead to bad performance.
-
Unable to effectively guard against black swan events.
-
Optimize parameters for ATR and ADX to improve adaptability.
-
Add stop loss to limit losses.
-
Add filters to avoid false signals.
The strategy combines indicators and mechanisms to adapt across market conditions. But misjudgements can happen due to indicator limitations. Future optimizations on parameters and risk control.
[/trans]
Strategy Arguments
| Argument | Default | Description |
|---|---|---|
| v_input_1 | 20 | Length |
| v_input_2 | 10 | Exit After X Periods |
| v_input_3 | 3.2 | ATR Multiplier |
| v_input_4 | timestamp(2019-01-15T08:15:15+00:00) | Start Date |
| v_input_5 | timestamp(2033-04-01T08:15:00+00:00) | End Date |
Source (PineScript)
/*backtest
start: 2023-11-03 00:00:00
end: 2023-12-03 00:00:00
period: 1h
basePeriod: 15m
exchanges: [{"eid":"Futures_Binance","currency":"BTC_USDT"}]
*/

//@version=5
strategy("Adaptive Price Channel Strategy", overlay=true)

length = input(20, title="Length")
exit_length = input(10, title="Exit After X Periods")
atr_multiplier = input(3.2, title="ATR Multiplier")

startDate = input(defval = timestamp("2019-01-15T08:15:15+00:00"), title = "Start Date")
endDate = input(defval = timestamp("2033-04-01T08:15:00+00:00"), title = "End Date")

hh = ta.highest(high, length)
ll = ta.lowest(low, length)
atr = ta.atr(length)

// calculate +DI and -DI
upMove = high - high[1]
downMove = low[1] - low
plusDM = na(upMove[1]) ? na : (upMove > downMove and upMove > 0 ? upMove : 0)
minusDM = na(downMove[1]) ? na : (downMove > upMove and downMove > 0 ? downMove : 0)
plusDI = ta.rma(plusDM, length) / atr * 100
minusDI = ta.rma(minusDM, length) / atr * 100

// calculate ADX
dx = math.abs(plusDI - minusDI) / (plusDI + minusDI) * 100
adx = ta.rma(dx, length)

var int barSinceEntry = na

if (not na(close[length]) )
    if (adx < 25) // Sideways market
        if (close > hh - atr_multiplier * atr)
            strategy.entry("PChLE", strategy.long, comment="PChLE")
            barSinceEntry := 0
        else if (close < ll + atr_multiplier * atr)
            strategy.entry("PChSE", strategy.short, comment="PChSE")
            barSinceEntry := 0
    else if (adx >= 25 and plusDI > minusDI) // Bullish market
        if (close > hh - atr_multiplier * atr)
            strategy.entry("PChLE", strategy.long, comment="PChLE")
            barSinceEntry := 0
    else if (adx >= 25 and plusDI < minusDI) // Bearish market
        if (close < ll + atr_multiplier * atr)
            strategy.entry("PChSE", strategy.short, comment="PChSE")
            barSinceEntry := 0

if (na(barSinceEntry))
    barSinceEntry := barSinceEntry[1] + 1
else if (barSinceEntry >= exit_length)
    strategy.close("PChLE")
    strategy.close("PChSE")
    barSinceEntry := na

plot(hh, title="Highest High", color=color.green, linewidth=2)
plot(ll, title="Lowest Low", color=color.red, linewidth=2)
Detail
https://www.fmz.com/strategy/434194
Last Modified
2023-12-04 16:33:45
