Name
质数波带回测策略Prime-Number-Bands-Backtest-Strategy
Author
ChaoZhang
Strategy Description
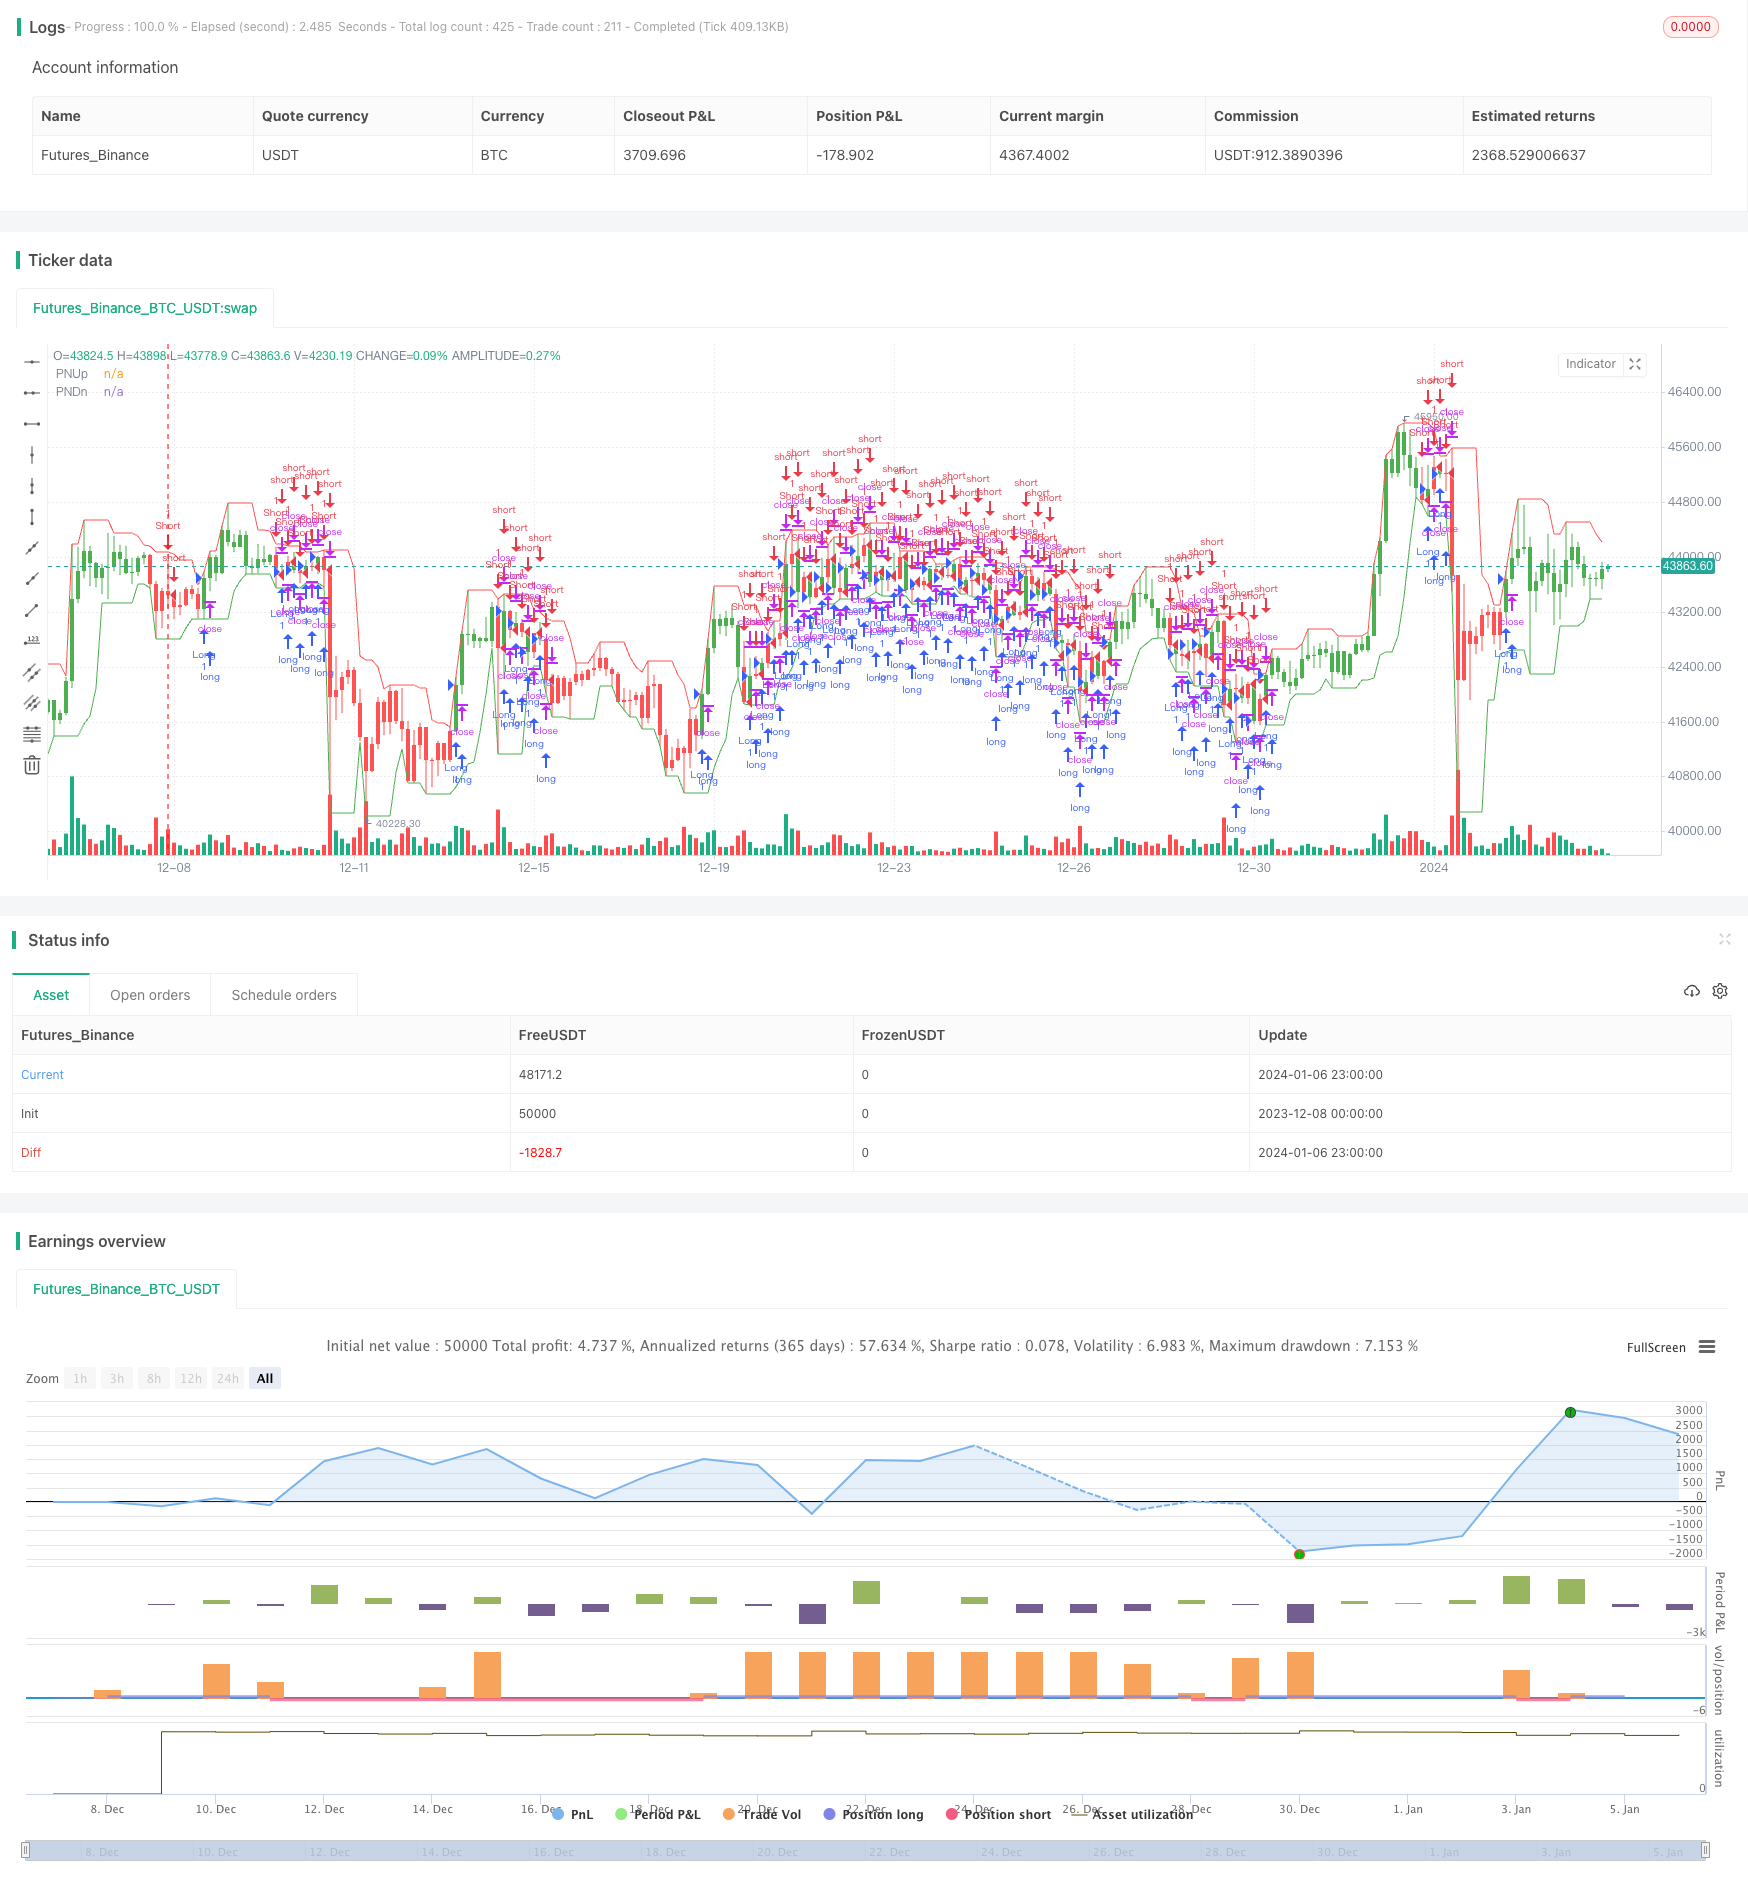
质数波带回测策略通过识别价格附近的最高和最低质数,并将这两个质数系列绘制为一个波带,来判断市场趋势。该策略由模数金融工程公司开发。
- 根据输入的容差百分比percent,遍历一个指定价格的正负波动范围,寻找最高和最低的质数。
- 使用highest和lowest函数获取最近N根K线中的质数波带最高点和最低点。
- 判断收盘价是否突破质数波带最高点和最低点,决定做多或者做空方向。
- 可选择反转交易信号。
- 利用质数的随机且不规则分布特性,捕捉市场中的随机性。
- 质数波带具有一定的滞后性,可以过滤掉部分噪音。
- 质数波带上下限灵活,可以通过调整容差百分比来适应不同周期和不同交易品种。
- 质数波带并不能完全契合价格运动,存在一定程度的滞后。
- 物极必反的价格反转可能导致错误信号。
- 容差百分比设置过大会过滤掉部分有效讯号。
可以通过适当调整参数、结合其他指标等方式来规避风险。
- 可以结合移动平均线等指标,设定双重条件触发信号。
- 可以研究其他随机数的使用,如斐波那契数等。
- 可以引入机器学习算法,实现参数的自动优化。
质数波带回测策略overall是一个非常创新和具有实用价值的策略。它利用质数的特性捕捉市场随机性,同时也考虑到价格滞后识别趋势,研究价值很高。下一步可以从提高信号质量、扩展随机数类型、自动优化等方面进行优化,使策略效果更加出色。
||
The Prime Number Bands backtest strategy judges market trends by identifying the highest and lowest prime numbers around a price and plotting these two prime number series as a band. This strategy was developed by Modulus Financial Engineering Inc.
- Traverse a specified price fluctuation range based on the input tolerance percentage to find the highest and lowest prime numbers.
- Use the highest and lowest functions to obtain the highest and lowest points of the prime number bands in the most recent N bars.
- Determine the long or short direction based on whether the closing price breaks through the highest and lowest points of the prime number bands.
- Can choose to reverse trading signals.
- Capture market randomness using the random and irregular distribution characteristics of prime numbers.
- The prime number bands have a certain lag, which can filter out some noise.
- The upper and lower limits of prime number bands are flexible and can be adjusted through the tolerance percentage to adapt to different cycles and different trading varieties.
- Prime number bands cannot completely fit the price movement and have a certain degree of lag.
- Price reversals due to extremes could lead to wrong signals.
- Excessive tolerance percentage settings filter out some valid signals.
Risks can be avoided by properly adjusting parameters, combining with other indicators, etc.
- Set dual conditions for triggering signals by combining simple moving averages and other indicators.
- Research the use of other random numbers such as Fibonacci numbers.
- Introduce machine learning algorithms to achieve automatic parameter optimization.
The prime number bands backtest strategy overall is a very innovative strategy with practical value. It uses the characteristics of prime numbers to capture market randomness while also considering price lag in identifying trends, very worthwhile for research. Next steps are to optimize from aspects of improving signal quality, expanding random number types, automatic optimization, etc. to make the strategy effect more remarkable.
[/trans]
Strategy Arguments
| Argument | Default | Description |
|---|---|---|
| v_input_1 | 5 | Tolerance Percentage |
| v_input_2 | 5 | Length |
| v_input_3_high | 0 | Source Up Band: high |
| v_input_4_low | 0 | Source Down Band: low |
| v_input_5 | false | Trade reverse |
Source (PineScript)
/*backtest
start: 2023-12-08 00:00:00
end: 2024-01-07 00:00:00
period: 3h
basePeriod: 15m
exchanges: [{"eid":"Futures_Binance","currency":"BTC_USDT"}]
*/

//@version=2
////////////////////////////////////////////////////////////
//  Copyright by HPotter v1.0 27/03/2018
// Determining market trends has become a science even though a high number
// or people still believe it’s a gambling game. Mathematicians, technicians,
// brokers and investors have worked together in developing quite several
// indicators to help them better understand and forecast market movements.
// The Prime Number Bands indicator was developed by Modulus Financial Engineering
// Inc. This indicator is charted by indentifying the highest and lowest prime number
// in the neighborhood and plotting the two series as a band.
//
// You can change long to short in the Input Settings
// WARNING:
//  - For purpose educate only
//  - This script to change bars colors.
////////////////////////////////////////////////////////////
PrimeNumberUpBand(price, percent) =>
    res = 0
    res1 = 0
    for j = price to price + (price * percent / 100)
        res1 := j
	    for i = 2 to sqrt(price)
        	res1 := iff(j % i == 0 , 0, j)
            if res1 == 0
                break
		if res1 > 0
		    break
    res := iff(res1 == 0, res[1], res1)
    res

PrimeNumberDnBand(price, percent) =>
    res = 0
    res2 = 0
    for j = price to price - (price * percent / 100)
        res2 := j
	    for i = 2 to sqrt(price)
        	res2 := iff(j % i == 0 , 0, j)
            if res2 == 0
                break
		if res2 > 0
		    break
    res := iff(res2 == 0, res[1], res2)
    res

strategy(title="Prime Number Bands Backtest", overlay = true)
percent = input(5, minval=0.01, step = 0.01, title="Tolerance Percentage")
Length = input(5, minval=1)
srcUp = input(title="Source Up Band",  defval=high)
srcDn = input(title="Source Down Band",  defval=low)
reverse = input(false, title="Trade reverse")
xPNUB = PrimeNumberUpBand(srcUp, percent)
xPNDB = PrimeNumberDnBand(srcDn, percent)
xHighestPNUB = highest(xPNUB, Length)
xLowestPNUB = lowest(xPNDB, Length)
pos = iff(close > xHighestPNUB[1], 1,
       iff(close < xLowestPNUB[1], -1, nz(pos[1], 0)))
possig = iff(reverse and pos == 1, -1,
          iff(reverse and pos == -1, 1, pos))
if (possig == 1)
    strategy.entry("Long", strategy.long)
if (possig == -1)
    strategy.entry("Short", strategy.short)
barcolor(possig == -1 ? red: possig == 1 ? green : blue )
plot(xHighestPNUB, color=red, title="PNUp")
plot(xLowestPNUB, color=green, title="PNDn")
Detail
https://www.fmz.com/strategy/438025
Last Modified
2024-01-08 11:54:52
