Name
超趋势均线BOLL指标策略Supertrend-Bollinger-Bands-Strategy
Author
ChaoZhang
Strategy Description
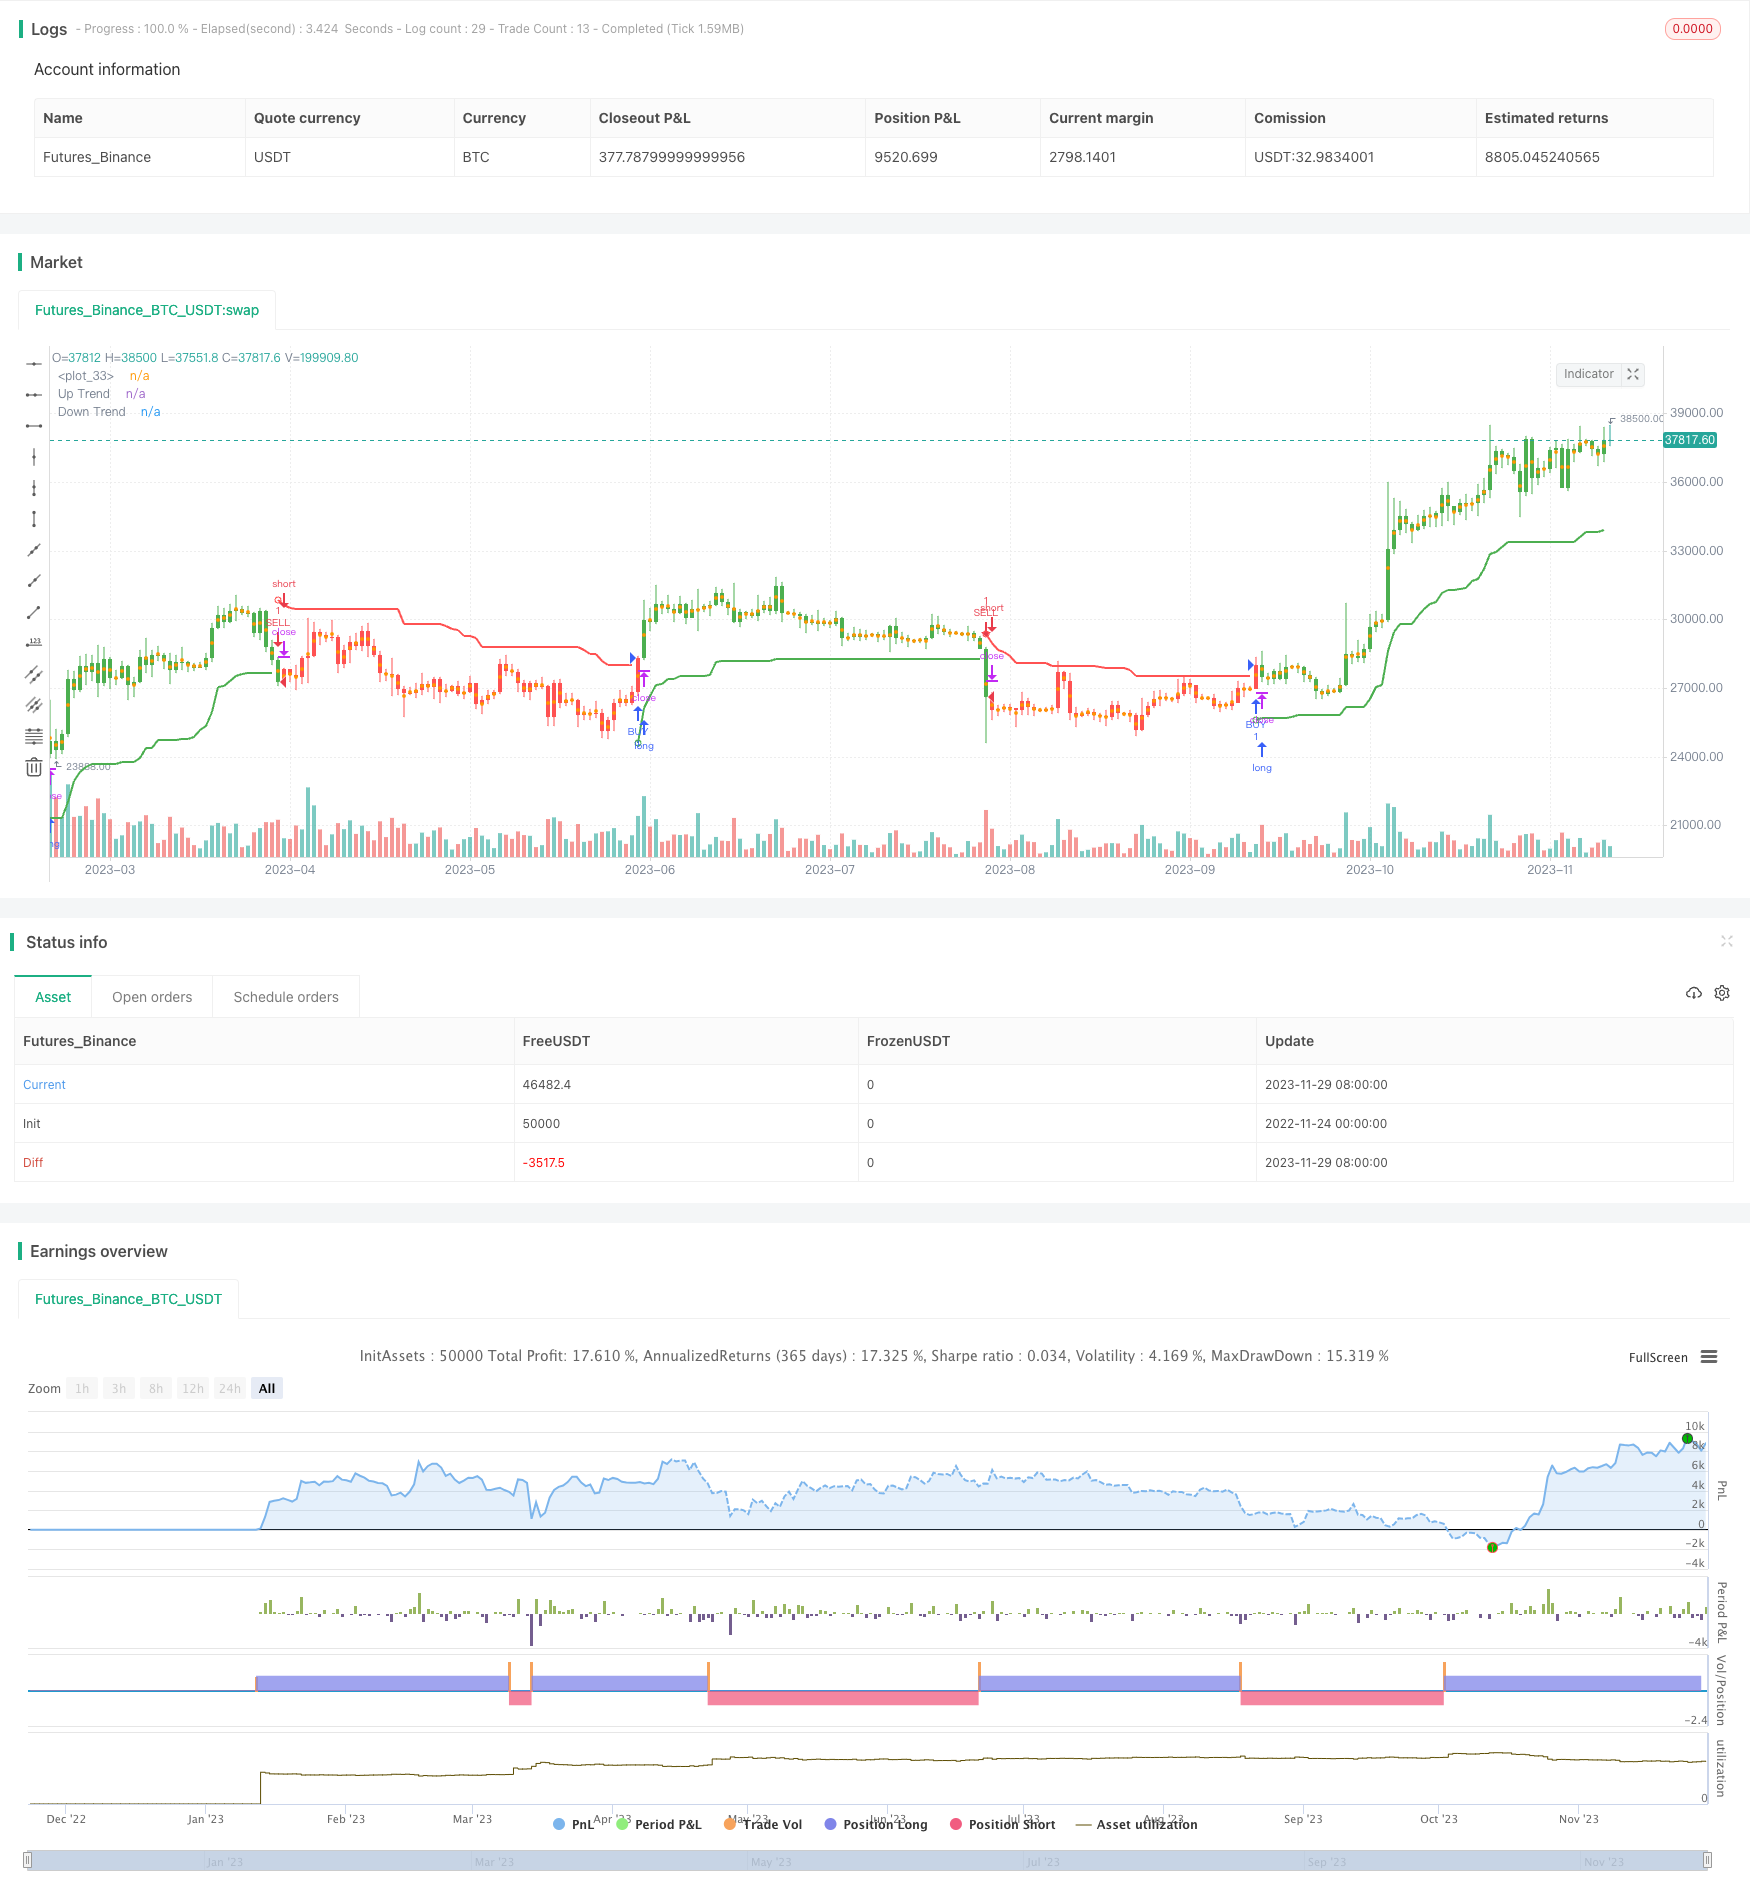
超趋势均线BOLL指标策略是一种常见的基于ATR平均真实波动幅度的追踪止损指标策略。该策略使用超趋势均线指标在图表上绘制多空趋势通道,并结合布林带指标发出买卖信号。
该策略使用两个主要参数——周期和乘数,分别默认为10和3,来计算超趋势均线。具体计算公式如下:
上轨线:收盘价 - (乘数 × ATR平均真实波动幅度) 下轨线:收盘价 + (乘数 × ATR平均真实波动幅度)
当收盘价高于上一周期的上轨时,视为多头信号;当收盘价跌破上一周期的下轨时,视为空头信号。
该策略还结合布林带指标,以中轨 为基准线,上下轨分别离中轨两个标准差。当价格从下向上突破中轨时产生买入信号;从上向下跌破中轨时产生卖出信号。
- 使用ATA动态计算波动幅度,能快速捕捉市场变化趋势
- 结合布林带指标,使交易信号更可靠
- 可自定义参数,适应不同市场环境
- 在震荡行情中容易产生错误信号
- 参数设置不当可能导致交易频繁
- 无法判断趋势转折点,存在一定的滞后性
- 优化ATR周期参数,以 filters 减少噪音交易
- 结合其他指标判断支持阻力位,降低获利回吐概率
- 增加资金管理模块,控制单笔损失
超趋势均线BOLL指标策略整合了多种技术指标的优点,使用动态追踪止损机制,能有效跟踪市场趋势。该策略参数可自定义,适应性强,是一种值得推荐的突破追踪策略。但也应注意防范止损失命中及交易频繁的风险,需要进一步优化以适应更加复杂的市场环境。
||
The Supertrend Bollinger Bands strategy is a common trailing stop indicator strategy based on the ATR (Average True Range). This strategy uses the Supertrend indicator to draw bullish and bearish trend channels on the chart and generates trading signals in combination with Bollinger Bands.
The strategy uses two main parameters - period and multiplier, with default values of 10 and 3 respectively, to calculate the Supertrend lines. The specific calculation formula is as follows:
Upper Line: Close - (Multiplier x ATR) Lower Line: Close + (Multiplier x ATR)
When the closing price is higher than the previous upper line, it is considered a bullish signal. When the closing price breaks below the previous lower line, it is considered a bearish signal.
The strategy also incorporates the Bollinger Bands indicator, using the middle band as the baseline, and the upper and lower bands located two standard deviations away from it. A buy signal is generated when the price breaks above the middle band from below. A sell signal is generated when the price breaks below the middle band from above.
- Use ATR to dynamically calculate volatility, quickly capturing market trend changes
- Combining Bollinger Bands makes trading signals more reliable
- Customizable parameters suit different market environments
- Prone to false signals in sideways markets
- Improper parameter settings may cause over-trading
- Unable to determine trend reversal points, with certain lag
- Optimize ATR period parameter to reduce noise trades using filters
- Incorporate other indicators to determine support/resistance to reduce profit retracement probability
- Add position sizing rules to limit per trade loss
The Supertrend Bollinger Bands strategy integrates the strengths of multiple technical indicators and utilizes a dynamic trailing stop mechanism to effectively track market trends. This highly customizable strategy adapts well to different markets, making it a recommended breakout chasing strategy. However, risks like whipsaws and over-trading should be addressed by further optimizations to suit more complex market environments.
[/trans]
Strategy Arguments
| Argument | Default | Description |
|---|---|---|
| v_input_1 | 10 | ATR Period |
| v_input_2_hl2 | 0 | Source: hl2 |
| v_input_3 | 3 | ATR Multiplier |
| v_input_4 | true | Change ATR Calculation Method ? |
| v_input_5 | false | Show Buy/Sell Signals ? |
| v_input_6 | true | Highlighter On/Off ? |
| v_input_7 | true | Bar Coloring On/Off ? |
| v_input_8 | 9 | From Month |
| v_input_9 | true | From Day |
| v_input_10 | 2018 | From Year |
| v_input_11 | true | To Month |
| v_input_12 | true | To Day |
| v_input_13 | 9999 | To Year |
Source (PineScript)
/*backtest
start: 2022-11-24 00:00:00
end: 2023-11-30 00:00:00
period: 1d
basePeriod: 1h
exchanges: [{"eid":"Futures_Binance","currency":"BTC_USDT"}]
*/

// This source code is subject to the terms of the Mozilla Public License 2.0 at https://mozilla.org/MPL/2.0/
// © KivancOzbilgic


//@version=4
strategy("SuperTrend STRATEGY", overlay=true)
Periods = input(title="ATR Period", type=input.integer, defval=10)
src = input(hl2, title="Source")
Multiplier = input(title="ATR Multiplier", type=input.float, step=0.1, defval=3.0)
changeATR= input(title="Change ATR Calculation Method ?", type=input.bool, defval=true)
showsignals = input(title="Show Buy/Sell Signals ?", type=input.bool, defval=false)
highlighting = input(title="Highlighter On/Off ?", type=input.bool, defval=true)
barcoloring = input(title="Bar Coloring On/Off ?", type=input.bool, defval=true)
atr2 = sma(tr, Periods)
atr= changeATR ? atr(Periods) : atr2
up=src-(Multiplier*atr)
up1 = nz(up[1],up)
up := close[1] > up1 ? max(up,up1) : up
dn=src+(Multiplier*atr)
dn1 = nz(dn[1], dn)
dn := close[1] < dn1 ? min(dn, dn1) : dn
trend = 1
trend := nz(trend[1], trend)
trend := trend == -1 and close > dn1 ? 1 : trend == 1 and close < up1 ? -1 : trend
upPlot = plot(trend == 1 ? up : na, title="Up Trend", style=plot.style_linebr, linewidth=2, color=color.green)
buySignal = trend == 1 and trend[1] == -1
plotshape(buySignal ? up : na, title="UpTrend Begins", location=location.absolute, style=shape.circle, size=size.tiny, color=color.green, transp=0)
plotshape(buySignal and showsignals ? up : na, title="Buy", text="Buy", location=location.absolute, style=shape.labelup, size=size.tiny, color=color.green, textcolor=color.white, transp=0)
dnPlot = plot(trend == 1 ? na : dn, title="Down Trend", style=plot.style_linebr, linewidth=2, color=color.red)
sellSignal = trend == -1 and trend[1] == 1
plotshape(sellSignal ? dn : na, title="DownTrend Begins", location=location.absolute, style=shape.circle, size=size.tiny, color=color.red, transp=0)
plotshape(sellSignal and showsignals ? dn : na, title="Sell", text="Sell", location=location.absolute, style=shape.labeldown, size=size.tiny, color=color.red, textcolor=color.white, transp=0)
mPlot = plot(ohlc4, title="", style=plot.style_circles, linewidth=0)
longFillColor = highlighting ? (trend == 1 ? color.green : color.white) : color.white
shortFillColor = highlighting ? (trend == -1 ? color.red : color.white) : color.white
fill(mPlot, upPlot, title="UpTrend Highligter", color=longFillColor)
fill(mPlot, dnPlot, title="DownTrend Highligter", color=shortFillColor)
FromMonth = input(defval = 9, title = "From Month", minval = 1, maxval = 12)
FromDay   = input(defval = 1, title = "From Day", minval = 1, maxval = 31)
FromYear  = input(defval = 2018, title = "From Year", minval = 999)
ToMonth   = input(defval = 1, title = "To Month", minval = 1, maxval = 12)
ToDay     = input(defval = 1, title = "To Day", minval = 1, maxval = 31)
ToYear    = input(defval = 9999, title = "To Year", minval = 999)
start     = timestamp(FromYear, FromMonth, FromDay, 00, 00)
finish    = timestamp(ToYear, ToMonth, ToDay, 23, 59)
window()  => time >= start and time <= finish ? true : false
longCondition = buySignal
if (longCondition)
    strategy.entry("BUY", strategy.long)
shortCondition = sellSignal
if (shortCondition)
    strategy.entry("SELL", strategy.short)
buy1= barssince(buySignal)
sell1 = barssince(sellSignal)
color1 = buy1[1] < sell1[1] ? color.green : buy1[1] > sell1[1] ? color.red : na
barcolor(barcoloring ? color1 : na)
Detail
https://www.fmz.com/strategy/433944
Last Modified
2023-12-01 16:30:43
