Name
趋势偏离指标K线结合移动平均线波浪策略Trend-Deviation-Index-with-Moving-Average-Strategy
Author
ChaoZhang
Strategy Description
[trans]
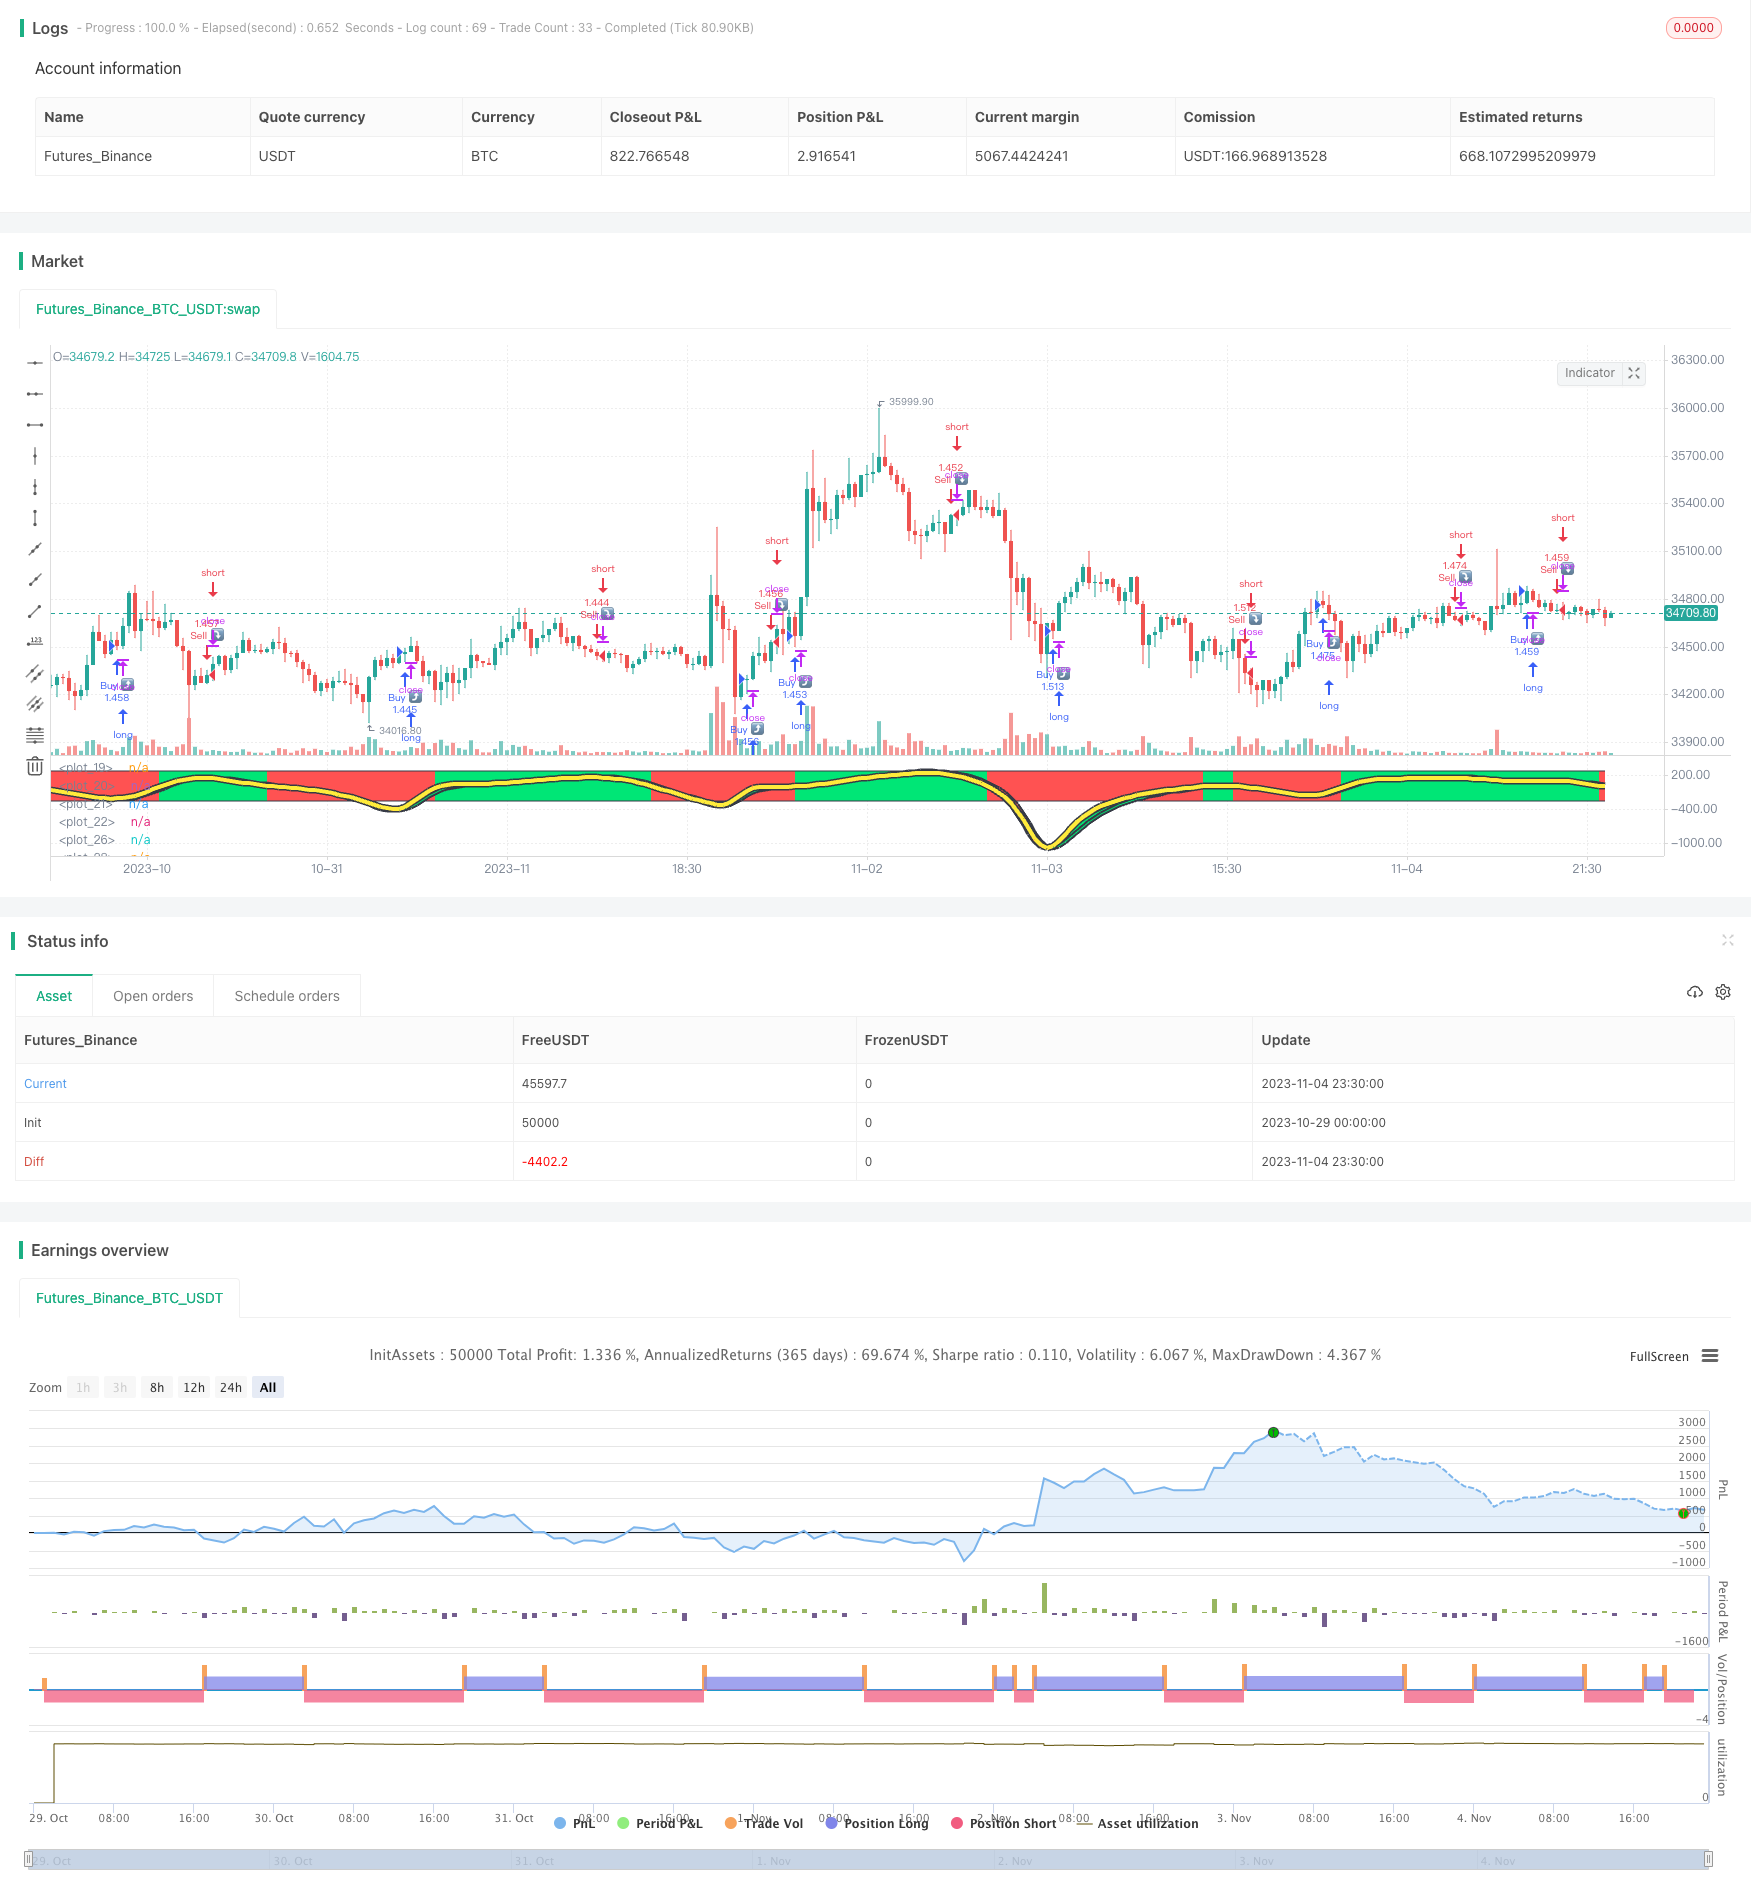
本策略通过计算价格的趋势偏离指标TSI,然后对TSI进行移动平均线处理,形成TSI指标的移动平均线。结合价格的K线方向,判断目前股价处于上升趋势还是下降趋势,从而产生买入和卖出信号。
该策略主要分为以下几个步骤:
- 计算价格的变化pct
- 对pct进行双重HMA平滑处理,得到double_smoothed_pc
- 计算pct的绝对值的双重HMA,得到double_smoothed_abs_pc
- 计算TSI的值:(100 *(double_smoothed_pc / double_smoothed_abs_pc))
- 对TSI值进行HMA移动平均线处理,得到TSI的移动平均线tsihmaline
- 比较TSI值和TSI移动平均线的关系,当TSI值高于移动平均线时为上升趋势,当TSI值低于移动平均线时为下降趋势
- 在上升趋势时,如果价格也在上升,则产生买入信号
- 在下降趋势时,如果价格也在下降,则产生卖出信号
通过上述步骤,可以判断目前的总体趋势方向,结合价格的实际走势,产生交易信号。
- 双重HMA平滑处理,可以有效过滤掉短期噪音,锁定主要趋势
- TSI结合其移动平均线,可以判断总体趋势方向
- 结合价格K线方向,避免假突破,提高信号的可靠性
- 参数可调,可以根据市场调整平滑参数,适应不同周期
- 图形直观,绿色为上升趋势,红色为下降趋势
- 震荡行情时,会产生多次错误信号
- 趋势转折点时,移动平均线有滞后,可能错过最佳入场点
- 需频繁调整参数,以适应市场变化
- 本策略仅基于单个TSI指标,可与其他指标组合优化
- 可以加入过滤器,避免震荡市产生错误信号
- 可以加入其他指标判断,确认趋势转折点
- 可以通过机器学习等方法自动优化参数
- 可以引入停损策略,控制单笔损失
本策略采用TSI指标判断趋势方向,并结合价格K线产生交易信号,可以有效捕捉趋势,在上升趋势买入,下降趋势卖出。但也存在一定风险,需优化以提高稳定性。总体来说,该策略直观易懂,适合熟悉技术指标的交易者使用。
||
This strategy calculates the Trend Deviation Index (TSI) of price, processes TSI with moving average, and forms the moving average line of TSI. Combined with the price candlestick direction, it determines whether the current price is in an uptrend or a downtrend, and thus generates buy and sell signals.
The main steps of this strategy are:
- Calculate the price change percentage pct
- Double smooth pct with HMA to get double_smoothed_pc
- Calculate double HMA of absolute pct to get double_smoothed_abs_pc
- Calculate TSI value: (100 * (double_smoothed_pc / double_smoothed_abs_pc))
- Process TSI value with HMA to get TSI moving average line tsihmaline
- Compare TSI value and TSI moving average line, above moving average is uptrend, below is downtrend
- In uptrend, if price is also rising, generate buy signal
- In downtrend, if price is also falling, generate sell signal
Through above steps, it determines the overall trend direction, combined with actual price movement, to generate trading signals.
- Double HMA smoothing filters out short-term noise and locks in major trend
- TSI and its moving average line determine overall trend direction
- Combined with price candlestick avoids false breakout, improves signal reliability
- Customizable parameters adapt to different cycle markets
- Graphical visualization, green for uptrend, red for downtrend
- May generate multiple false signals during range-bound market
- Moving average line lags at turning points, possibly missing best entry point
- Frequent parameter tuning needed to adapt to changing market
- Based on single TSI indicator, can be optimized with other indicators
- Add filters to avoid false signals during consolidation
- Add other indicators to confirm trend reversal points
- Auto-optimize parameters via machine learning etc
- Introduce stop loss to control single trade loss
This strategy uses TSI to determine trend direction combined with price candlesticks to generate trading signals, which can effectively catch the trend, buying in uptrend and selling in downtrend. But there are also risks, requiring optimization to improve stability. Overall, this strategy is intuitive and easy to understand, suitable for traders familiar with technical indicators.
[/trans]
Strategy Arguments
| Argument | Default | Description |
|---|---|---|
| v_input_1 | 50 | Long Length |
| v_input_2 | 50 | Short Length |
| v_input_3 | 7 | Signal Length |
| v_input_4_open | 0 | Source: open |
| v_input_5 | 250 | Upper Line |
| v_input_6 | -250 | Lower Line |
Source (PineScript)
/*backtest
start: 2023-10-29 00:00:00
end: 2023-11-05 00:00:00
period: 30m
basePeriod: 15m
exchanges: [{"eid":"Futures_Binance","currency":"BTC_USDT"}]
*/

//@version=4
strategy(title="TSIHULLBOT", shorttitle="TSICCIHULL", default_qty_type=strategy.percent_of_equity, default_qty_value=100)
long = input(title="Long Length", type=input.integer, defval=50)
short = input(title="Short Length", type=input.integer, defval=50)
signal = input(title="Signal Length", type=input.integer, defval=7)
price = input(title="Source",type=input.source,defval=open)
lineupper = input(title="Upper Line", type=input.integer, defval=250)
linelower = input(title="Lower Line", type=input.integer, defval=-250)
double_smooth(price, long, short) =>
    fist_smooth = hma(price, long)
    hma(fist_smooth, short)
pc = change(price)
double_smoothed_pc = double_smooth(pc, long, short)
double_smoothed_abs_pc = double_smooth(abs(pc), long, short)
tsi_value = (100 * (double_smoothed_pc / double_smoothed_abs_pc))*5
tsihmaline=(hma(tsi_value,signal))*5
clr = tsihmaline < tsi_value ? color.red : color.lime
clr2 = tsi_value < tsi_value[1] ? color.red : color.lime
i1=plot(lineupper+3, color=color.black, linewidth=3)
i2=plot(linelower+3, color=color.black, linewidth=3)
i3=plot(lineupper, color=clr)
i4=plot(linelower, color=clr)
trendv=tsihmaline/5.6
plot(trendv, linewidth=7,  color=color.black)
plot(trendv, linewidth=4,  color=color.yellow)
j1=plot(tsi_value, linewidth=5, color=color.black)
j2=plot(tsi_value[1], linewidth=5, color=color.black)
j3=plot(tsi_value, color=clr2)
j4=plot(tsi_value[1], color=clr2)
fill(i3,i4,color=clr,transp=90)
fill(j3,j4,color=clr2,transp=15)
longCondition = tsihmaline>tsihmaline[1] and price>price[1]
if (longCondition)
    strategy.entry("Buy ⤴️", strategy.long)
shortCondition = tsihmaline<tsihmaline[1] and price<price[1]
if (shortCondition)
    strategy.entry("Sell ⤵️", strategy.short)
Detail
https://www.fmz.com/strategy/431250
Last Modified
2023-11-06 14:46:40
