Name
趋势跟踪买入低点卖出高点策略Trend-Following-Buy-Dip-Sell-Peak-Strategy
Author
ChaoZhang
Strategy Description
[trans]
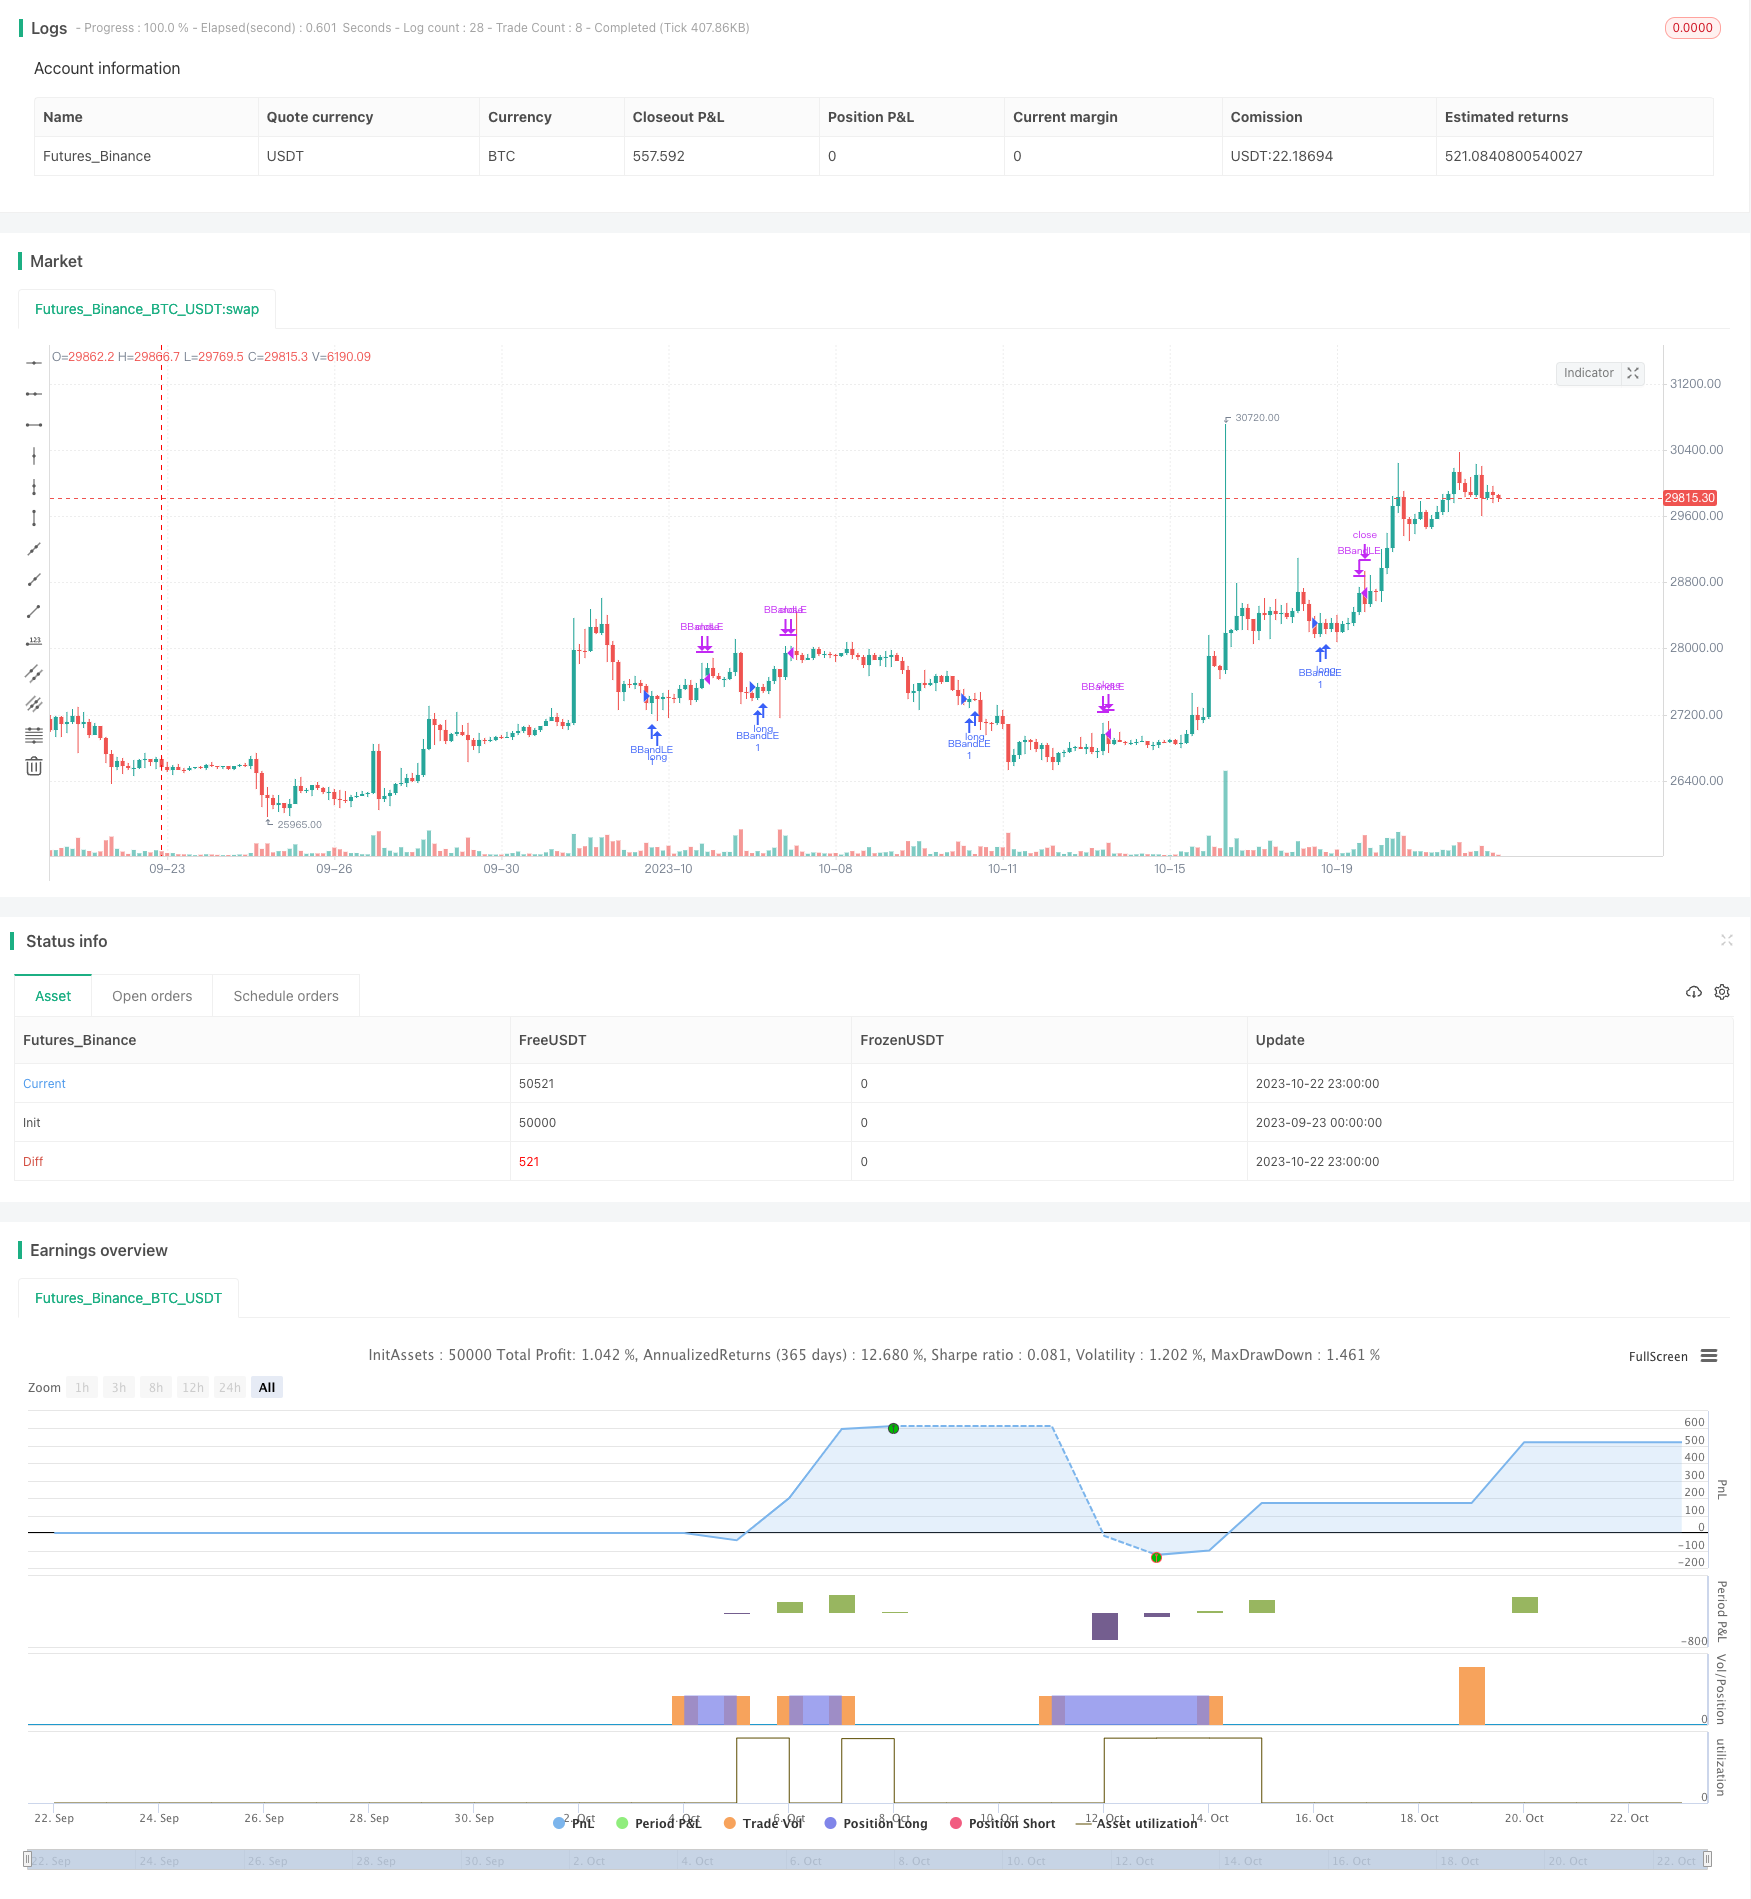
该策略通过计算布林带上的上轨、下轨,结合长短期移动平均线的方向,实现了在趋势方向买入低点、卖出高点的自动化交易策略。其思想是跟踪股票的长线趋势方向,在短线调整时买入低点建立多头仓位,在超买高点时卖出实现利润。
该策略主要通过以下几个部分实现自动交易:
-
计算布林带的上轨、下轨:通过计算close的n周期标准差,得出布林带通道的上下轨。
-
长短期趋势判断:计算长期300周期和短期20周期的SMA,判断股票总体趋势和当前阶段趋势。
-
买入信号:当close突破布林带下轨,且长期SMA在上方、短期SMA开始上涨时,认为是区间低点,产生买入信号。
-
卖出信号:当close突破布林带上轨,且长期SMA在下方、短期SMA开始下跌时,认为是区间高点,产生卖出信号。
-
使用OCO委托组保证止损和止盈。
通过这样的设计,可以在符合大趋势的情况下,自动识别短期调整买入时机和超买高点卖出时机,实现趋势交易策略。
该策略具有以下几点优势:
-
自动识别趋势, 不需要人工判断,降低了操作难度。
-
系统地捕捉短期调整的买入时机,避免错过低点。
-
系统地识别超买高点的卖出时机,及时套现获利。
-
同时设置止损和止盈点,可以有效控制风险。
-
可以过滤掉大部分无效交易信号,提高胜率。
-
可以趋势跟踪,及时调整仓位。
-
策略思路清晰易理解,容易进行后续优化。
该策略也存在一些风险需要注意:
-
标的股票选择不当,可能导致无法跟踪趋势。
-
参数设定不当,可能导致交易频率过高或错过交易时机。
-
突发事件造成趋势反转,可能导致亏损扩大。
-
止损点设置过近,可能导致止损过频繁。
-
交易量不足,可能导致无法完全成交。
-
回测周期短,可能导致过拟合。
对应措施包括:选择流动性好、趋势明显的股票;调整参数以达到最佳效果;关注重大消息防范反转;适当放宽止损点;评估真实交易量;扩大回测周期测试稳定性。
该策略可以从以下几个方向进行优化:
-
优化参数,如布林带周期、标准差倍数、移动平均线周期等,找到最佳参数组合。
-
增加止损方式,如追踪止损、平均线止损等,进一步控制风险。
-
增加仓位管理,根据关键点调整仓位大小,管理资金利用效率。
-
结合交易量指标,避免低量的无效突破。
-
结合相对强弱指标,确定买入卖出的大方向。
-
增加机器学习算法,实现参数的自动优化和策略评估。
-
组合其他策略,形成多策略组合,提高稳定性。
通过这些优化,可以进一步增强策略的效果和稳定性。
该策略整体思路清晰易理解,通过系统地捕捉短期低点买入和高点卖出的时机,可以有效跟踪股票趋势,在控制风险的前提下获得较好的收益。策略可以通过参数优化、止损方式改进、仓位管理等进行进一步提升,在实盘中有很大的应用潜力。该策略为自动化趋势交易提供了一个良好的基础框架。
||
This strategy implements automated trend following trading by calculating Bollinger Bands to identify dips and peaks and using long-term and short-term moving averages to determine the overall trend direction. The core idea is to buy dips and sell peaks according to the prevailing trend.
The key components of the strategy are:
-
Calculate Bollinger Bands with upper and lower bands based on close price and standard deviation.
-
Determine long-term and short-term trend using 300-period and 20-period SMA.
-
Generate buy signal when close breaks below lower band while long SMA is above and short SMA turns up.
-
Generate sell signal when close breaks above upper band while long SMA is below and short SMA turns down.
-
Use OCO orders to set stop loss and take profit.
With this design, the strategy can automatically identify dip buying and peak selling opportunities along the major trend direction.
The advantages of this strategy include:
-
Automated trend detection without manual judgment.
-
Systematically capture dips for buying opportunities.
-
Systematically identify peak selling opportunities for profit taking.
-
Effective risk control using stop loss and take profit.
-
Filter out invalid signals to improve win rate.
-
Flexible trend following by position adjustment.
-
Clear logic and easy to understand and optimize.
The main risks to consider:
-
Inappropriate security selection could fail the trend tracking.
-
Improper parameter tuning may cause overtrading or missed trades.
-
Trend reversal from sudden events may lead to larger losses.
-
Stop loss too tight may cause excessive stops.
-
Insufficient liquidity may prevent full execution.
-
Overfitting with insufficient backtesting period.
The solutions include: select liquid stocks with clear trends; optimize parameters; watch out for news; relax stop loss; evaluate real trading volume; expand backtest period.
Some ways to optimize the strategy:
-
Optimize parameters like Bollinger period, standard deviation multiplier and moving average periods.
-
Add stop loss methods like trailing stop or moving average stop to better control risks.
-
Incorporate position sizing based on key levels to improve capital utilization efficiency.
-
Add volume filter to avoid invalid breakouts with low volume.
-
Add relative strength indicator to determine buy/sell bias.
-
Introduce machine learning for automatic parameter tuning and strategy evaluation.
-
Combine with other strategies to create multi-strategy portfolio for greater robustness.
These optimizations can further enhance the strategy's performance and stability.
The strategy offers a clear and understandable approach to systematically buy dips and sell peaks along the trend. With proper risk control, it has good profit potential. Further improvements can be made via parameter tuning, stop loss modification, position sizing, etc. The strategy serves as a solid foundation for automated trend following trading.
[/trans]
Strategy Arguments
| Argument | Default | Description |
|---|---|---|
| v_input_1 | 15 | length |
| v_input_2 | 1.25 | mult |
| v_input_3 | 300 | longMAPeriod |
| v_input_4 | 20 | shortMAPeriod |
Source (PineScript)
/*backtest
start: 2023-09-23 00:00:00
end: 2023-10-23 00:00:00
period: 3h
basePeriod: 15m
exchanges: [{"eid":"Futures_Binance","currency":"BTC_USDT"}]
*/

//@version=3
strategy("Buy Dip Sell Rip Strategy", overlay=true)
source = close
length = input(15, minval=1)
mult = input(1.25, minval=0.001, maxval=50)
longMAPeriod = input(300, minval=5)
shortMAPeriod = input(20, minval=5)

basis = sma(source, length)
longMA = sma(source, longMAPeriod)
prevLongMA = sma(close[1],longMAPeriod)
shortMA = sma(source, shortMAPeriod)
dev = mult * stdev(source, length)

upper = basis + dev
lower = basis - dev

buyEntry = crossover(source, lower)
sellEntry = crossunder(source, upper)

if (source > lower and source[1] < lower)
    if (longMA < source  and shortMA>source)
        strategy.entry("BBandLE", strategy.long, stop=lower, oca_name="BollingerBands",  comment="BBandLE")
    else
        strategy.close("BBandSE")
else
    strategy.cancel(id="BBandLE")

if (source > upper and source[1] < upper)
    if (longMA > source  and shortMA < source)
        strategy.entry("BBandSE", strategy.short, stop=upper, oca_name="BollingerBands",  comment="BBandSE")
    else
        strategy.close("BBandLE")
else
    strategy.cancel(id="BBandSE")

//plot(strategy.equity, title="equity", color=red, linewidth=2, style=areabr)
Detail
https://www.fmz.com/strategy/430031
Last Modified
2023-10-24 13:54:18
