Name
趋势跟踪型双均线策略Trend-Following-Dual-Moving-Average-Strategy
Author
ChaoZhang
Strategy Description
[trans]
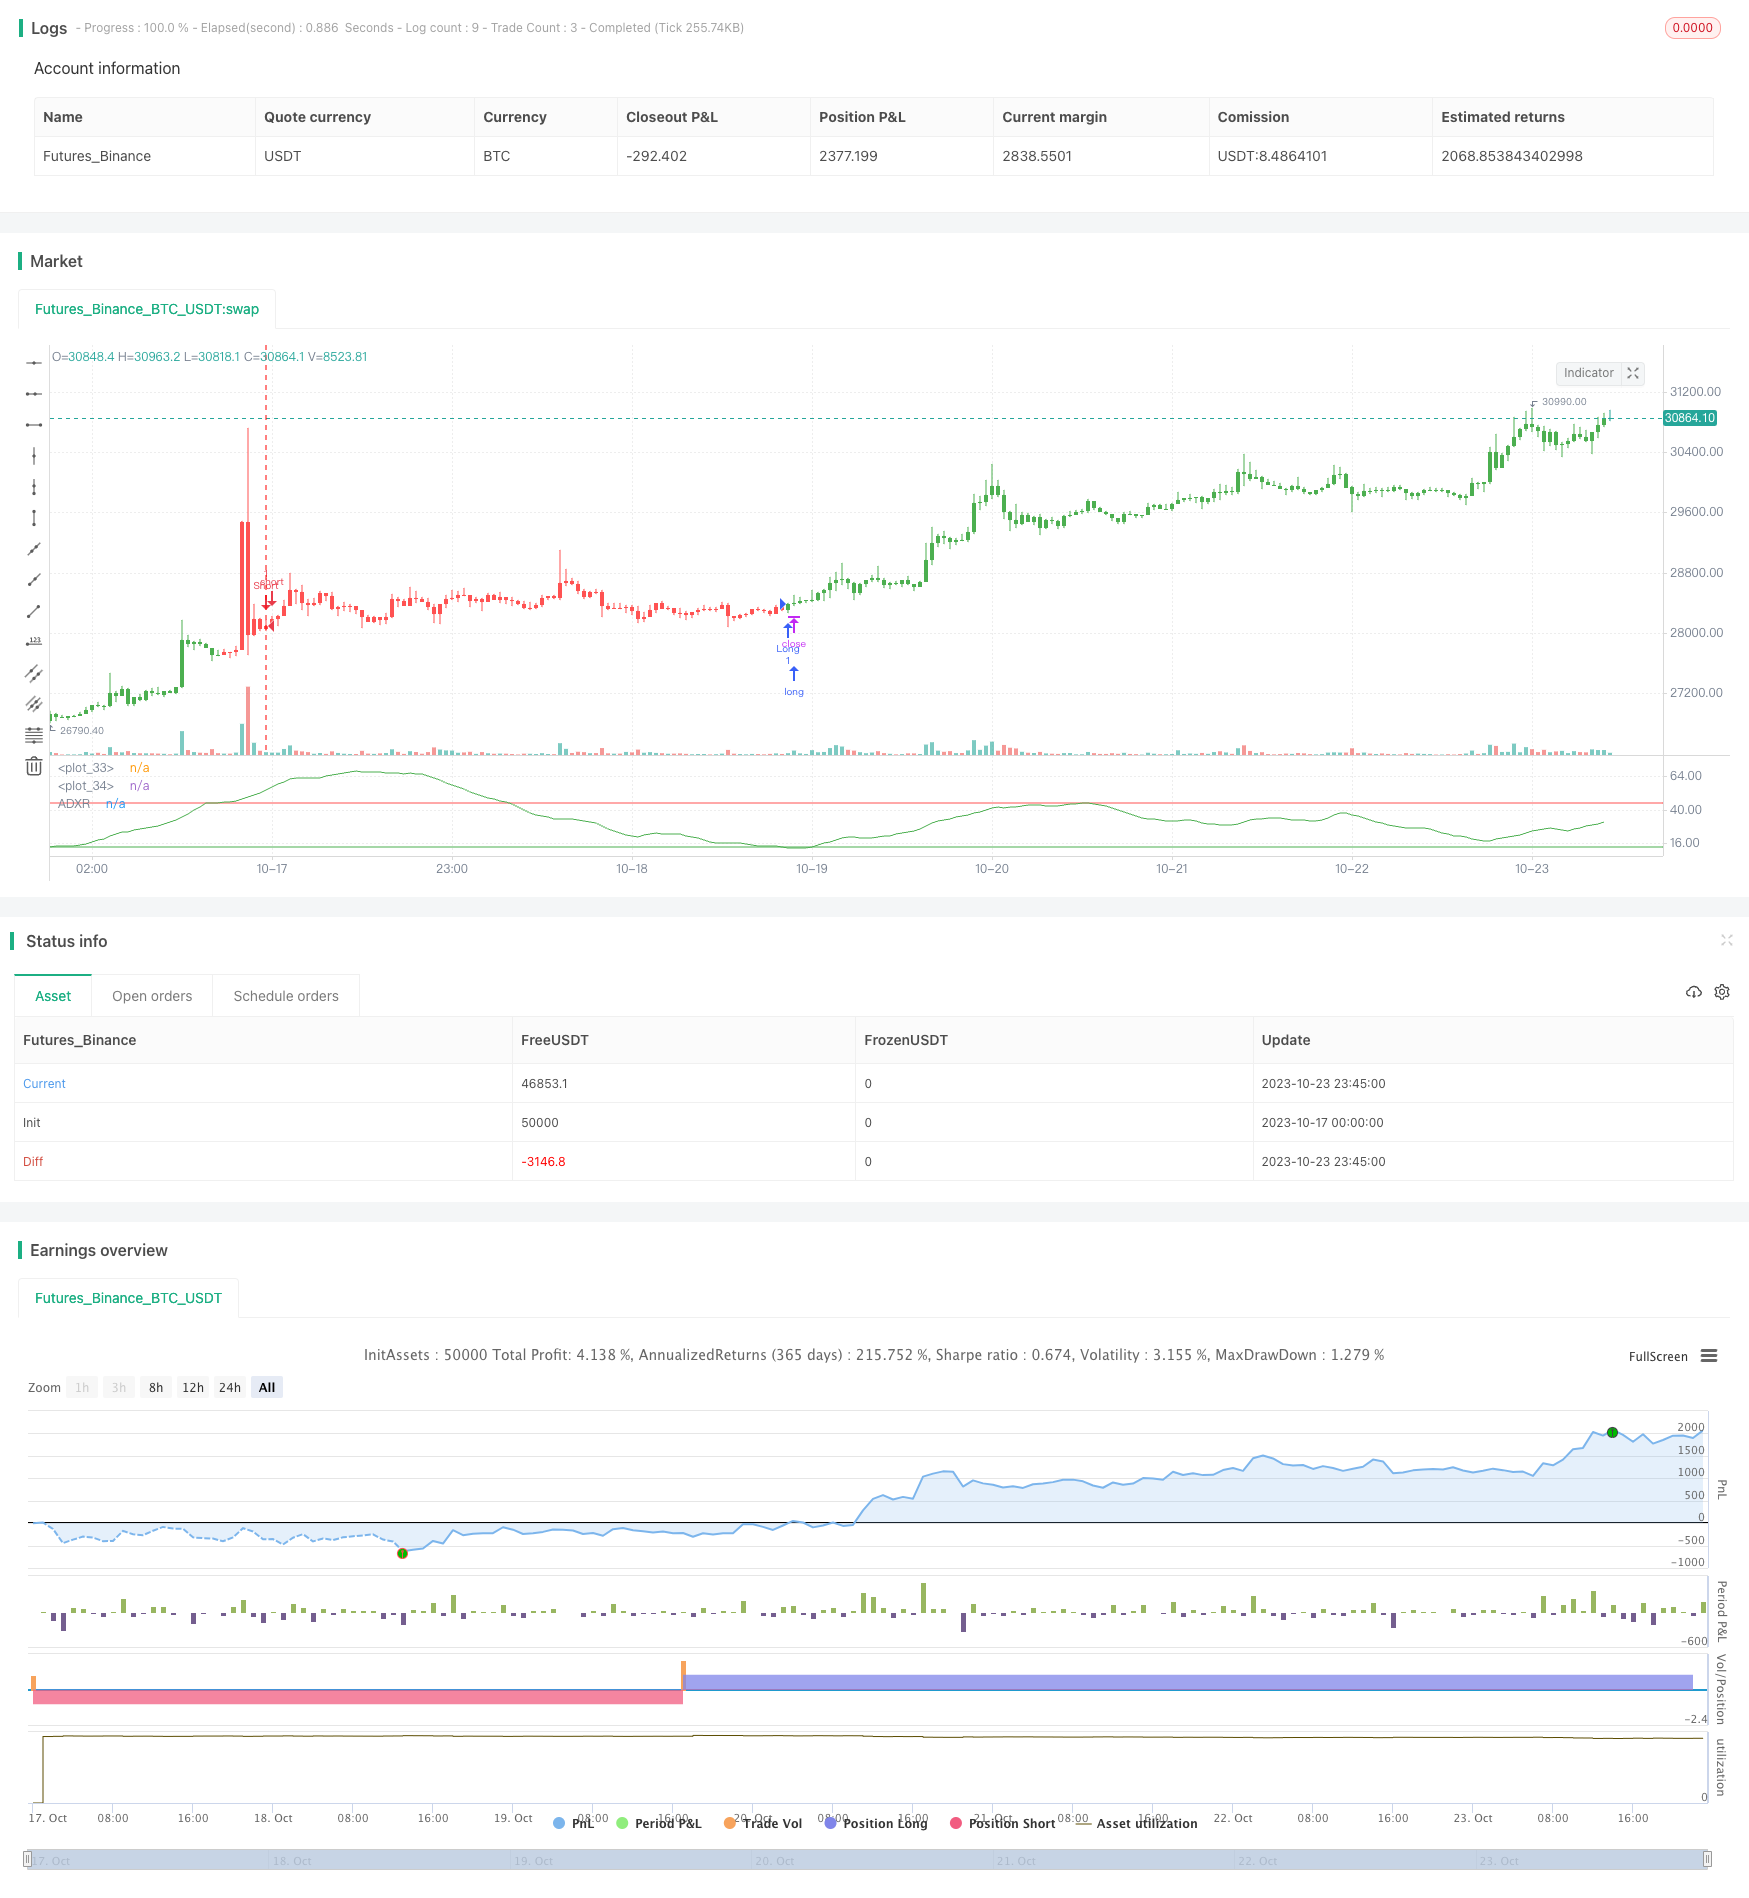
本策略运用平均方向指数评级指标(ADXR)来识别市场趋势,并结合双均线形成交易信号,属于典型的趋势跟踪型策略。ADXR指标能够有效识别趋势的变化,双均线则可以进一步过滤掉部分虚假信号。本策略适用于如股票、外汇等趋势性较强的市场,可在震荡行情中获取较好的收益。
-
计算ADXR指标值。其中ADX表示平均方向指数,反映趋势的力度;ADXR对ADX进行平滑处理,能更好地显示趋势。
-
设置ADXR指标的双阈值,当ADXR上穿第一个阈值时看涨,下穿第二个阈值时看跌。这表明当前处于趋势状态。
-
根据ADXR信号判断持仓方向。若ADXR上穿第一个阈值,做多;若ADXR下穿第二个阈值,做空。
-
结合双均线过滤信号。只有当价位于快线上方时做多,价位于慢线下方时做空。此过滤可以避免趋势反转时的误交易。
-
根据持仓方向绘制K线颜色。做多为绿色,做空为红色。
-
ADXR指标平滑价格变动,能有效识别趋势,较好地避免震荡市的调整带来的交易风险。
-
双均线过滤可降低回撤,避免趋势反转带来的亏损。
-
结合趋势指标和双均线,既保证了交易随趋势进行,又控制了风险,非常适合趋势性市场。
-
策略思路清晰易懂,参数设置灵活,可按需调整,适合不同市场环境。
-
ADXR指标参数设置不当可能导致无法及时捕捉趋势转换,应根据具体市场谨慎设置ADXR参数。
-
双均线参数设置不当也可能导致过滤过多信号而错过交易机会,应根据市场调整双均线参数。
-
任何指标都可能发出错误信号,应结合较大级别趋势进行验证,避免被套。
-
震荡趋势中应降低仓位规模,防止亏损扩大。
-
可以结合其他指标对ADXR信号进行验证,如MACD,布林带等,提高信号准确率。
-
可以添加止损策略,如移动止损、时间止损等,控制单笔亏损。
-
可以根据市场变化优化参数,如在降低市场效率时采用更长周期均线,在高效市场中缩短均线周期等。
-
可以结合资金管理和仓位管理策略,如固定份额、马丁格尔等,控制整体风险。
本策略整体来看是一个典型的趋势跟踪策略,使用ADXR指标辅助确定趋势方向,双均线过滤减少回撤。策略优点是简单清晰,易于实施,可根据不同市场环境进行参数调整。但任何技术指标都可能出现错误信号,此策略也存在一定风险,需要注意防范埋伏的暗流,应结合趋势及资金管理策略来控制风险。如果参数优化得当,本策略可以获得较好的风险收益比,适合追踪趋势性较强的市场。
||
This strategy uses the Average Directional Movement Index Rating (ADXR) to identify market trends and combines dual moving averages to generate trading signals. It belongs to a typical trend following strategy. The ADXR indicator can effectively identify changes in trends, and the dual moving averages can further filter out some false signals. This strategy is suitable for trending markets such as stocks and forex to gain better returns in range-bound markets.
-
Calculate the ADXR indicator value. ADX reflects the strength of the trend; ADXR smoothes ADX and better displays the trend.
-
Set dual thresholds for the ADXR indicator. When ADXR crosses above the first threshold, it indicates an uptrend. When it crosses below the second threshold, it indicates a downtrend.
-
Determine position direction based on ADXR signals. Go long when ADXR crosses above the first threshold, and go short when it crosses below the second threshold.
-
Filter signals with dual moving averages. Go long only when price is above the fast MA, and go short only when price is below the slow MA. This filtering avoids wrong trades during trend reversals.
-
Color the candlesticks based on position direction. Long positions are in green, short positions are in red.
-
ADXR smoothes price fluctuations and effectively identifies trends, avoiding trading risks from ranging markets.
-
Dual moving average filtering reduces drawdowns by avoiding losses from trend reversals.
-
Combining a trend indicator and moving averages ensures trading along trends while controlling risks, suitable for trending markets.
-
The strategy logic is simple and flexible for parameter tuning for different market environments.
-
Improper ADXR parameters may fail to timely capture trend changes. Parameters should be carefully set according to the specific market.
-
Improper moving average parameters may filter too many valid signals. Parameters should be adjusted per market conditions.
-
Any indicator may give wrong signals. Larger timeframe trends should be considered to avoid traps.
-
Reduce position sizing in ranging markets to limit losses.
-
Other indicators like MACD and Bollinger Bands can be added to confirm ADXR signals and improve accuracy.
-
Stop loss strategies like trailing stops and time stops can be added to limit per trade loss.
-
Optimize parameters based on market efficiency, like longer averaging periods for low efficiency markets.
-
Incorporate money management strategies like fixed fractional position sizing to better control overall risks.
This strategy is a typical trend following strategy, using ADXR to determine trend direction and dual moving averages to reduce drawdowns. The advantages lie in its simplicity and flexibility to be adapted for different markets. But any technical indicator can give false signals, and risks should be managed with trend filters and money management. With proper parameter tuning, this strategy can achieve good risk-adjusted returns for trending markets.
[/trans]
Strategy Arguments
| Argument | Default | Description |
|---|---|---|
| v_input_1 | 14 | Length ADX |
| v_input_2 | 14 | Length ADXR |
| v_input_3 | false | Trade reverse |
| v_input_4 | 13 | Signal1 |
| v_input_5 | 45 | Signal2 |
Source (PineScript)
/*backtest
start: 2023-10-17 00:00:00
end: 2023-10-24 00:00:00
period: 45m
basePeriod: 5m
exchanges: [{"eid":"Futures_Binance","currency":"BTC_USDT"}]
*/

//@version=2
////////////////////////////////////////////////////////////
//  Copyright by HPotter v1.0 04/05/2018
// The Average Directional Movement Index Rating (ADXR) measures the strength
// of the Average Directional Movement Index (ADX). It's calculated by taking
// the average of the current ADX and the ADX from one time period before
// (time periods can vary, but the most typical period used is 14 days).
// Like the ADX, the ADXR ranges from values of 0 to 100 and reflects strengthening
// and weakening trends. However, because it represents an average of ADX, values
// don't fluctuate as dramatically and some analysts believe the indicator helps
// better display trends in volatile markets.
//
// You can change long to short in the Input Settings
// WARNING:
//  - For purpose educate only
//  - This script to change bars colors.
////////////////////////////////////////////////////////////
fADX(Len) =>
    up = change(high)
    down = -change(low)
    trur = rma(tr, Len)
    plus = fixnan(100 * rma(up > down and up > 0 ? up : 0, Len) / trur)
    minus = fixnan(100 * rma(down > up and down > 0 ? down : 0, Len) / trur)
    sum = plus + minus
    100 * rma(abs(plus - minus) / (sum == 0 ? 1 : sum), Len)

strategy(title="Average Directional Movement Index Rating Backtest", shorttitle="ADXR")
LengthADX = input(title="Length ADX", defval=14)
LengthADXR = input(title="Length ADXR", defval=14)
reverse = input(false, title="Trade reverse")
Signal1 = input(13, step=0.01)
Signal2 = input(45, step=0.01)
hline(Signal1, color=green, linestyle=line)
hline(Signal2, color=red, linestyle=line)
xADX = fADX(LengthADX)
xADXR = (xADX + xADX[LengthADXR]) / 2
pos = iff(xADXR < Signal1, 1,
       iff(xADXR > Signal2, -1, nz(pos[1], 0)))
possig = iff(reverse and pos == 1, -1,
          iff(reverse and pos == -1, 1, pos))
if (possig == 1)
    strategy.entry("Long", strategy.long)
if (possig == -1)
    strategy.entry("Short", strategy.short)
barcolor(possig == -1 ? red: possig == 1 ? green : blue )
plot(xADXR, color=green, title="ADXR")
Detail
https://www.fmz.com/strategy/430125
Last Modified
2023-10-25 11:42:23
