Name
趋势跟踪型能量指标交易策略Trend-Following-Energy-Indicator-Trading-Strategy
Author
ChaoZhang
Strategy Description
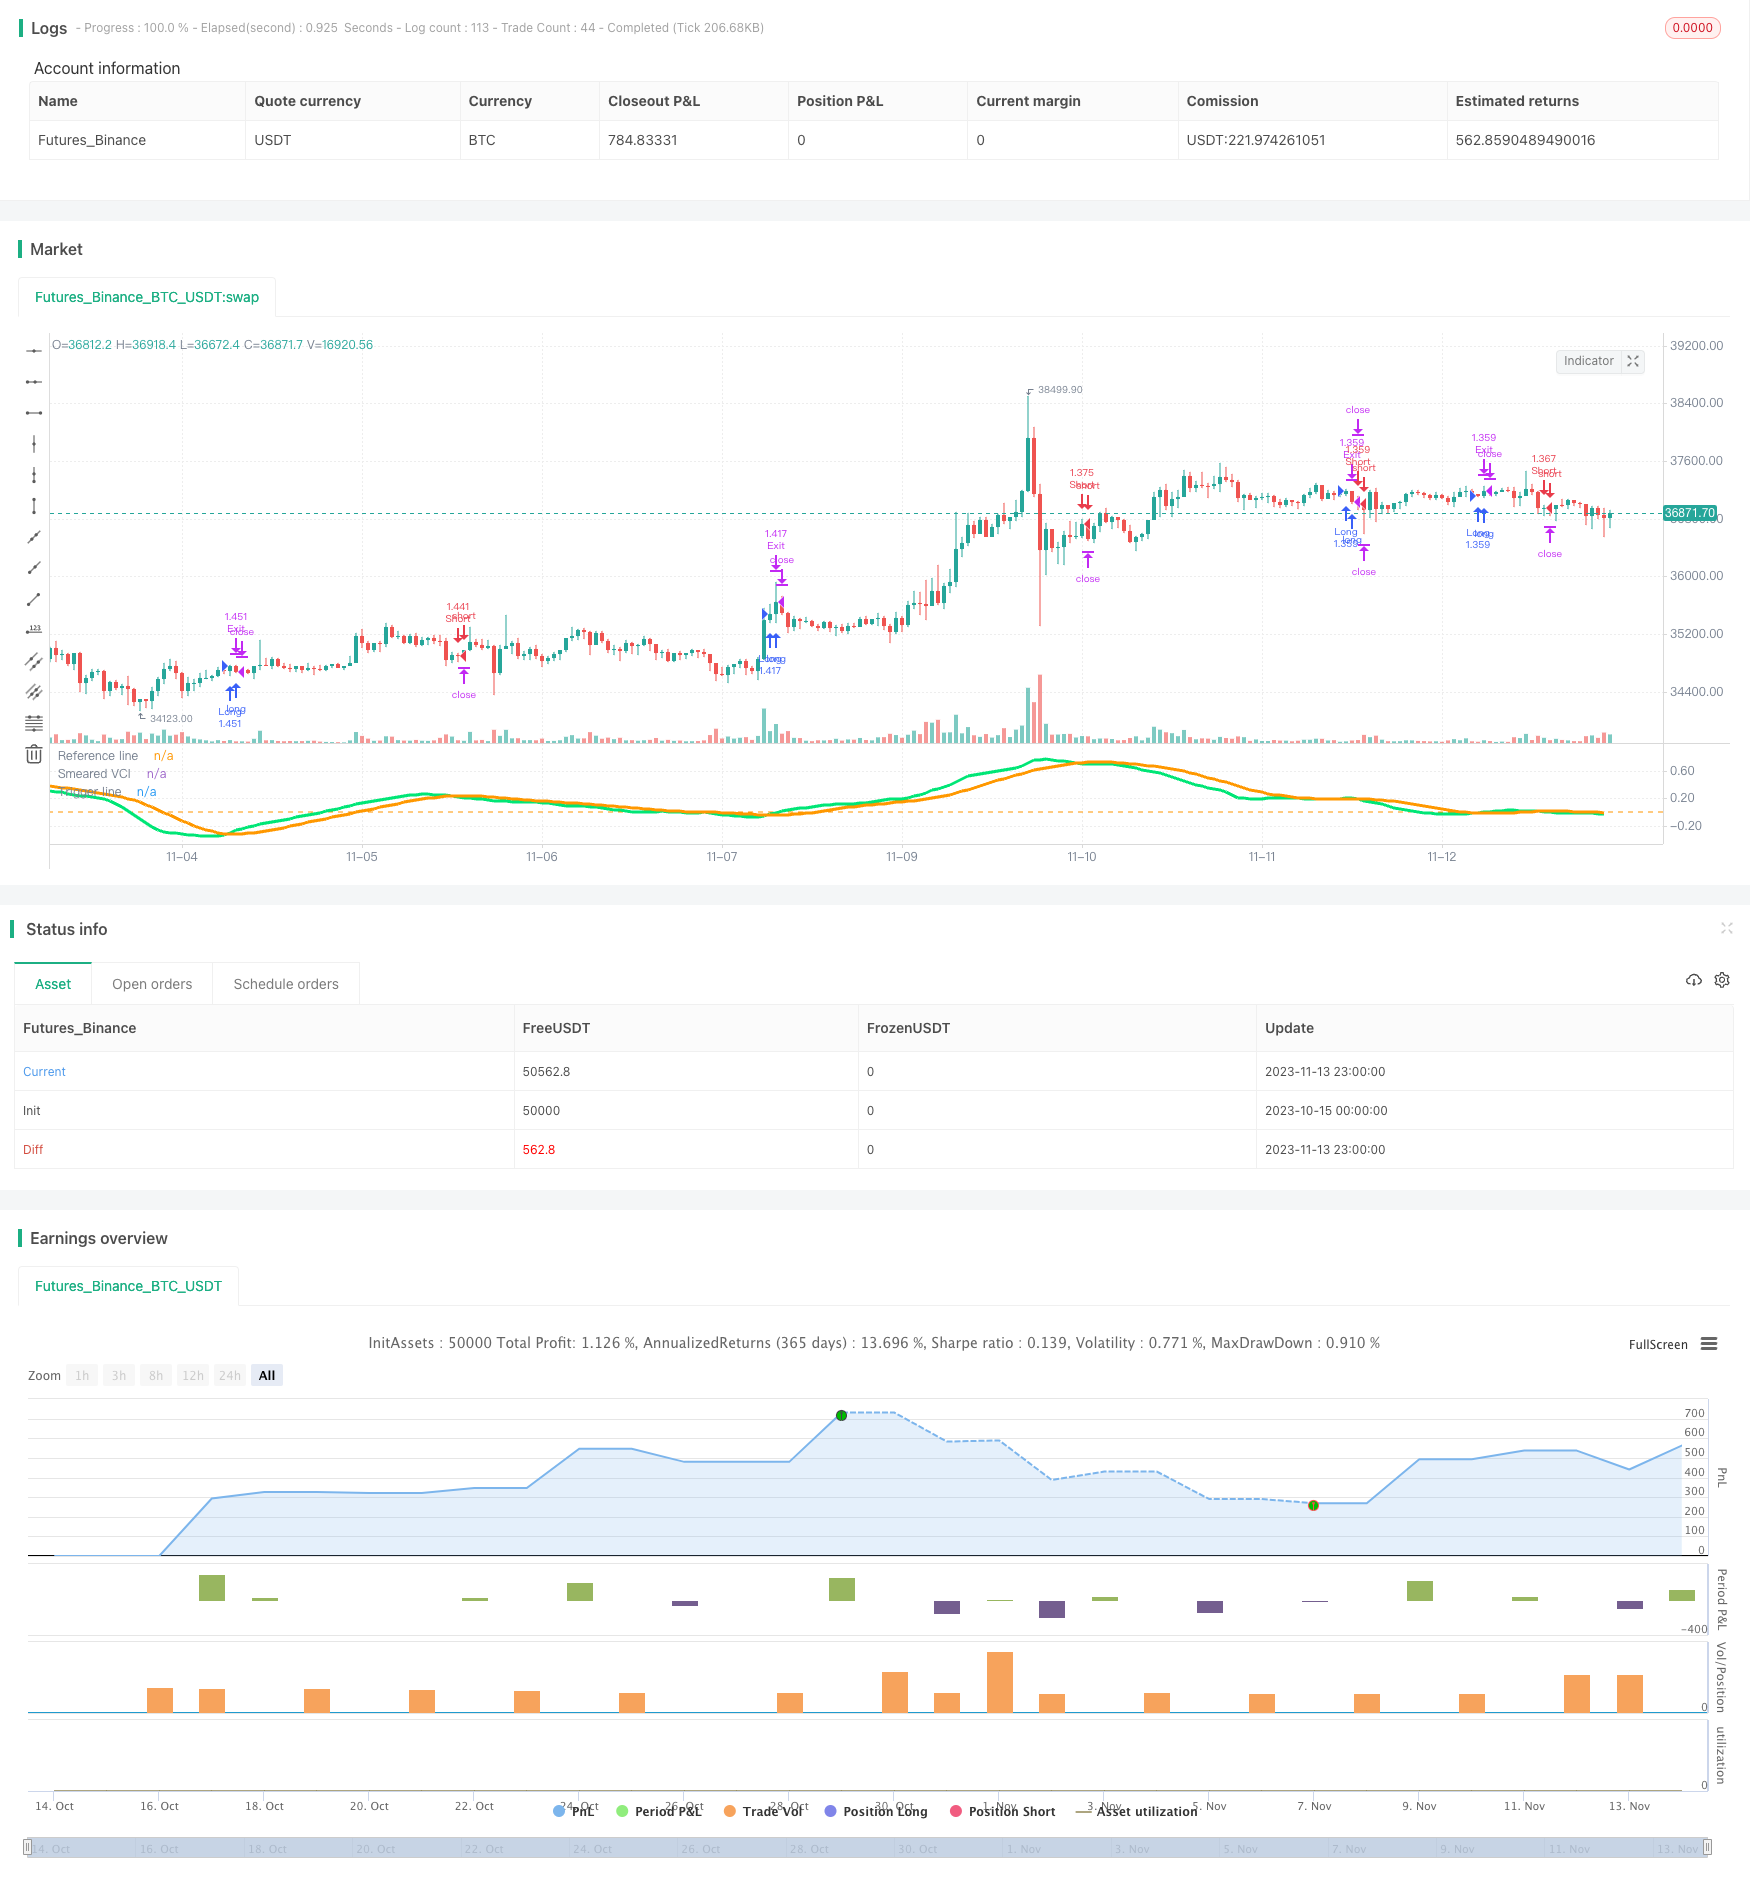
本策略是基于vitelot的Smeared变异通道指数(Smeared VCI)指标进行交易的趋势跟踪策略。该策略结合了移动平均线的趋势判断和变异通道指数的超买超卖判断,以捕捉价格的主要趋势方向。当价格运行进入超买或超卖状态时,进行反向操作以获利。
该策略使用vitelot的Smeared VCI指标判断趋势方向。Smeared VCI指标是在变异通道指数(VCI)的基础上进行平滑处理得到的。它由快速EMA、慢速EMA和平滑周期三个参数组成。当快速EMA高于慢速EMA时为看涨,否则为看跌。加入平滑处理后,可以过滤掉部分噪音。
策略中设置两个条件:
-
Smeared VCI上穿Trigger线为做多信号;下穿为做空信号
-
只在回测时间窗口内交易
当两条件同时满足时,进行做多或做空操作。平仓条件为止损或反向信号出现时平仓。
该策略具有以下优势:
-
使用了趋势跟踪型指标,可以有效跟踪趋势
-
加入平滑处理,可以减少假信号
-
采用时间窗口回测,可以针对特定时间内的行情进行测试
-
设置止损点,可以控制风险
-
采用指标参数进行多空判断,规则简单清晰
该策略也存在一些风险:
-
趋势判断可能发生错误,从而产生损失
-
指标参数设置不合适可能导致获利不佳
-
止损点设置过小可能导致小止损
-
回测时间窗口不合理可能导致测试结果偏差
-
多空切换过于频繁可能带来交易费用pressure
该策略可以从以下方面进行优化:
-
测试不同参数组合,寻找最佳参数
-
利用其他指标进行辅助判断,提高准确率
3.优化止损算法,实现动态跟踪止损
-
优化开仓条件,避免频繁交易
-
测试更长时间窗口,验证策略稳定性
-
结合交易量等其他因素,提高决策准确性
本策略整体来说是一个较为简单的趋势跟踪策略。它利用Smeared VCI指标判断趋势方向,在指标发送交易信号时开仓;通过止损来控制风险。该策略具有趋势跟踪能力,但也存在一定的风险。通过参数优化、止损优化以及辅助条件添加等方法,可以进一步完善该策略,使其成为一个稳定可靠的交易系统。
||
This strategy is a trend following strategy that trades based on the Smeared Variability Channel Index (Smeared VCI) indicator by vitelot. It combines the trend judgment of moving averages and the overbought/oversold judgment of VCI to capture the main trend direction of prices. When prices run into overbought or oversold status, reverse operations are taken to profit.
The strategy uses vitelot's Smeared VCI indicator to determine the trend direction. Smeared VCI indicator is a smoothed VCI (Variability Channel Index). It consists of three parameters: fast EMA, slow EMA and smoothing period. When fast EMA is above slow EMA, it is bullish, otherwise it is bearish. The smoothing process filters out some noise.
There are two conditions set in the strategy:
-
Smeared VCI crossing above Trigger line is long signal, and crossing below is short signal.
-
Only trade within the backtest time window.
When both conditions are met, long or short position will be taken. Exit when stop loss is triggered or reverse signal appears.
The advantages of this strategy are:
-
Using a trend following indicator, it can effectively track trends.
-
The smoothing process reduces false signals.
-
Backtesting within a time window focuses on specific period.
-
Stop loss set controls risk.
-
Using indicator parameters for long/short decision makes the rules simple and clear.
There are also some risks in this strategy:
-
Trend judgment may be wrong, leading to losses.
-
Improper indicator parameters setting may lead to poor profitability.
-
Too small stop loss setting may result in being stopped out quickly.
-
Improper backtest time window may lead to biased test results.
-
Too frequent long/short switching may bring about commission pressure.
The strategy can be optimized in the following aspects:
-
Test different parameter combinations to find the optimal parameters.
-
Use other indicators for confirmation to improve accuracy.
-
Optimize the stop loss algorithm to achieve dynamic trailing stop loss.
-
Optimize entry conditions to avoid overtrading.
-
Test longer time windows to verify stability.
-
Incorporate other factors like volume to improve decision accuracy.
In summary, this is a relatively simple trend following strategy. It uses the Smeared VCI indicator to determine trend direction and open positions when trading signals are generated. Risk is controlled by stop loss. The strategy has trend following capability but also has some risks. Further improvements can be made through parameter optimization, stop loss optimization and adding confirming conditions to make it a stable and reliable trading system.
[/trans]
Strategy Arguments
| Argument | Default | Description |
|---|---|---|
| v_input_1 | 5 | Fast EMA period |
| v_input_2 | 13 | Slow EMA period |
| v_input_3 | 34 | Smearing period |
| v_input_4 | 13 | Trigger line period |
| v_input_5 | 300 | SL Activation |
| v_input_6 | true | SL Trigger |
| v_input_7 | 150 | TP Activation |
| v_input_8 | true | TP Trigger |
| v_input_9 | true | From Month |
| v_input_10 | true | From Day |
| v_input_11 | 2019 | From Year |
| v_input_12 | 6 | To Month |
| v_input_13 | 19 | To Day |
| v_input_14 | 2030 | To Year |
Source (PineScript)
/*backtest
start: 2023-10-15 00:00:00
end: 2023-11-14 00:00:00
period: 1h
basePeriod: 15m
exchanges: [{"eid":"Futures_Binance","currency":"BTC_USDT"}]
*/

//@version=3
strategy("Smeared VCI Backtest", overlay=false, shorttitle="SVCI Backtest", default_qty_type = strategy.percent_of_equity, default_qty_value = 100, initial_capital = 10000, slippage = 5)
// Smeared Variability Channel Index
//    a variation of the VCI indicator of the same author.
// The orange line over the lime line is bullish;
// The lime line over the orange one is bearish.
//
// vitelot/yanez/Vts
// Feb 2019
//
src = close

ep1 = input(5, minval=1, title="Fast EMA period")
ep2 = input(13, minval=2, title="Slow EMA period")

sm = input(34, minval=1, title="Smearing period")
tp = input(13, minval=1, title="Trigger line period")

fixedSL = input(title="SL Activation", defval=300)
trailSL = input(title="SL Trigger", defval=1)
fixedTP = input(title="TP Activation", defval=150)
trailTP = input(title="TP Trigger", defval=1)

FromMonth = input(defval = 1, title = "From Month", minval = 1, maxval = 12)
FromDay   = input(defval = 1, title = "From Day", minval = 1, maxval = 31)
FromYear  = input(defval = 2019, title = "From Year", minval = 2017)
ToMonth   = input(defval = 6, title = "To Month", minval = 1, maxval = 12)
ToDay     = input(defval = 19, title = "To Day", minval = 1, maxval = 31)
ToYear    = input(defval = 2030, title = "To Year", minval = 2017)
start     = timestamp(FromYear, FromMonth, FromDay, 00, 00)  // backtest start window
finish    = timestamp(ToYear, ToMonth, ToDay, 23, 59)        // backtest finish window
startTimeOk()  => time >= start and time <= finish ? true : false // create function "within window of time" if statement true

atrP = 96

e1 = ema(src,ep1)
e2 = ema(src,ep2)

vci = (e1-e2)/atr(atrP)

svci = sma(vci,sm)
t = sma(svci,tp)

plot(svci, color=lime, linewidth=3, transp=0, title="Smeared VCI")
plot(t, color=orange, linewidth=3, transp=0, title="Trigger line")

hline(0, title="Reference line")

long = crossover(svci,t)
short = crossover(t,svci)

// === STRATEGY - LONG POSITION EXECUTION ===
strategy.entry("Long", strategy.long, when= long and startTimeOk())
strategy.exit("Exit", qty_percent = 100, loss=fixedSL, trail_offset=trailTP, trail_points=fixedTP)
strategy.exit("Exit", when= short)
// === STRATEGY - SHORT POSITION EXECUTION ===
strategy.entry("Short", strategy.short, when= short and startTimeOk())
strategy.exit("Exit", qty_percent = 100, loss=fixedSL, trail_offset=trailTP, trail_points=fixedTP)
strategy.exit("Exit", when= long)
Detail
https://www.fmz.com/strategy/432234
Last Modified
2023-11-15 17:36:46
