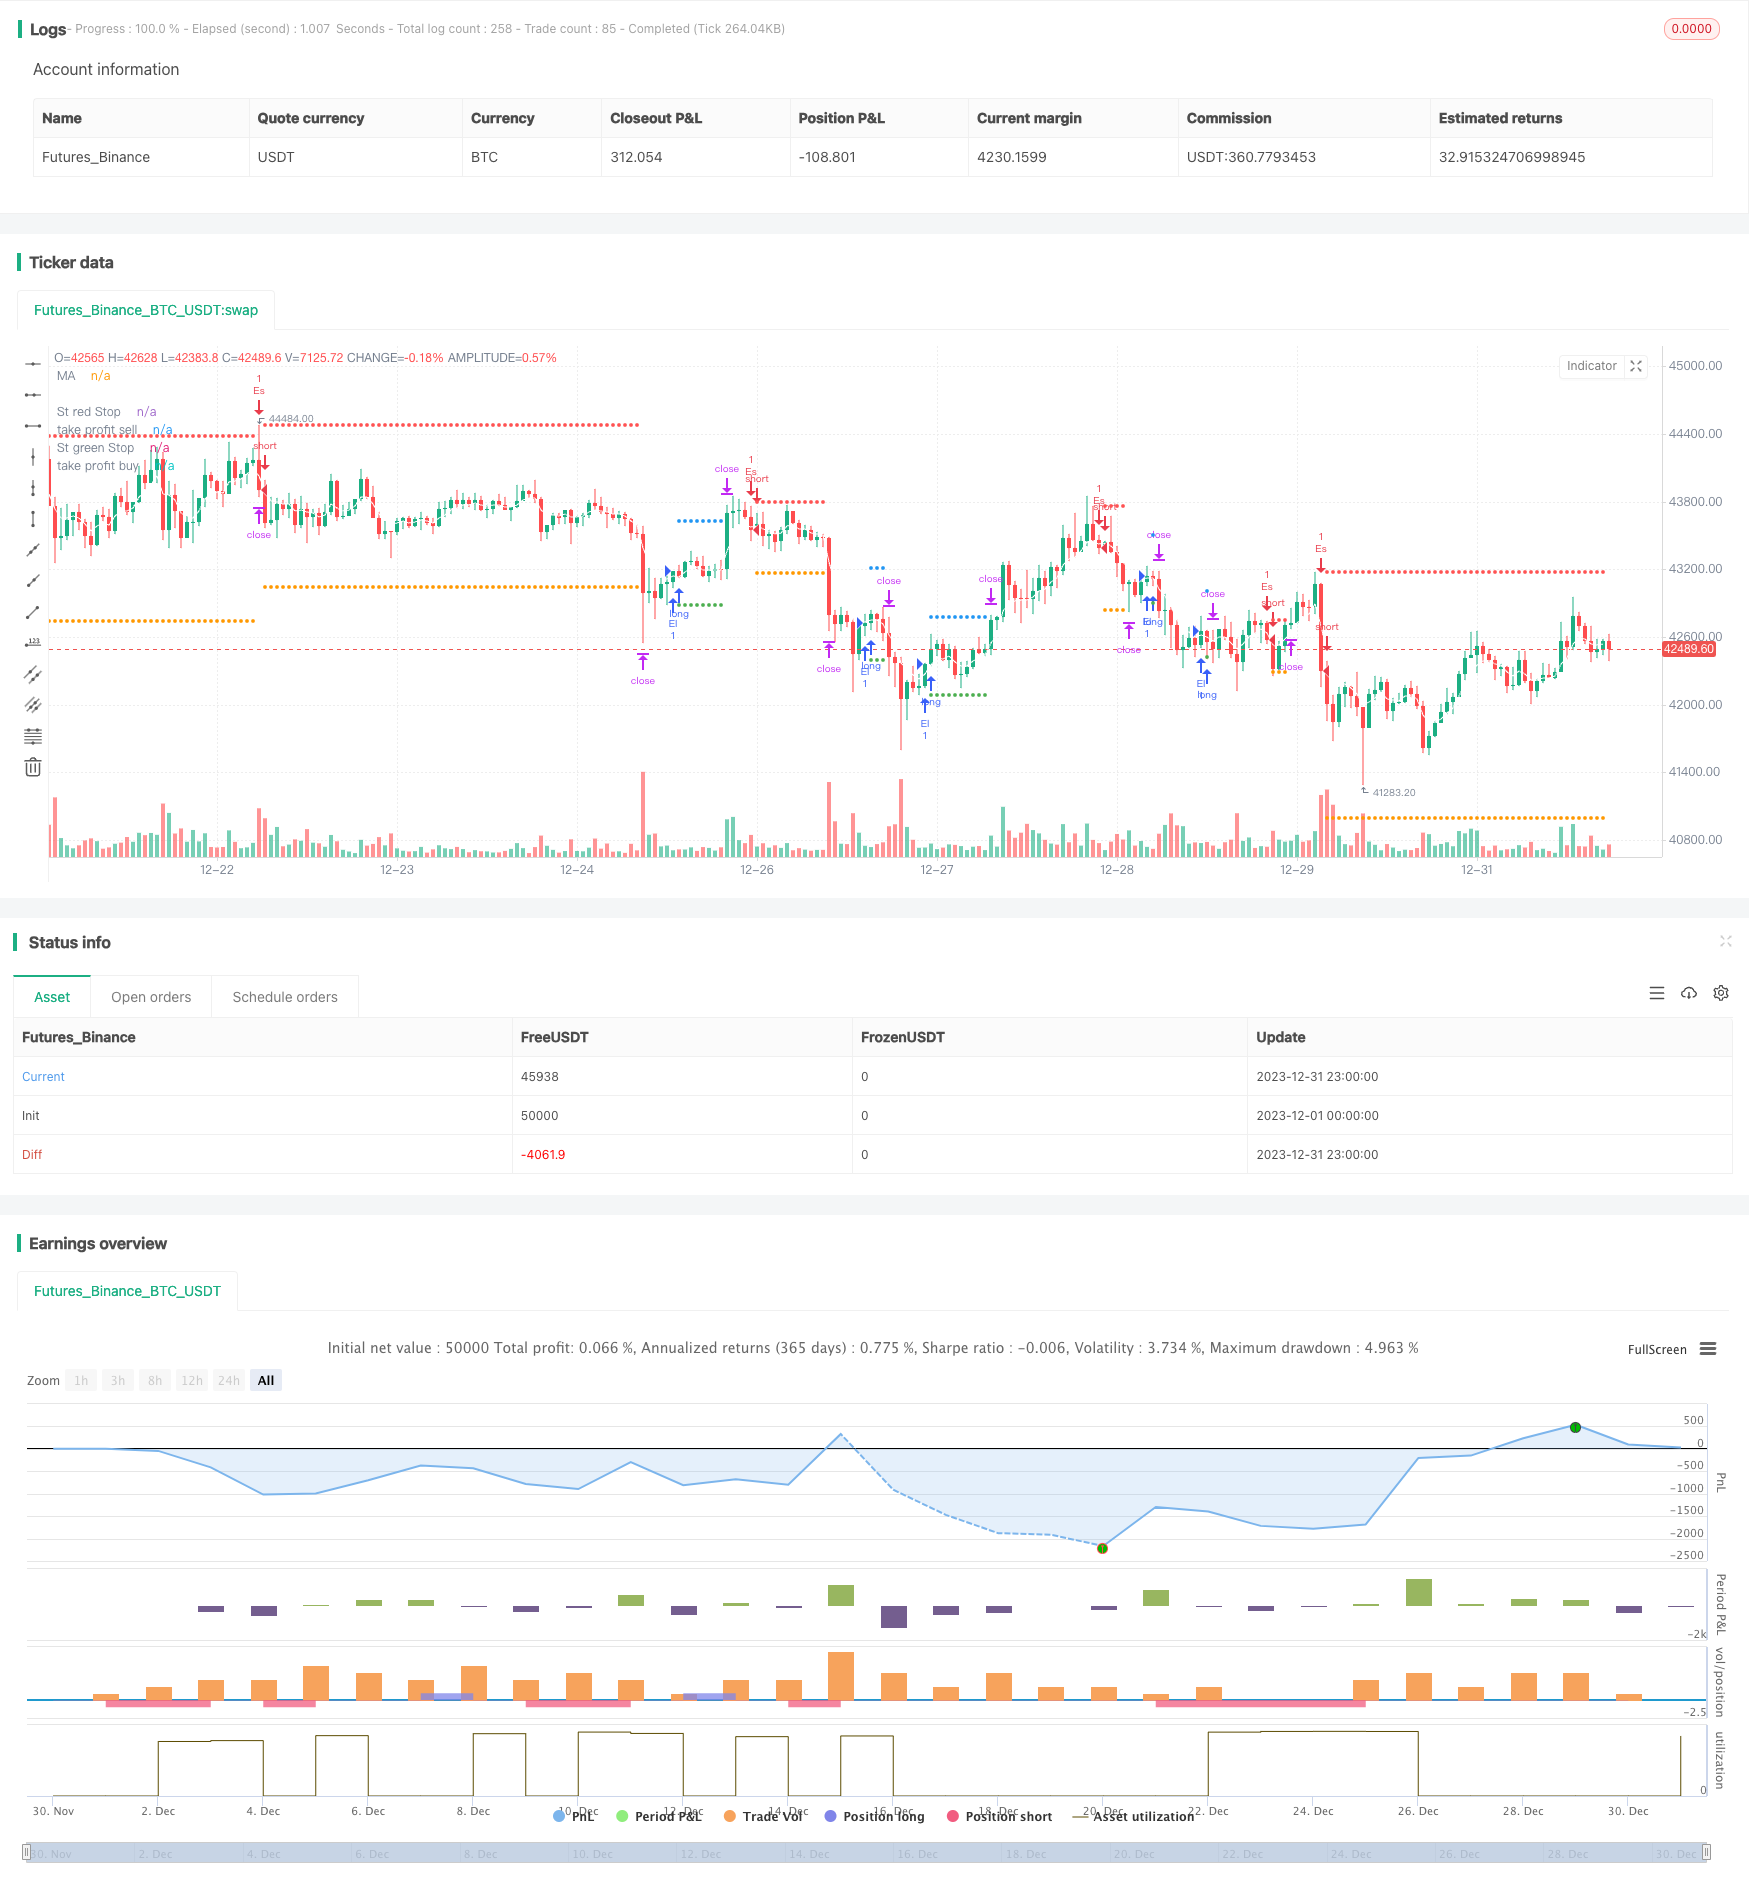
Name
跨界短线突破反转5EMA策略Cross-Border-Short-Term-Breakthrough-Reversal-5EMA-Strategy
Author
ChaoZhang
Strategy Description

该策略是一个短线量化策略,主要用于高频交易。策略会同时判断多头和空头信号,可以进行双向交易。当价格突破5EMA指标时产生交易信号,根据突破的方向进入做多或做空头寸。
策略优势在于捕捉短线价格反转机会,快速进入场内。风险主要来自于假突破造成的损失。可通过优化参数降低损失风险。
-
使用5周期EMA指标判断价格短期趋势
-
判断价格是否突破EMA指标
-
价格从上向下突破EMA时,产生卖出信号
-
价格从下向上突破EMA时,产生买入信号
-
设置止损和止盈点,限制单笔损失
由于EMA指标能够有效判断短期趋势,当价格出现明显反转时能快速捕捉交易机会。5EMA的参数较为灵活,对市场反应迅速,适合高频交易。
- 反应迅速,适合高频捕捉短线交易机会
- 双向交易,可以同时做多做空
- 止损止盈设置合理,单笔损失有限制
- 简单的参数设置,容易实现策略优化
- 假突破风险造成不必要损失
- 优化EMA周期参数,确保指标稳定
- 交易频率过高容易追高杀跌
- 限制每天最大交易次数
- 优化EMA指标参数,寻找最佳周期组合
- 增加 filter 减少假突破概率
- 限制每天最大交易次数
- 结合其他指标判断趋势方向
本策略总体来说是一个非常实用的短线突破策略。利用EMA指标判断价格反转非常简单有效,是量化交易的一个重要工具。通过参数优化和风控设置,可以大幅提高策略胜率,值得推荐。
||
This article will introduce a short-term reversal trading strategy based on the 5EMA indicator. The strategy mainly uses the 5EMA indicator to judge the price trend and reverse trades when the price breaks through the EMA.
This is a short-term quantitative strategy, mainly used for high-frequency trading. The strategy will simultaneously judge bullish and bearish signals and can trade in both directions. Trading signals are generated when prices break through the 5EMA indicator, and long or short positions are entered according to the direction of the breakthrough.
The advantage of the strategy is to capture short-term price reversal opportunities and quickly enter the market. The main risk comes from losses caused by false breakouts. Risk can be reduced by optimizing parameters.
-
Use 5-period EMA indicator to determine short-term price trend
-
Judge whether the price breaks through the EMA indicator
-
When the price breaks through the EMA from top to bottom, a sell signal is generated.
-
When the price breaks through the EMA from bottom to top, a buy signal is generated.
-
Set stop loss and take profit to limit single loss
Since the EMA indicator can effectively determine short-term trends, it can quickly capture trading opportunities when prices show significant reversals. The 5EMA parameter is relatively flexible and responds quickly to the market, making it suitable for high-frequency trading.
- Fast response, suitable for high-frequency capturing of short-term trading opportunities
- Two-way trading, can be long and short at the same time
- Reasonable stop loss and take profit settings, single loss limited
- Simple parameter settings, easy to optimize strategies
- Unnecessary losses caused by false breakout risks
- Optimize EMA cycle parameters to ensure indicator stability
- Excessive trading frequency can easily chase highs and kill lows
- Limit maximum number of trades per day
- Optimize EMA indicator parameters to find the best cycle portfolio
- Increase filter to reduce false breakout probability
- Limit maximum number of trades per day
- Combine other indicators to determine trend direction
In general, this is a very practical short-term breakout strategy. Using EMA indicators to determine price reversals is very simple and effective, and an important tool for quantitative trading. Through parameter optimization and risk control settings, the win rate of strategies can be greatly improved, which is highly recommended.
[/trans]
Strategy Arguments
| Argument | Default | Description |
|---|---|---|
| v_input_string_1 | 0 | (?Trade Direction Set)Trade Direction: Both |
| v_input_int_1 | 4 | (?Maximum Number Of Trade)number Of trade |
| v_input_bool_1 | true | (?Ema Set)Enable EMa 1 Plot On/Off |
| v_input_int_2 | 5 | Ema Length |
| v_input_source_1_close | 0 | Ema Source: close |
| v_input_float_1 | 1.5 | (?Tp/SL)take profit |
Source (PineScript)
/*backtest
start: 2023-12-01 00:00:00
end: 2023-12-31 23:59:59
period: 1h
basePeriod: 15m
exchanges: [{"eid":"Futures_Binance","currency":"BTC_USDT"}]
*/

// This Pine Script™ code is subject to the terms of the Mozilla Public License 2.0 at https://mozilla.org/MPL/2.0/
// © samscripter

//@version=5
strategy("5 ema strategy",overlay = true,process_orders_on_close = true)

// Choose trade direction

t_dir = input.string("Both", title="Trade Direction",options=["Long", "Short", "Both"],group = 'Trade Direction Set')

long_side  = t_dir == "Long" or t_dir == "Both"
short_side = t_dir == "Short" or t_dir == "Both"

// number of trade
mx_num =input.int(4,title = 'number Of trade',group = 'Maximum Number Of Trade')
var hi =0.0
var lo =0.0

var group_ma1="Ema Set"

//Ema 1
on_ma=input.bool(true,"Enable EMa 1 Plot On/Off"  ,group =group_ma1)
ma_len= input.int(5, minval=1, title="Ema Length",group =group_ma1)
ma_src = input.source(close, title="Ema Source"   ,group = group_ma1)
ma_out = ta.ema(ma_src, ma_len)

// buy and sell ema condition
plot(on_ma?ma_out:na, color=color.white, title="MA")


if close>ma_out and open>ma_out and low>ma_out and high>ma_out
    lo:=low

if close<ma_out and open<ma_out and low<ma_out and high<ma_out
    hi:=high

// condition when price is crossunder lo take sell and when price crossoing hi take buy
var buyp_sl =float(na)
var sellp_sl =float(na)

//count number trade since day stra
var count_buysell=0

if  close>hi[1]
    if strategy.position_size==0 and count_buysell<mx_num and long_side
        strategy.entry('El',strategy.long,comment = 'Long')
        count_buysell:=count_buysell+1
        buyp_sl:=math.min(low,low[1])
    hi:=na
if  close<lo[1]
    if strategy.position_size==0 and count_buysell<mx_num and short_side
        strategy.entry('Es',strategy.short,comment = 'short')
        count_buysell:=count_buysell+1
        sellp_sl:=math.max(high,high[1])
    lo:=na

//take profit multiply

tpnew = input.float(title="take profit", step=0.1, defval=1.5, group='Tp/SL')


//stop loss previous candle high and previous candle low
buy_sl = ta.valuewhen(strategy.position_size != 0 and strategy.position_size[1] == 0,buyp_sl , 0)
sell_sl= ta.valuewhen(strategy.position_size != 0 and strategy.position_size[1] == 0,sellp_sl, 0)

//take profit
takeProfit_buy = strategy.position_avg_price - ((buy_sl - strategy.position_avg_price) *tpnew)
takeProfit_sell = strategy.position_avg_price - ((sell_sl - strategy.position_avg_price) *tpnew)


//  Submit exit orders
if strategy.position_size > 0
    strategy.exit(id='XL', stop=buy_sl,limit=takeProfit_buy,comment_loss = 'Long Sl',comment_profit = 'Long Tp')

if strategy.position_size < 0
    strategy.exit(id='XS', stop=sell_sl,limit=takeProfit_sell,comment_loss = 'Short Sl',comment_profit = 'Short Tp')

//plot data
plot(series=strategy.position_size < 0 ?sell_sl : na, style=plot.style_circles, color=color.red, linewidth=2, title="St red Stop")
plot(series=strategy.position_size > 0 ?buy_sl  : na, style=plot.style_circles, color=color.green, linewidth=2, title="St green Stop")


// plot take profit
plot(series=strategy.position_size < 0 ? takeProfit_sell : na, style=plot.style_circles, color=color.orange, linewidth=2, title="take profit sell")
plot(series=strategy.position_size > 0 ? takeProfit_buy: na, style=plot.style_circles, color=color.blue, linewidth=2, title="take profit buy")

if ta.change(time('D'))
    count_buysell:=0
Detail
https://www.fmz.com/strategy/440433
Last Modified
2024-01-30 15:30:19