Name
递归带动量交易策略Recursive-Momentum-Trading-Strategy
Author
ChaoZhang
Strategy Description
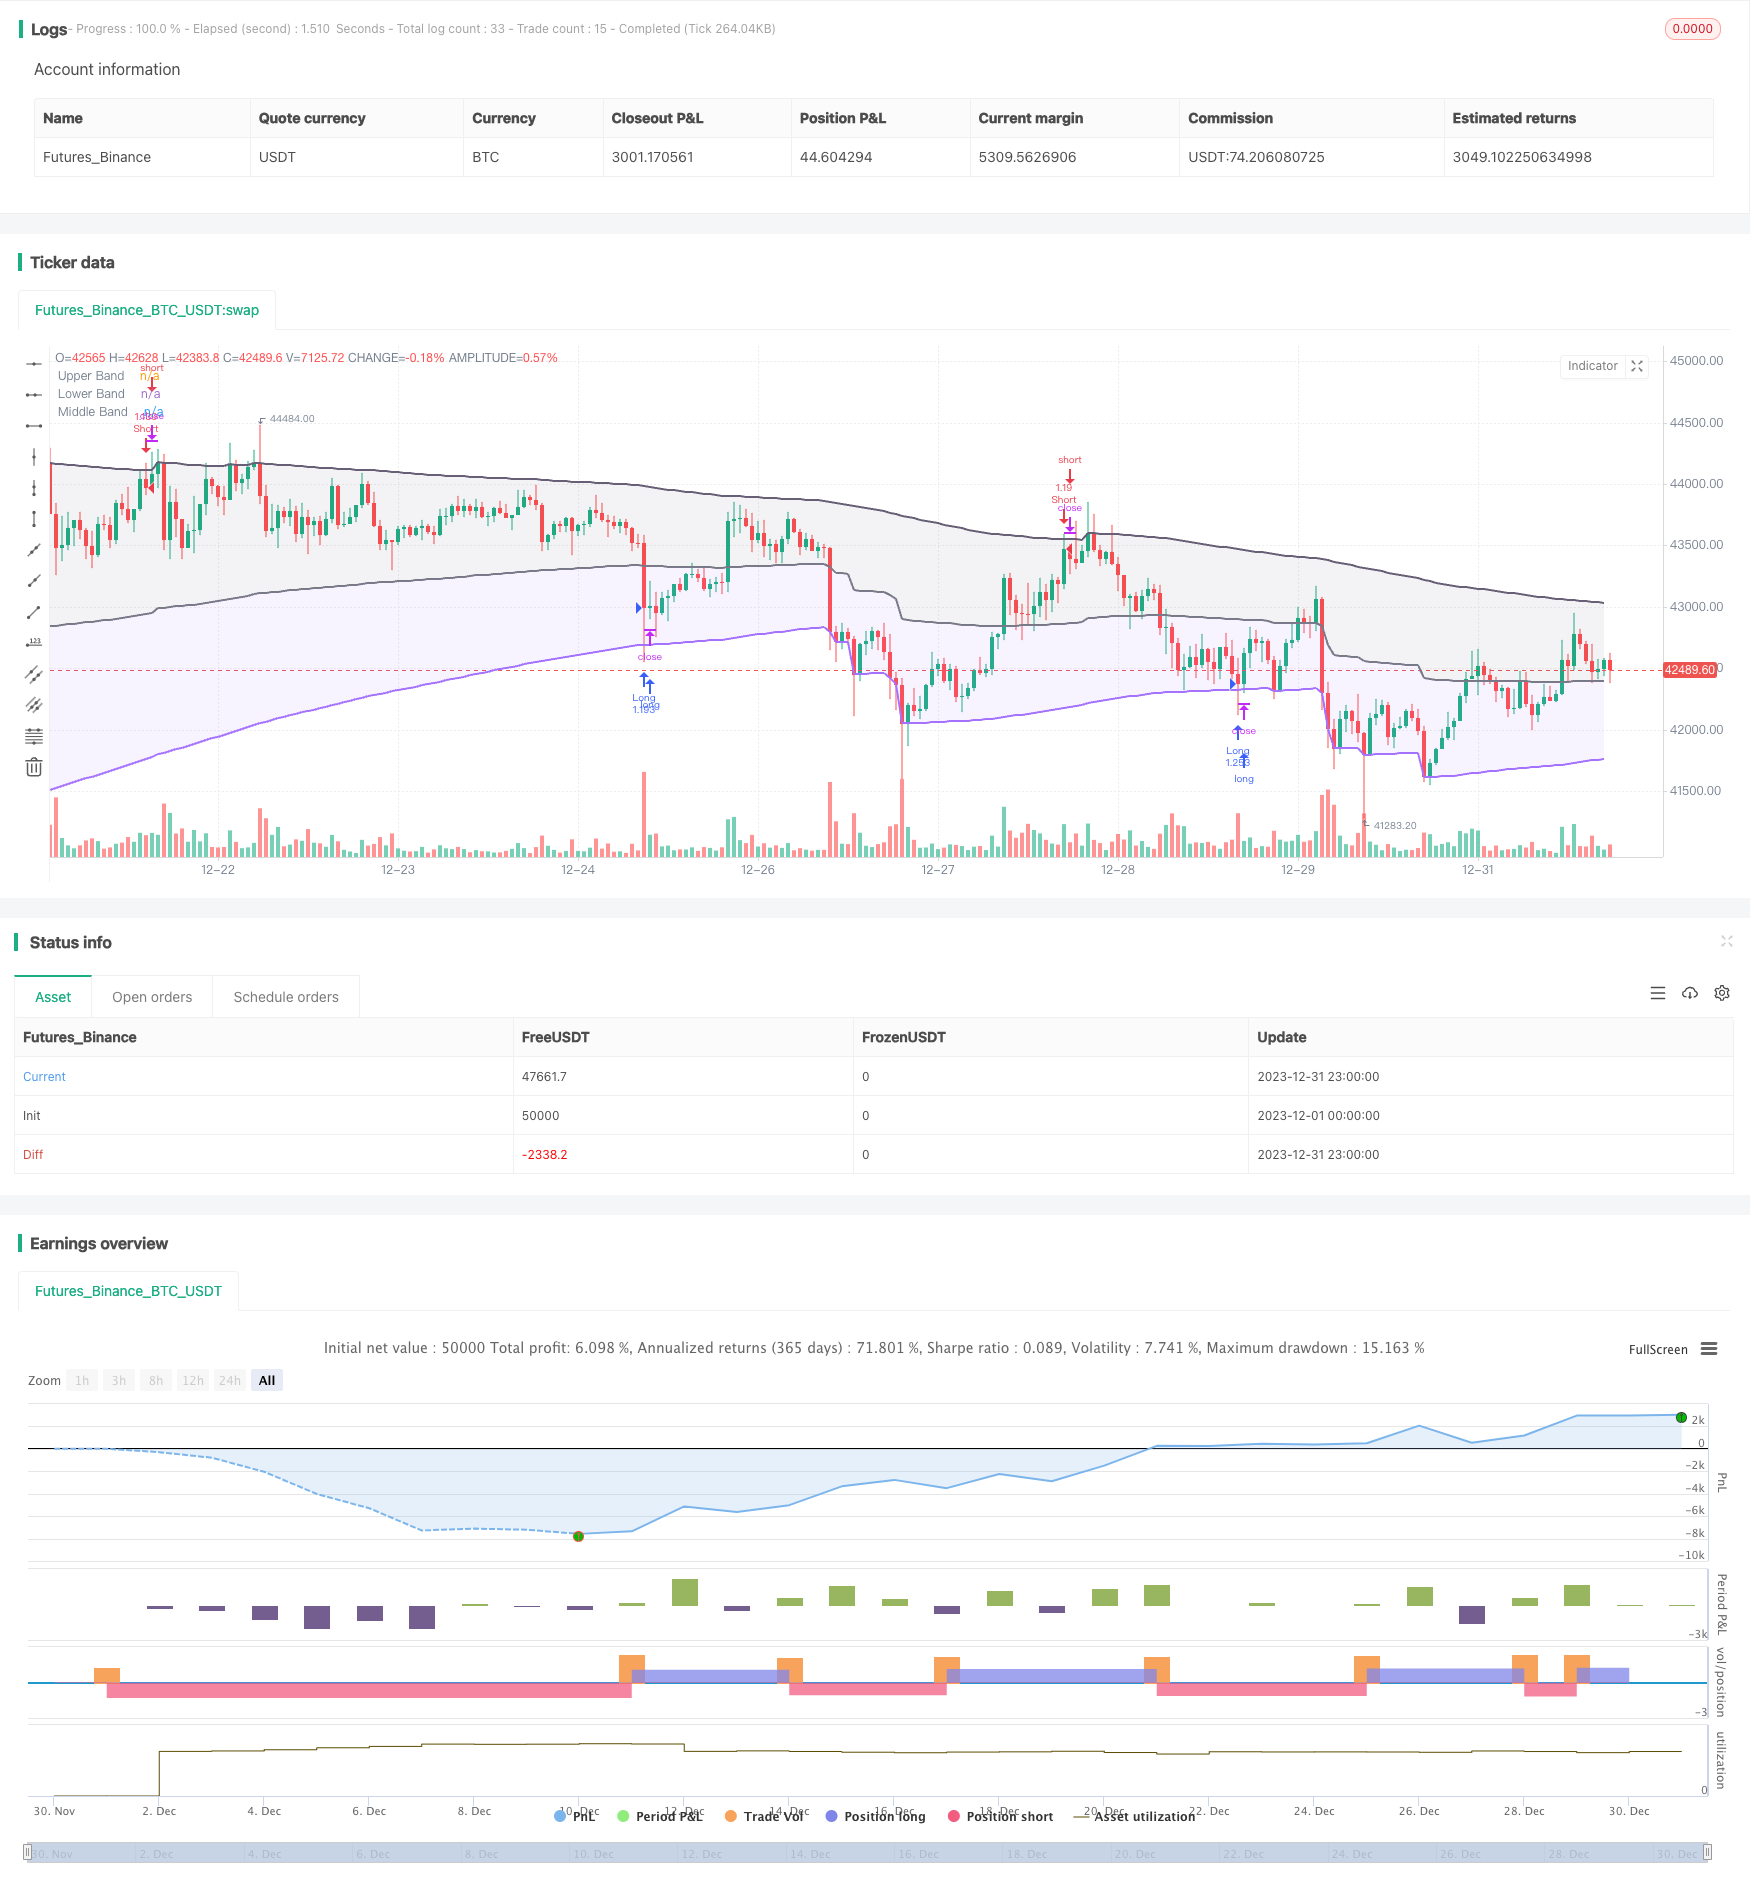
该策略是基于alexgrover开发的递归带指标的趋势跟踪和突破策略。策略利用递归带指标判断价格趋势和关键支持阻力位,结合动量条件过滤假突破,实现低频率但高质量的入场。
递归带指标由上带、下带和中线组成。指标的计算方式是:
上带 = 最大值(前一根K线的上带,收盘价 + n波动率)
下带 = 最小值(前一根K线的下带,收盘价 - n波动率)
中线 = (上带 + 下带)/ 2
其中n是一个缩放系数,波动率可以选择ATR、标准差、均价通道和特殊的RFV方法。长度参数控制指标的敏感度,数值越大,指标越不容易触发。
策略首先检测下带方向是否持续上行和上带方向是否持续下行,以滤除假突破。
当价格跌破下带时,做多;当价格超过上带时,做空。
此外,策略还设定了止损逻辑。
该策略具有如下优势:
- 利用递归框架,指标计算高效,避免重复计算
- 指标参数可调,能适应不同市场环境
- 结合趋势和突破,避免假突破
- 动量条件过滤,确保交易信号质量
该策略也存在一些风险:
- 参数设置不当可能导致交易频率过高或信号质量差
- 大周期趋势变化时,可能出现较大亏损
- 极端行情下滑点控制不足可能扩大损失
可以通过优化参数,设立止损,加大滑点来控制这些风险。
该策略还可以从以下几个方向进行优化:
- 结合多个周期指标,实现多时间框架交易
- 增加机器学习模块,实现参数自适应优化
- 增加量化关联分析,找到最佳的参数组合
- 利用深度学习预测价格路径,提升信号准确度
该策略总体来说是一个非常实用的高效趋势跟踪策略。它结合递归框架节省计算资源,运用趋势支持阻力判断大趋势方向,增加动量条件过滤假突破,从而确保交易信号质量。在参数调整和风险控制到位的情况下,可以获得较好的效果。值得进一步研究和优化,使之适应更加复杂的市场环境。
||
This strategy is a trend-following and breakout strategy based on the Recursive Bands indicator developed by alexgrover. It uses the Recursive Bands indicator to determine price trends and key support/resistance levels, combined with momentum conditions to filter out false breakouts, achieving low-frequency but high-quality entry signals.
The Recursive Bands indicator consists of an upper band, lower band and middle line. The indicator is calculated as:
Upper Band = Max(Previous bar's upper band, Close price + nVolatility) Lower Band = Min(Previous bar's lower band, Close price - nVolatility) Middle Line = (Upper Band + Lower Band)/2
Here n is a scaling coefficient, and volatility can be chosen from ATR, standard deviation, average true range or a special RFV method. The length parameter controls the sensitivity, larger values make the indicator trigger less frequently.
The strategy first checks if the lower band and upper band are trending in the same direction to avoid false breakouts.
When price breaks below the lower band, go long. When price breaks above the upper band, go short.
In addition, stop loss logic is implemented.
The advantages of this strategy are:
- Efficient indicator calculation using recursive framework, avoiding repeated computation
- Flexible parameter tuning to adapt to different market regimes
- Combining trend and breakout, avoiding false breakouts
- Momentum condition filters ensure signal quality
There are also some risks with this strategy:
- Improper parameter settings may lead to overtrading or poor signal quality
- May face large losses when major trend changes
- Insufficient slippage control in extreme moves may amplify losses
These risks can be managed by parameter optimization, implementing stop loss, increasing slippage threshold etc.
Some directions to optimize the strategy further:
- Incorporate indicators across multiple timeframes for robustness
- Add machine learning module for adaptive parameter optimization
- Conduct quantitative correlation analysis to find optimal parameter combinations
- Use deep learning to forecast price paths and improve signal accuracy
In summary, this is a very practical and efficient trend-following strategy. It combines the recursive framework for computational efficiency, uses trend support/resistance to determine major trends, adds momentum conditions to filter false breakouts and ensure signal quality. With proper parameter tuning and risk control, it can achieve good results. Worthy of further research and optimization to adapt to more complex market regimes.
[/trans]
Strategy Arguments
| Argument | Default | Description |
|---|---|---|
| v_input_int_1 | 260 | Length |
| v_input_1_close | 0 | Source: close |
| v_input_string_1 | 0 | Method: Classic |
| v_input_bool_1 | true | Bands Hold Direction |
| v_input_2 | 3 | lookback |
Source (PineScript)
/*backtest
start: 2023-12-01 00:00:00
end: 2023-12-31 23:59:59
period: 1h
basePeriod: 15m
exchanges: [{"eid":"Futures_Binance","currency":"BTC_USDT"}]
*/

// @version=5
// Original indicator by alexgrover
strategy('Extended Recursive Bands Strategy', overlay=true, commission_type=strategy.commission.percent,commission_value=0.06,default_qty_type =strategy.percent_of_equity,default_qty_value = 100,initial_capital =1000)
length = input.int(260, step=10, title='Length')
src = input(close, title='Source')
method = input.string('Classic', options=['Classic', 'Atr', 'Stdev', 'Ahlr', 'Rfv'], title='Method')
bandDirectionCheck = input.bool(true, title='Bands Hold Direction')
lookback = input(3)
//----
atr = ta.atr(length)
stdev = ta.stdev(src, length)
ahlr = ta.sma(high - low, length)
rfv = 0.
rfv := ta.rising(src, length) or ta.falling(src, length) ? math.abs(ta.change(src)) : rfv[1]
//-----
f(a, b, c) =>
    method == a ? b : c
v(x) =>
    f('Atr', atr, f('Stdev', stdev, f('Ahlr', ahlr, f('Rfv', rfv, x))))
//----
sc = 2 / (length + 1)
a = 0.
a := math.max(nz(a[1], src), src) - sc * v(math.abs(src - nz(a[1], src)))
b = 0.
b := math.min(nz(b[1], src), src) + sc * v(math.abs(src - nz(b[1], src)))
c = (a+b)/2

// Colors
beColor = #675F76
buColor = #a472ff

// Plots
pA = plot(a, color=color.new(beColor, 0), linewidth=2, title='Upper Band')
pB = plot(b, color=color.new(buColor, 0), linewidth=2, title='Lower Band')
pC = plot(c, color=color.rgb(120,123,134,0), linewidth=2, title='Middle Band')
fill(pC, pA, color=color.new(beColor,90))
fill(pC, pB, color=color.new(buColor,90))

// Band keeping direction
// By Adulari
longc = 0
shortc = 0
for i = 0 to lookback-1
    if b[i] > b[i+1]
        longc:=longc+1
    if a[i] < a[i+1]
        shortc:=shortc+1
bhdLong = if bandDirectionCheck
    longc==lookback
else
    true
bhdShort = if bandDirectionCheck
    shortc==lookback
else
    true

// Strategy
if b>=low and bhdLong
    strategy.entry(id='Long',direction=strategy.long)
if high>=a and bhdShort
    strategy.entry(id='Short',direction=strategy.short)

// TP at middle line
//if low<=c and strategy.position_size<0 and strategy.position_avg_price>close
    //strategy.exit(id="Short",limit=close)
//if high>=c and strategy.position_size>0 and strategy.position_avg_price<close
    //strategy.exit(id="Long",limit=close)
Detail
https://www.fmz.com/strategy/440558
Last Modified
2024-01-31 16:56:31
