Name
量化交易中的支撑阻力云形态指标Quant-Trading-Support-and-Resistance-Cloud-Indicator
Author
ChaoZhang
Strategy Description
该指标旨在识别市场中的关键支撑阻力位,并在图表上绘制支撑阻力云来表示这些位点之间的区域。该指标结合了统计分析和图形展示,能够辅助交易员判断趋势反转点和突破口,属于常用的辅助分析工具。
该指标的核心逻辑是统计计算一定时间周期内的最高价和最低价,以识别潜在的支撑和阻力位。计算公式如下:
- 统计输入周期内的最高价periodHigh和最低价periodLow
- 计算期间中间价periodCenter = (periodHigh+periodLow)/2
- 计算0.382回归线period0382 = periodLow + (periodHigh-periodLow)*0.382
- 计算0.618回归线period0618 = periodLow + (periodHigh-periodLow)*0.618
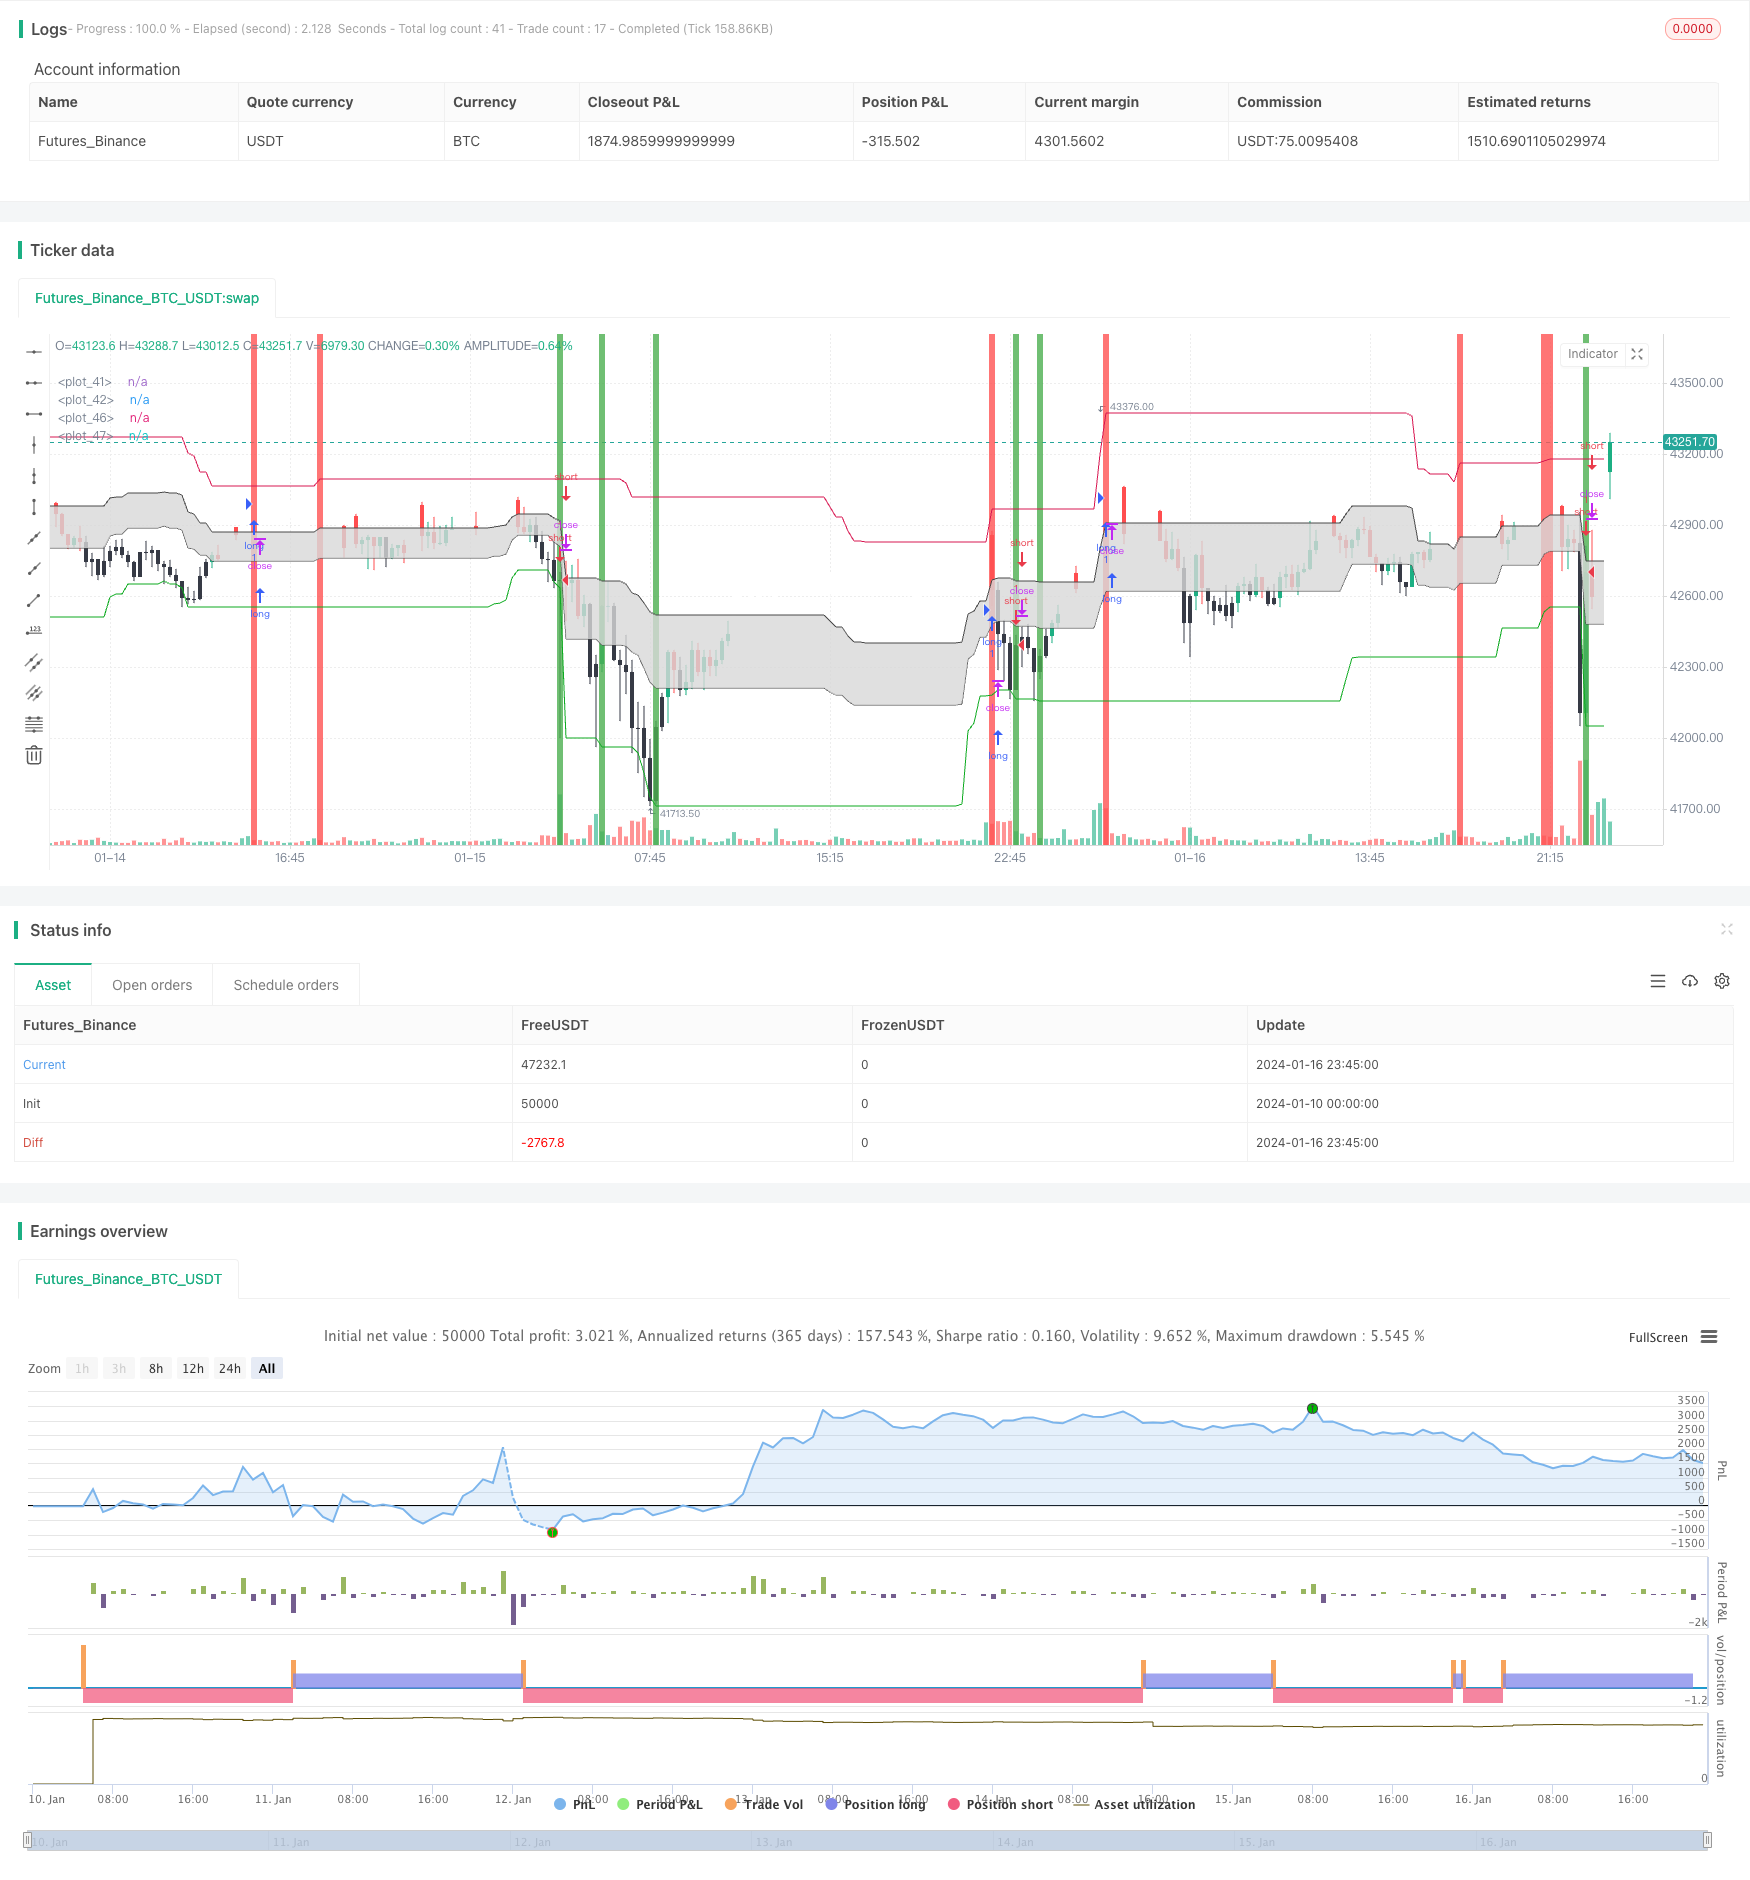
以上四条线即构成该指标的支撑阻力云的关键位点。指标采用填充颜色的方式在0.382线和0.618线之间填充云形状,直观显示波动区间和关键价格位。
当收盘价高于0.618线时, blockchain为白色,反之低于0.382线时为黑色,属于卖出和买入信号。该指标展示的支撑阻力云可以看作是潜在支撑阻力位的区间范围,价格突破这些上下界通常意味着趋势反转。
该支撑阻力云形态指标具有以下几个突出优势:
- 直观显示关键支撑阻力位与价格波动区间,辅助判断趋势和反转点
- 填充形态强调视觉效果,一目了然
- 参数设置简单,容易掌握和调整
- 可与其他指标组合使用,提高效果
- 适用于多种时间周期分析
需要注意的是,该指标也存在一些固有缺陷与使用风险:
- 平滑曲线可能滞后于价格变化
- 多空位判断可能出现误判
- 需结合其他指标诊断判断,避免单一依赖
- 需关注突破实体背离情况
- 参数设置不当可能影响效果
可以从以下几个维度继续优化该指标:
- 增加自适应参数设置功能
- 结合更多统计指标过滤误判
- 加入音频、消息提醒模块
- 增加回测分析评价模块
- 可视化参数调整模块
- 自定义指标组合模板储存功能
该支撑阻力云形态指标整合了统计分析与图形展示功能,能够有效辅助判断关键支撑阻力位与突破口。但也不能单独依赖,需要结合其他多种指标组合运用,方能发挥最大效用。可以从自适应参数设置、多指标过滤组合等维度进行优化升级,提高实用性。
||
This indicator aims to identify key support and resistance levels in the market and draw support and resistance clouds on the chart to represent the areas between these points. The indicator combines statistical analysis and graphical display to assist traders in determining trend reversal points and breakouts. It is a commonly used auxiliary analysis tool.
The core logic of this indicator is to statistically calculate the highest and lowest prices over a certain period of time to identify potential support and resistance levels. The calculation formulas are as follows:
- Statistically calculate the highest price periodHigh and the lowest price periodLow over the input cycle
- Calculate the mid-price of the period periodCenter = (periodHigh+periodLow)/2
- Calculate the 0.382 retracement period0382 = periodLow + (periodHigh-periodLow)*0.382
- Calculate the 0.618 retracement period0618 = periodLow + (periodHigh-periodLow)*0.618
The above four lines constitute the key points of the support/resistance cloud of this indicator. The indicator uses filled colors to fill cloud shapes between the 0.382 line and the 0.618 line, visually displaying the fluctuation range and key price levels.
When the closing price is above the 0.618 line, the bar color is white, and conversely when it is below the 0.382 line, the bar color is black, which belongs to sell and buy signals. The support/resistance cloud displayed by this indicator can be seen as the range of potential support/resistance levels. Prices breaking through these upper and lower boundaries usually mean a trend reversal.
This support/resistance cloud indicator has the following outstanding advantages:
- Intuitively displays key support/resistance levels and price fluctuation ranges to assist in judging trends and reversal points
- Filled shapes emphasize visual effects for clarity
- Simple parameter settings, easy to master and adjust
- Can be combined with other indicators to improve efficacy
- Applicable to multi-cycle analysis
It should be noted that this indicator also has some inherent deficiencies and risks:
- Smoothed curves may lag price changes
- Multi-empty position judgments may be misjudged
- Need to be combined with other indicators for diagnosis and judgment to avoid reliance on a single one
- Need to pay attention to piercing and envelope dilemmas
- Improper parameter settings may affect results
This indicator can be further optimized in the following aspects:
- Increase adaptive parameter setting functions
- Combine more statistical indicators to filter misjudgements
- Add audio, message reminder modules
- Increase backtesting analysis evaluation modules
- Visual parameter tuning modules
- Custom indicator portfolio template storage functions
This support/resistance cloud indicator integrates statistical analysis and graphical display functions. It can effectively assist in determining key support/resistance levels and breakouts. However, it cannot rely solely on itself. It needs to be combined with other multiple indicators to maximize its usefulness. It can be upgraded from adaptive parameter settings, multi-indicator filtering combinations and other dimensions to improve practicality.
[/trans]
Strategy Arguments
| Argument | Default | Description |
|---|---|---|
| v_input_1 | 50 | Entry Period: |
| v_input_2 | 25 | Exit period: |
| v_input_3 | 0.9999 | Sensitivity |
Source (PineScript)
/*backtest
start: 2024-01-10 00:00:00
end: 2024-01-17 00:00:00
period: 15m
basePeriod: 5m
exchanges: [{"eid":"Futures_Binance","currency":"BTC_USDT"}]
*/

//@version=3
strategy("[IND] rang3r", overlay=true)
entP = input(50, "Entry Period: ")
exP = input(25, "Exit period: ")
sensitivity = input(0.9999, "Sensitivity")
periodHigh = 0.0
periodLow = 0.0
epH = 0.0
epL = 0.0


//Entry Trades
for i = 1 to (entP+1)
    if i == 1
        periodHigh:=high[i]
    else
        if periodHigh < high[i]
            periodHigh:=high[i]


for i = 1 to (entP+1)
    if i == 1
        periodLow:=low[i]
    else
        if periodLow > low[i]
            periodLow:=low[i]

s = high[1] > periodHigh*sensitivity and open > close //and (close[1] > open[1] ? open[1] : close[1]) > close
l = low[1] < periodLow*(1/sensitivity) and close > open //and (close[1] > open[1] ? close[1] : open[1]) < close

strategy.entry("long", strategy.long, when=s)
strategy.entry("short", strategy.short, when=l)

bgcolor(l ? green : na)
bgcolor(s ? red : na)

periodCenter = (periodHigh+periodLow)/2
period0618 = (periodLow)+(periodHigh-periodLow)*0.618
period0382 = (periodLow)+(periodHigh-periodLow)*0.382

cloud1 = plot(period0382, color=#494949)
cloud2 = plot(period0618, color=#494949)

fill(cloud1, cloud2, color=#d8d8d8)

plot(periodHigh, color=#d81751)
plot(periodLow, color=#0daa20)
//plot(periodCenter, color=#494949)

bc = close > period0618 ? white : (close < period0382 ? black : na)

barcolor(bc)
Detail
https://www.fmz.com/strategy/439233
Last Modified
2024-01-18 15:30:46
