Name
量化折线策略Quantitative-Zigzag-Strategy
Author
ChaoZhang
Strategy Description
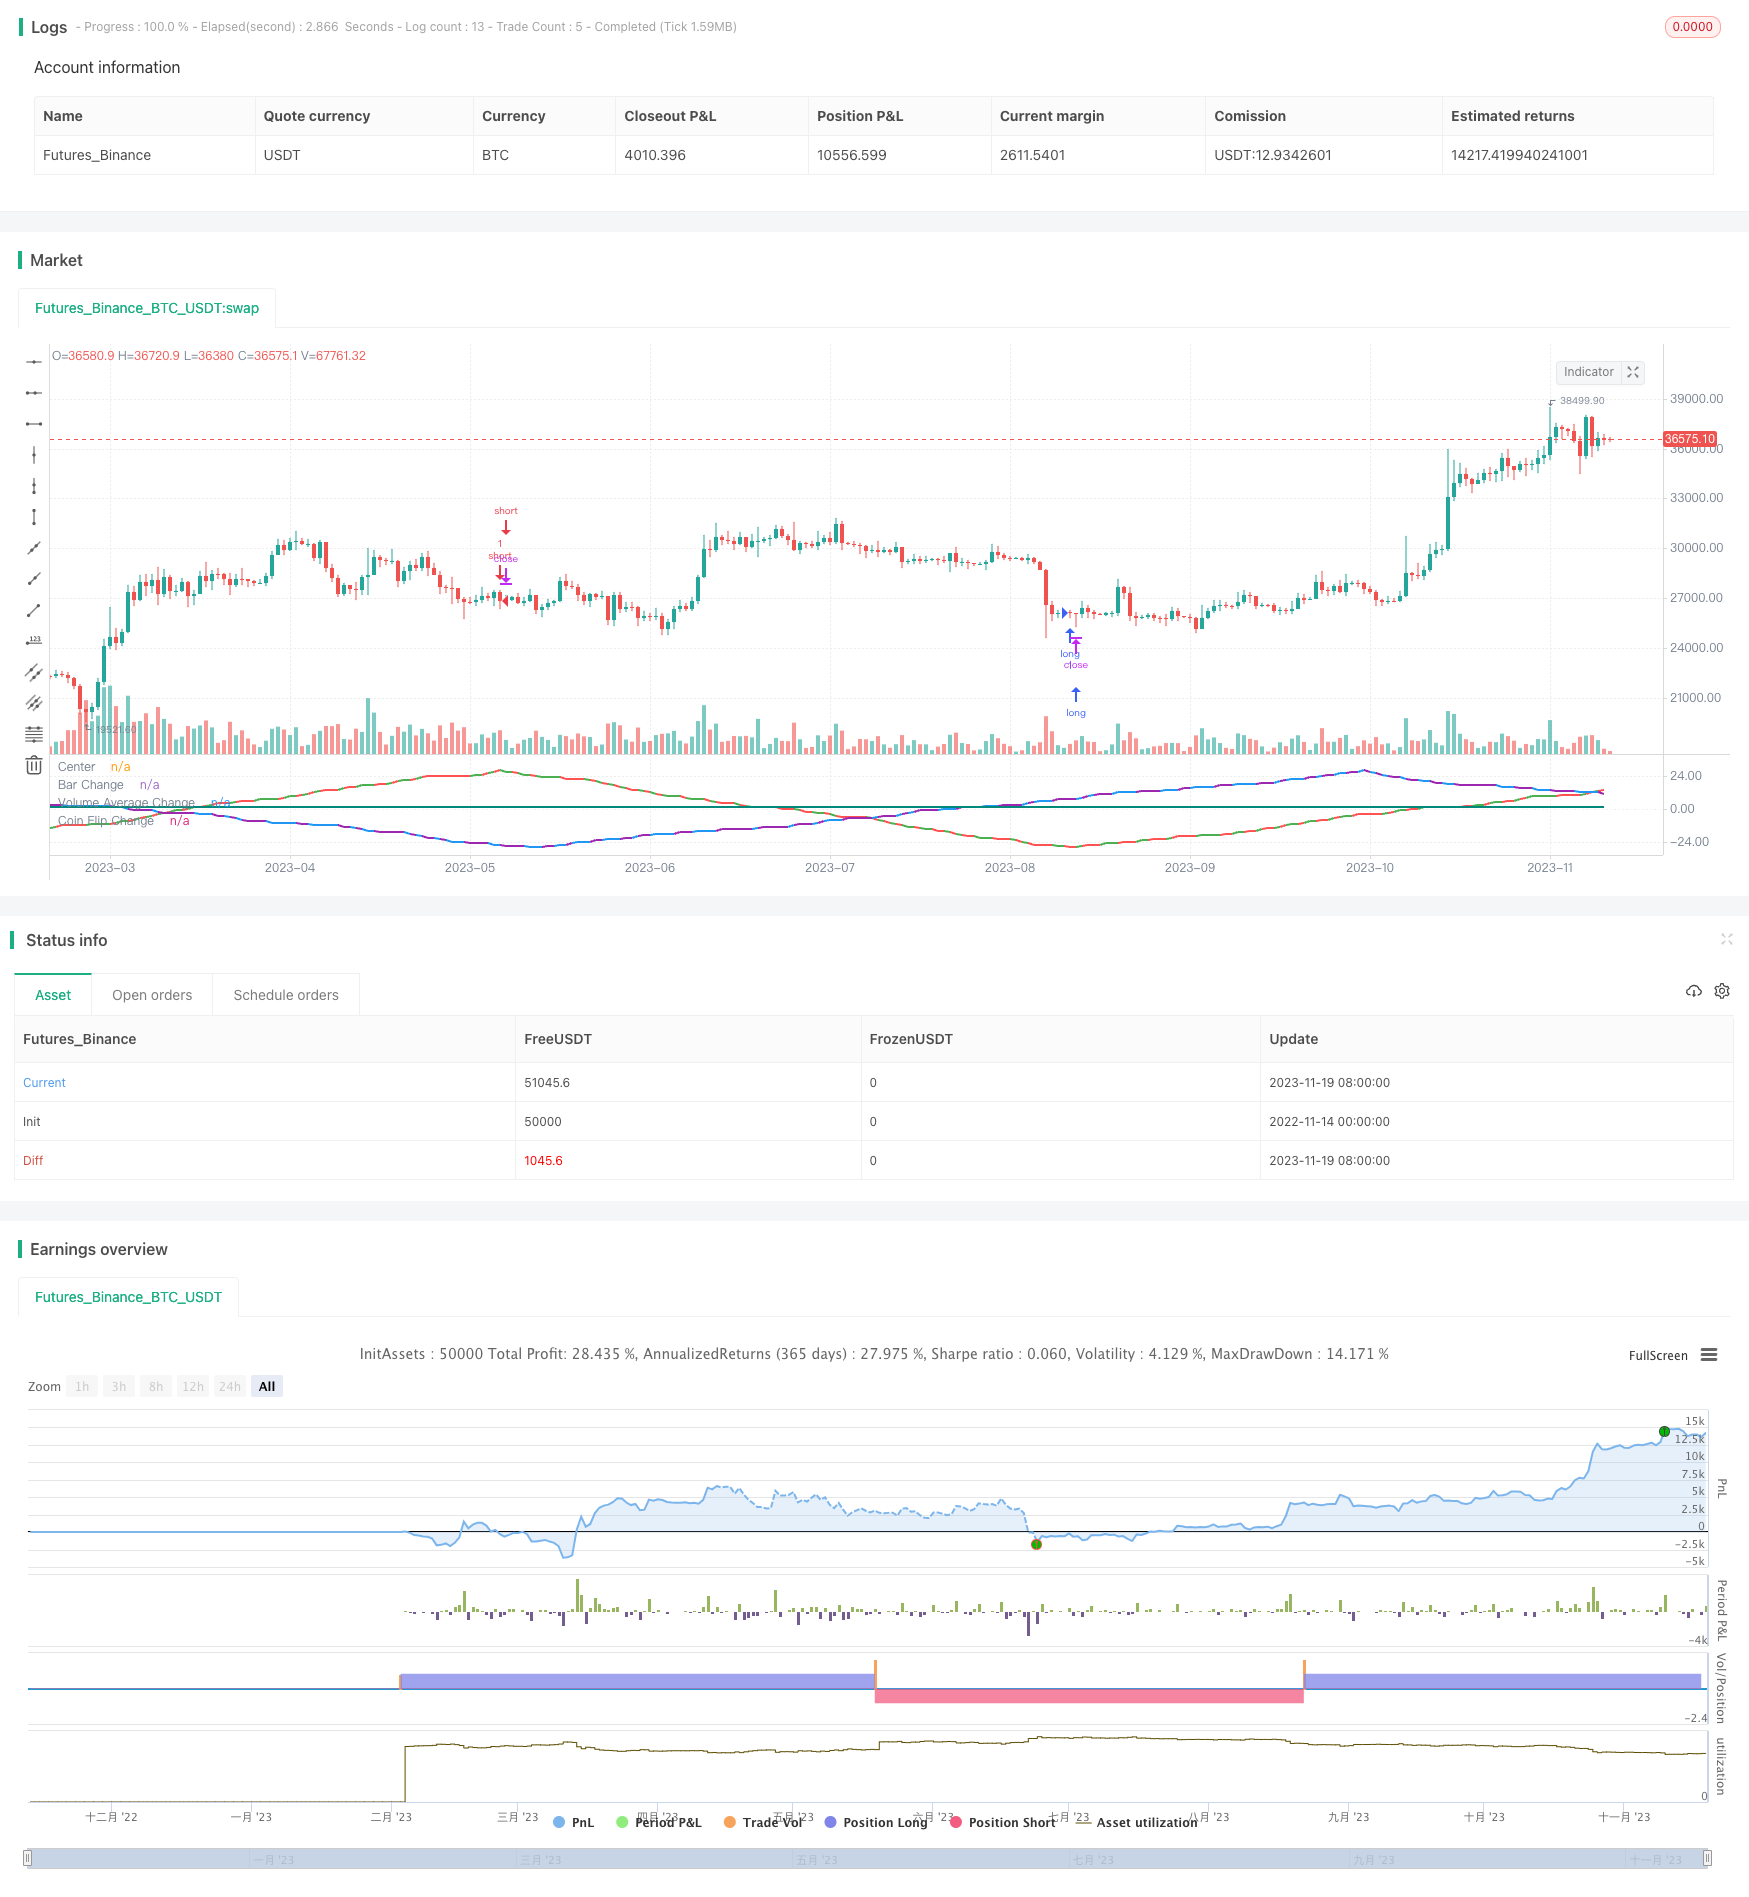
本策略的目的是测试不同的输入变量如K线颜色、成交量和随机方法,是否可以用正弦波的方式来预测价格变化。策略将这些变量转化为正弦波的形式,当波峰或波谷达到设定次数时,做出买入或卖出决策。
策略分为三个部分,第一个部分检测K线的颜色变化。当几根相同颜色的K线后,出现不同颜色时则正弦波转向。第二部分检测成交量是否高于或低于均值,当突破均值时波转向。第三部分使用随机方法模拟掷硬币,随机结果不同则波转向。这三个波累积到设定次数时,做出交易决策。
代码通过跟踪三个波的当前方向、波峰数和上一个K线的情况,来控制波的运行。当波峰数达到参数设定时,改变运行方向。通过这个循环来模拟正弦波运行。
这种正弦波理论看似很有道理,模拟出来的波形也与现实市场有一定关联。但通过本策略的测试可以发现,其实都是随机结果。哪种变量组合的波形看起来更像,并不能提高交易结果。
所以该策略的一个优势是反驳了“市场可以预测”这一错误观念。市场中的变量确实会影响价格,但不可预测,随机决策也可获得相近结果。
本策略最大的风险就是随机交易中难以确定盈亏。不同参数下结果也难以预测,无法提前确定是否可盈利。
此外,正弦波预测理论本身就是错误的。市场变化太复杂,不可能用简单周期性模拟。所以该策略无法真正应用于实盘交易中。
为降低风险,需要对随机结果进一步分析,确定参数范围;或者结合其他分析方法来验证交易信号。
本策略可以从以下几个方向进行优化:
- 增加更多变量转换为波,扩大样本空间
- 对当前三个波进行组合,寻找最佳遍历组合
- 设置止损方式,比如亏损比例止损
- 优化入场出场逻辑,进行回测寻找最佳参数
本策略通过测试不同正弦波,说明了市场不可预测的本质。同时也反驳了用波形循环来预测的错误理论。
下一步,可以通过增加变量、组合波形、设置止损和优化参数等方式提高策略的实盘可用性。但关键还是要理解,市场变化复杂多变,不容易预测。我们要做的是降低随机风险,而不是预测市场。
||
The purpose of this strategy is to test whether different input variables such as candlestick colors, volume and random methods can be used to predict price changes in the form of sine waves. The strategy converts these variables into sine wave forms. When the peaks or troughs reach the set number of times, buy or sell decisions are made.
The strategy is divided into three parts. The first part detects changes in candlestick colors. When a candle with a different color appears after several candles of the same color, the sine wave turns direction. The second part detects whether the volume is higher or lower than the average. When the average is broken, the wave turns direction. The third part uses a random method to simulate coin flipping. When the random result is different, the wave turns direction. When these three waves accumulate to the set number of times, trading decisions are made.
The code controls the running of the waves by tracking the current direction, number of peaks, and situation of the previous candlestick for the three waves. When the number of peaks reaches the parameter setting, it changes the running direction. This loop simulates the running of sine waves.
This sine wave theory seems to make sense, and the simulated waveforms also have some correlation with the real market. But through the test of this strategy, it can be found that they are actually random results. Which combination of variables makes the waveform look more similar does not improve trading results.
So one advantage of this strategy is to refute the misconception that "the market can be predicted". Variables in the market do affect prices, but they are unpredictable, and random decisions can also obtain similar results.
The biggest risk of this strategy is that it is difficult to determine profit and loss in random trading. The results under different parameters are also difficult to predict, and it is impossible to determine in advance whether it can be profitable.
In addition, the sine wave prediction theory itself is wrong. Market changes are too complex to simulate with simple cyclicity. So this strategy cannot really be used for actual trading.
To reduce risks, it is necessary to further analyze the random results to determine the parameter range; or combine other analytical methods to verify trading signals.
This strategy can be optimized in the following directions:
- Increase more variables converted into waves to expand the sample space
- Combine the three current waves to find the best traversal combination
- Set stop loss methods, such as percentage loss stops
- Optimize entry and exit logic and backtest to find optimal parameters
Through testing different sine waves, this strategy illustrates the unpredictable nature of the market. At the same time, it also refutes the erroneous theory of using wave cycles to predict.
Next, the practicality of the strategy can be improved by increasing variables, combining waveforms, setting stops, and optimizing parameters. But the key is still to understand that market changes are complex and unpredictable. What we need to do is reduce random risks rather than predict the market.
[/trans]
Strategy Arguments
| Argument | Default | Description |
|---|---|---|
| v_input_int_1 | true | (?Bar Change)Starting Wave Direction |
| v_input_int_2 | 28 | Sine Wave # |
| v_input_timeframe_1 | D | Resolution |
| v_input_bool_1 | true | Trade |
| v_input_int_3 | true | (?Volume)Starting Wave Direction |
| v_input_int_4 | 7 | Lookback Length |
| v_input_int_5 | 28 | Sine Wave # |
| v_input_timeframe_2 | D | Resolution |
| v_input_bool_2 | false | Trade |
| v_input_int_6 | true | (?Coin Flip)Starting Wave Direction |
| v_input_int_7 | 28 | Sine Wave # |
| v_input_int_8 | true | Seed # |
| v_input_bool_3 | false | Trade |
Source (PineScript)
/*backtest
start: 2022-11-14 00:00:00
end: 2023-11-20 00:00:00
period: 1d
basePeriod: 1h
exchanges: [{"eid":"Futures_Binance","currency":"BTC_USDT"}]
*/

// This source code is subject to the terms of the Mozilla Public License 2.0 at https://mozilla.org/MPL/2.0/
// © Gentleman-Goat

//@version=5
strategy("Sine Wave Theory",overlay=false, precision = 2, initial_capital = 1000,shorttitle = "SINE_W_T")

var bar_change_wave_direction = input.int(defval=1,title="Starting Wave Direction",group="Bar Change")
bar_change_sine_wave_number = input.int(defval=28,title="Sine Wave #",group="Bar Change")
bar_change_sine_wave_res = input.timeframe(defval="D",title="Resolution",group="Bar Change")
bar_change_trade = input.bool(defval=true,title="Trade",group="Bar Change")

var volume_wave_direction = input.int(defval=1,title="Starting Wave Direction",group="Volume")
avg_volume_length = input.int(7,title="Lookback Length",group="Volume")
volume_sine_wave_number = input.int(defval=28,title="Sine Wave #",group="Volume")
volume_sine_wave_res = input.timeframe(defval="D",title="Resolution",group="Volume")
volume_trade = input.bool(defval=false,title="Trade",group="Volume")

var coin_flip_wave_direction = input.int(defval=1,title="Starting Wave Direction",group="Coin Flip")
coin_flip_sine_wave_number = input.int(defval=28,title="Sine Wave #",group="Coin Flip")
coin_flip_seed = input.int(defval=1,title="Seed #",group="Coin Flip")
coin_flip_trade = input.bool(defval=false,title="Trade",group="Coin Flip")

avg_volume = ta.sma(volume,avg_volume_length)

//Green or Red Candle
bar_color = close>open ? color.green : color.red
bar_color_time_adj = request.security(syminfo.tickerid, bar_change_sine_wave_res, bar_color)

//Above or Below Average
volume_state = (volume>avg_volume) ? color.blue : color.purple
volume_state_time_adj = request.security(syminfo.tickerid, volume_sine_wave_res, volume_state)

//Coinflip
coin_flip = math.random(0,100,coin_flip_seed)>=50 ? color.teal : color.yellow

var bar_change_wave_count = 0
var volume_wave_count = 0
var coin_flip_wave_count = 0

//Wave Counters
if(volume_state_time_adj[1] != volume_state_time_adj)
    volume_wave_count := volume_wave_count + volume_wave_direction

if(bar_color_time_adj[1] != bar_color_time_adj)
    bar_change_wave_count := bar_change_wave_count + bar_change_wave_direction

if(coin_flip[1] != coin_flip)
    coin_flip_wave_count := coin_flip_wave_count + coin_flip_wave_direction

//Direction changers
if(math.abs(bar_change_wave_count) == bar_change_sine_wave_number and bar_color_time_adj[1] != bar_color_time_adj)
    bar_change_wave_direction := bar_change_wave_direction * -1

if(math.abs(volume_wave_count) == volume_sine_wave_number and volume_state_time_adj[1] != volume_state_time_adj)
    volume_wave_direction := volume_wave_direction * -1

if(math.abs(coin_flip_wave_count) == coin_flip_sine_wave_number and coin_flip[1] != coin_flip)
    coin_flip_wave_direction := coin_flip_wave_direction * -1

//Entry positions
if(bar_change_wave_count==bar_change_sine_wave_number and bar_change_trade==true)
    strategy.entry(id="short",direction=strategy.short)
if(bar_change_wave_count==bar_change_sine_wave_number*-1 and bar_change_trade==true)
    strategy.entry(id="long",direction=strategy.long)

if(volume_wave_count==volume_sine_wave_number and volume_trade==true)
    strategy.entry(id="short-volume",direction=strategy.short)
if(volume_wave_count==volume_sine_wave_number*-1 and volume_trade==true)
    strategy.entry(id="long-volume",direction=strategy.long)

if(coin_flip_wave_count==coin_flip_sine_wave_number and coin_flip_trade==true)
    strategy.entry(id="short-coinflip",direction=strategy.short)
if(coin_flip_wave_count==coin_flip_sine_wave_number*-1 and coin_flip_trade==true)
    strategy.entry(id="long-coinflip",direction=strategy.long)

hline(0, title='Center', color=color.white, linestyle=hline.style_dashed, linewidth=1)
plot(bar_change_wave_count,title="Bar Change", color=bar_color, linewidth=2)
plot(volume_wave_count,title="Volume Average Change", color=volume_state, linewidth=2)
plot(coin_flip_wave_count,title="Coin Flip Change", color=coin_flip, linewidth=2)
Detail
https://www.fmz.com/strategy/432774
Last Modified
2023-12-01 15:01:07
