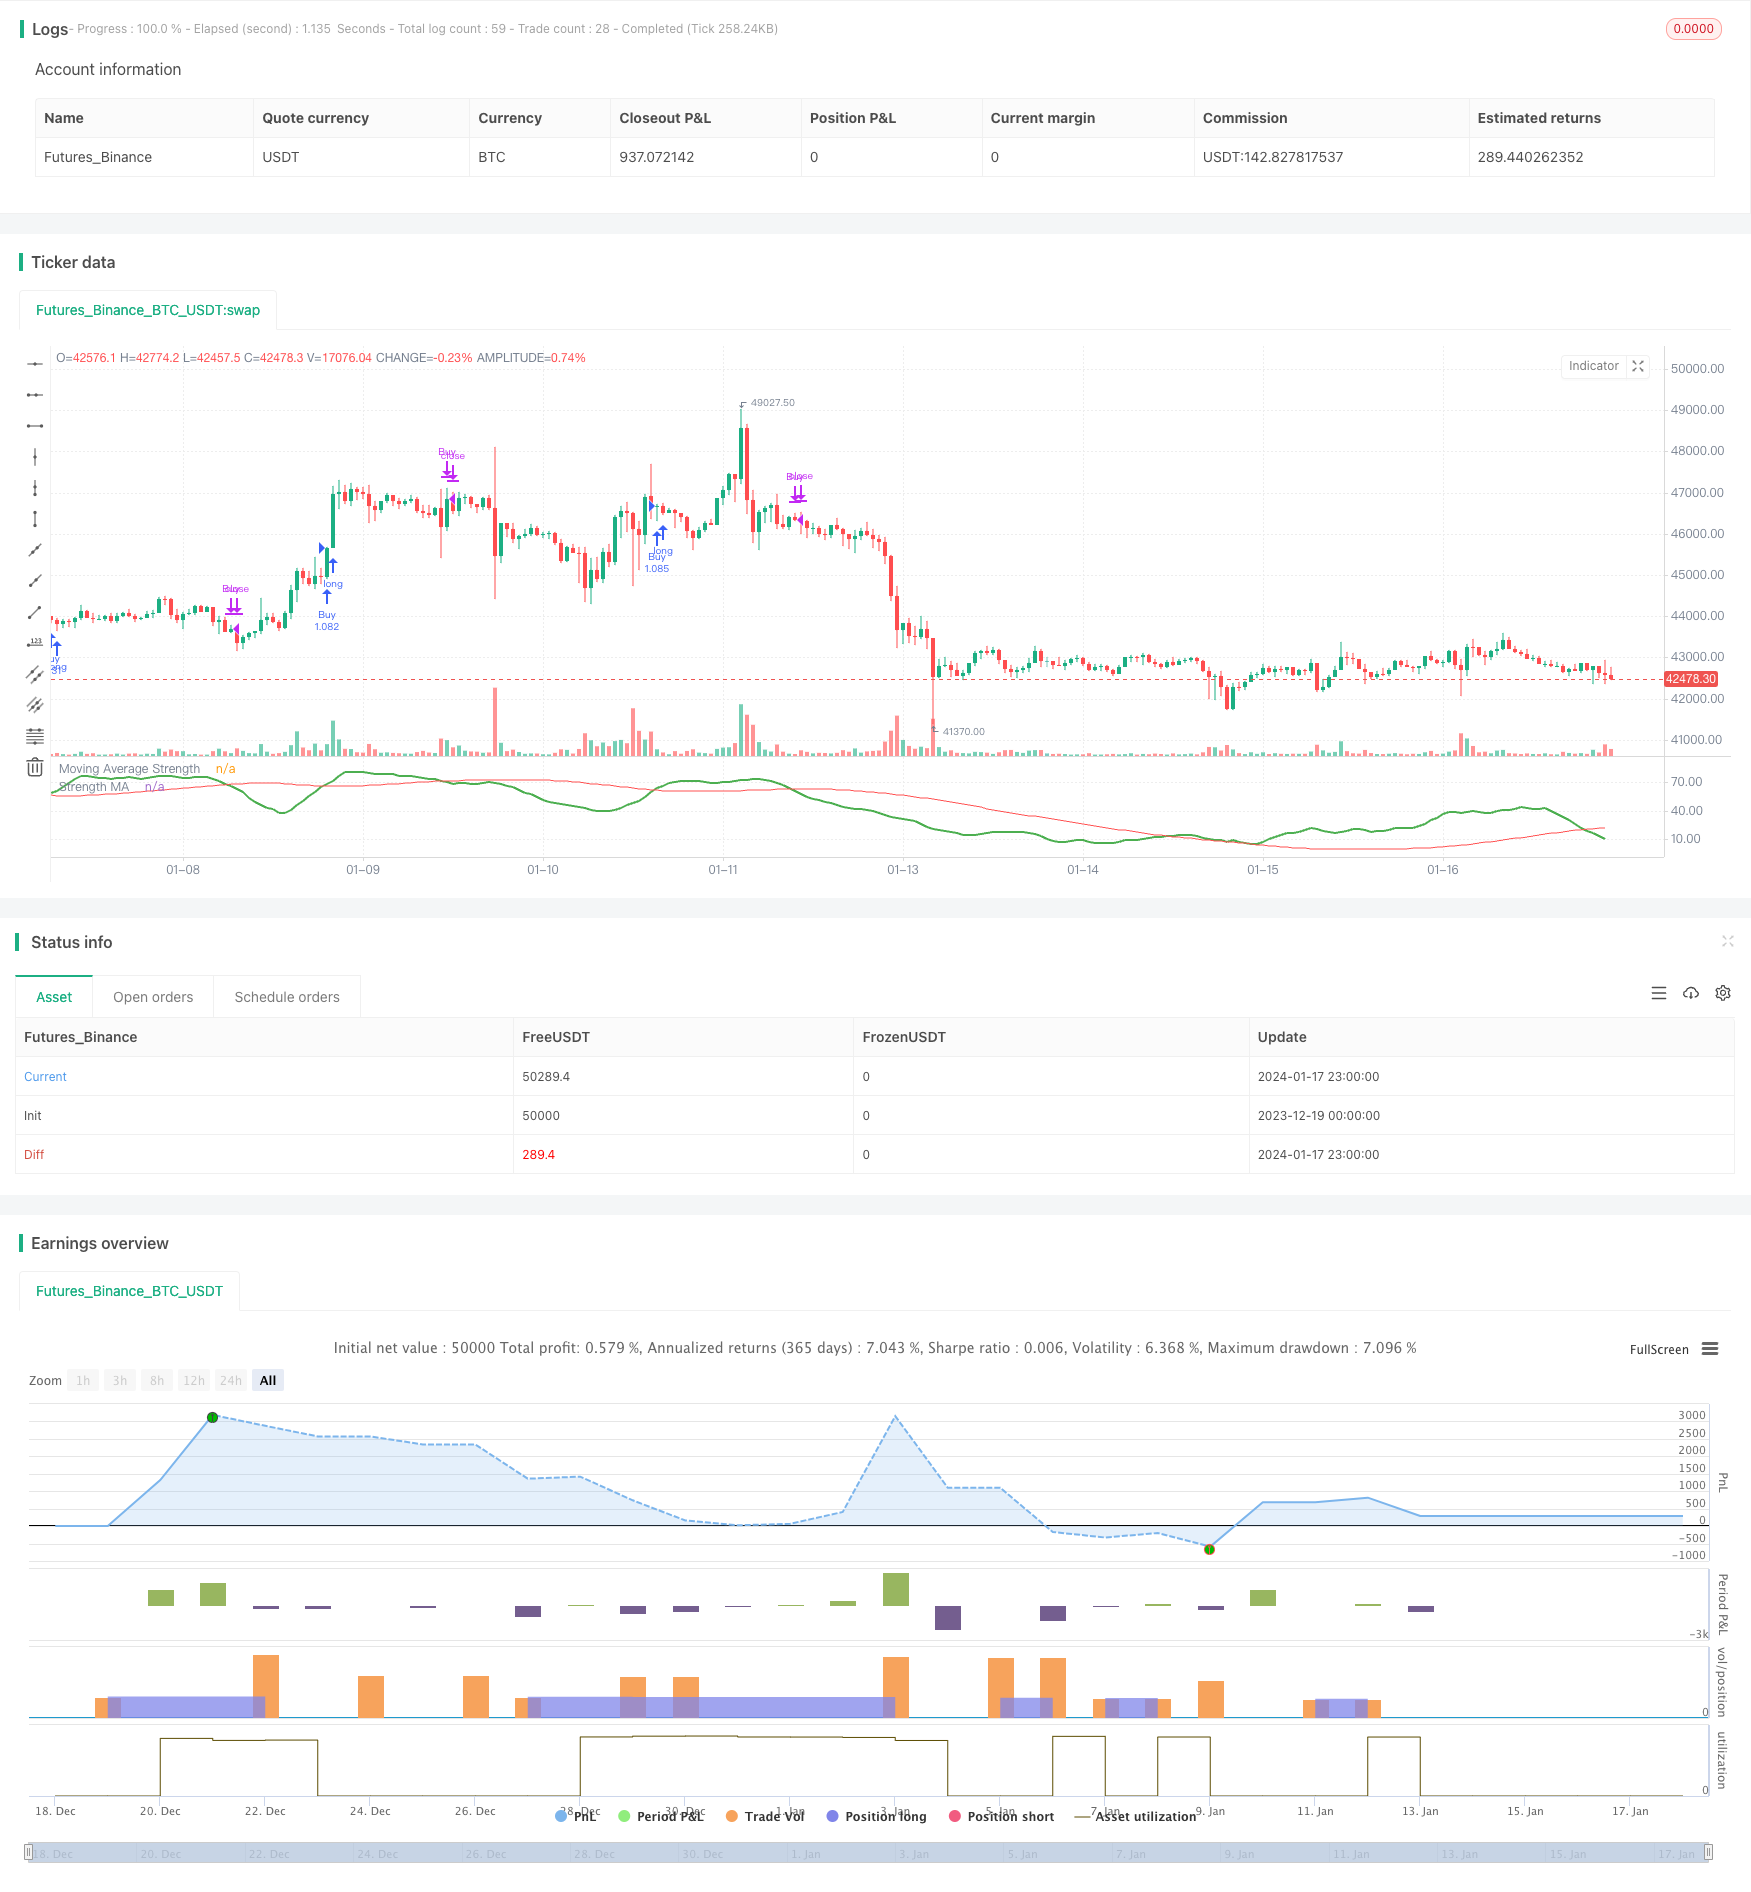
Name
量化策略之MA强弱趋势追踪Quantitative-Strategy-of-MA-Strength-Trend-Tracking
Author
ChaoZhang
Strategy Description
该策略通过计算多时间段的移动平均线(MA)强弱情况,评估市场趋势强弱,实现对趋势的判断和追踪。当短期MA指标连续上扬,记高分,形成“MA强度”指标。当该指标超过其本身的长期MA时,产生买入信号。策略可配置长短期MA组合,追踪不同周期趋势。
- 计算5日、10日、20日等多组MA,判断价格是否突破每个MA向上,突破记分,积分形成“MA强度”。
- 对“MA强度”应用移动平均线,形成均线指标,判断均线多空,产生交易信号。
- 可配置追踪周期参数:短期MA组数、长期均线周期、开仓条件等。
该策略主要判定均线指标的多空,通过均线指标反应MA线组的平均强度。MA线组集中判断趋势方向和力度,均线指标判断持续性。
- 评估趋势力度的多维度模型。单一MA线无法确定力度足够;该策略测量多MA突破,确保力度足够后发出信号,可靠性高。
- 可配置追踪周期。调整短期MA参数可捕捉不同级别趋势;调整长期MA参数可控制出场节奏。用户可根据市场调整周期。
- 仅做多可避免错杀,跟踪长期上涨趋势。策略仅做多,只追涨不追跌,可减少反转损失。
- 存在回撤风险。当短线均线下穿长线均线时,存在较大回撤的风险。可通过止损方式减少单笔损失。
- 存在反转风险。市场长期运行必然存在调整,策略必须及时止损Exiting。建议结合波段、通道等技术判断大周期末,控制反转风险。
- 参数风险。不当的参数配置可能得到错误信号。应调整参数适合不同品种,确保参数稳定。
- 结合更多指标过滤进场。可考虑结合成交量,在量能验证下发出信号,避免假突破。
- 增加止损方式。移动止损、曲线止损可在回调中减少损失。止盈方式也可考虑,锁定利润,避免反转。
- 考虑配置期货、外汇品种。MA线突破更适合趋势性品种。可评估不同期货品种的参数稳定性,选择最佳品种。
该策略通过计算MA强度指标判断价格趋势,并以均线交叉作为信号源,进行趋势追踪。策略优势是准确判断趋势力度,可靠性较高。主要风险在于趋势反转和参数调整。通过优化入场信号准确性,增加止损方式,选择合适品种,可以获得较好收益。
||
This strategy evaluates the strength of market trends by calculating the strength of moving averages (MA) across different timeframes, and tracks trends accordingly. When short-term MAs consecutively rally upwards, they score higher and form a “MA Strength” indicator. When this indicator crosses over its own long-term MA, buy signals are generated. The strategy allows users to configure MA combinations across short and long terms to track trends over customized cycles.
- Calculate the 5-day, 10-day, 20-day MAs etc. Judge if prices break above each MA, breakouts score points which accumulate into a “MA Strength” indicator.
- Apply moving average on the “MA Strength”, forming a MA indicator to determine long/short signals.
- Users can configure cycle parameters like: short-term MA combination, long-term MA period, entry conditions etc.
The core of this strategy is to determine the long/short condition of the MA indicator, which reflects the average strength of the MA combination. The MA combination comprehensively judges the trend, while the MA indicator determines persistence.
- Multi-dimensional model to evaluate trend strength. A single MA line cannot determine sufficient strength; this strategy measures multi-MA breakouts to ensure strength before signaling, ensuring reliability.
- Customizable cycle tracking. Adjusting short-term MA parameters can capture trends across different levels; adjusting long-term MA parameters controls exit pace. Users can configure cycles based on market conditions.
- Long only avoids wrong kills and tracks persistent uptrends. By only going long instead of shorting, losses from trend reversals can be avoided.
- Retracement risks exist when short-term MA crosses below long-term MA, which can be large losses. Stop loss methods should be used to limit losses.
- Reversal risks are inevitable in long-term trends, requiring timely stop loss exiting. It is recommended to judge cycle highs using techniques like channels to control reversal risks.
- Parameter risk. Improper parameter tuning can lead to wrong signals. Parameters should be optimized and stabilized for different products.
- Additional filter signals with more indicators. Volume can be used to avoid false breakouts by only signaling on volume confirmation.
- Add stop loss methods. Moving stop loss, curve stop loss can reduce retracement losses. Consider take profit methods to lock in profits and avoid reversals.
- Consider futures and forex products. MA breakouts better suit trending products. Evaluate parameter stability across products to select the optimal.
This strategy judges price trends by calculating a MA strength indicator and uses MA crosses as signal source to track trends. Its advantage lies in accurately determining trend strength for reliability. Main risks come from trend reversals and parameter tuning. By optimizing signal accuracy, adding stop losses, selecting suitable products, good returns can be obtained.
[/trans]
Strategy Arguments
| Argument | Default | Description |
|---|---|---|
| v_input_1 | 0 | Moving Average Type: ema |
| v_input_2 | 10 | LookbackPeriod |
| v_input_3 | 0 | Moving Average Type: hma |
| v_input_4 | 200 | IndexMAPeriod |
| v_input_5 | true | considerTrendDirection |
| v_input_6 | true | considerTrendDirectionForExit |
| v_input_7 | true | offset |
| v_input_8 | 0 | Trade Direction: strategy.direction.long |
| v_input_9 | timestamp(01 Jan 2010 00:00 +0000) | Start Time |
| v_input_10 | timestamp(01 Jan 2099 00:00 +0000) | End Time |
Source (PineScript)
/*backtest
start: 2023-12-19 00:00:00
end: 2024-01-18 00:00:00
period: 1h
basePeriod: 15m
exchanges: [{"eid":"Futures_Binance","currency":"BTC_USDT"}]
*/

// This source code is subject to the terms of the Mozilla Public License 2.0 at https://mozilla.org/MPL/2.0/
// © HeWhoMustNotBeNamed

//@version=4
strategy("MA Strength Strategy", overlay=false, initial_capital = 20000, default_qty_type = strategy.percent_of_equity, default_qty_value = 100, commission_type = strategy.commission.percent, pyramiding = 1, commission_value = 0.01)
MAType = input(title="Moving Average Type", defval="ema", options=["ema", "sma", "hma", "rma", "vwma", "wma"])
LookbackPeriod = input(10, step=10)

IndexMAType = input(title="Moving Average Type", defval="hma", options=["ema", "sma", "hma", "rma", "vwma", "wma"])
IndexMAPeriod = input(200, step=10)

considerTrendDirection = input(true)
considerTrendDirectionForExit = input(true)
offset = input(1, step=1)
tradeDirection = input(title="Trade Direction", defval=strategy.direction.long, options=[strategy.direction.all, strategy.direction.long, strategy.direction.short])
i_startTime = input(defval = timestamp("01 Jan 2010 00:00 +0000"), title = "Start Time", type = input.time)
i_endTime = input(defval = timestamp("01 Jan 2099 00:00 +0000"), title = "End Time", type = input.time)
inDateRange = true

f_getMovingAverage(source, MAType, length)=>
    ma = sma(source, length)
    if(MAType == "ema")
        ma := ema(source,length)
    if(MAType == "hma")
        ma := hma(source,length)
    if(MAType == "rma")
        ma := rma(source,length)
    if(MAType == "vwma")
        ma := vwma(source,length)
    if(MAType == "wma")
        ma := wma(source,length)
    ma


f_getMaAlignment(MAType, includePartiallyAligned)=>
    ma5 = f_getMovingAverage(close,MAType,5)
    ma10 = f_getMovingAverage(close,MAType,10)
    ma20 = f_getMovingAverage(close,MAType,20)
    ma30 = f_getMovingAverage(close,MAType,30)
    ma50 = f_getMovingAverage(close,MAType,50)
    ma100 = f_getMovingAverage(close,MAType,100)
    ma200 = f_getMovingAverage(close,MAType,200)

    upwardScore = 0.0
    upwardScore := close > ma5? upwardScore+1.10:upwardScore
    upwardScore := ma5 > ma10? upwardScore+1.10:upwardScore
    upwardScore := ma10 > ma20? upwardScore+1.10:upwardScore
    upwardScore := ma20 > ma30? upwardScore+1.10:upwardScore
    upwardScore := ma30 > ma50? upwardScore+1.15:upwardScore
    upwardScore := ma50 > ma100? upwardScore+1.20:upwardScore
    upwardScore := ma100 > ma200? upwardScore+1.25:upwardScore

    upwards = close > ma5 and ma5 > ma10 and ma10 > ma20 and ma20 > ma30 and ma30 > ma50 and ma50 > ma100 and ma100 > ma200
    downwards = close < ma5 and ma5 < ma10 and ma10 < ma20 and ma20 < ma30 and ma30 < ma50 and ma50 < ma100 and ma100 < ma200
    trendStrength = upwards?1:downwards?-1:includePartiallyAligned ? (upwardScore > 6? 0.5: upwardScore < 2?-0.5:upwardScore>4?0.25:-0.25) : 0
    [trendStrength, upwardScore]

includePartiallyAligned = true
[trendStrength, upwardScore] = f_getMaAlignment(MAType, includePartiallyAligned)

upwardSum = sum(upwardScore, LookbackPeriod)

indexSma = f_getMovingAverage(upwardSum,IndexMAType,IndexMAPeriod)

plot(upwardSum, title="Moving Average Strength", color=color.green, linewidth=2, style=plot.style_linebr)
plot(indexSma, title="Strength MA", color=color.red, linewidth=1, style=plot.style_linebr)
buyCondition = crossover(upwardSum,indexSma) and (upwardSum > upwardSum[offset] or not considerTrendDirection)
sellCondition = crossunder(upwardSum,indexSma) and (upwardSum < upwardSum[offset]  or not considerTrendDirection)

exitBuyCondition = crossunder(upwardSum,indexSma)
exitSellCondition = crossover(upwardSum,indexSma)
strategy.risk.allow_entry_in(tradeDirection)
strategy.entry("Buy", strategy.long, when= inDateRange and buyCondition, oca_name="oca_buy")
strategy.close("Buy", when = considerTrendDirectionForExit? sellCondition : exitBuyCondition)
strategy.entry("Sell", strategy.short, when= inDateRange and sellCondition, oca_name="oca_sell")
strategy.close( "Sell", when = considerTrendDirectionForExit? buyCondition : exitSellCondition)
Detail
https://www.fmz.com/strategy/439373
Last Modified
2024-01-19 16:50:13
