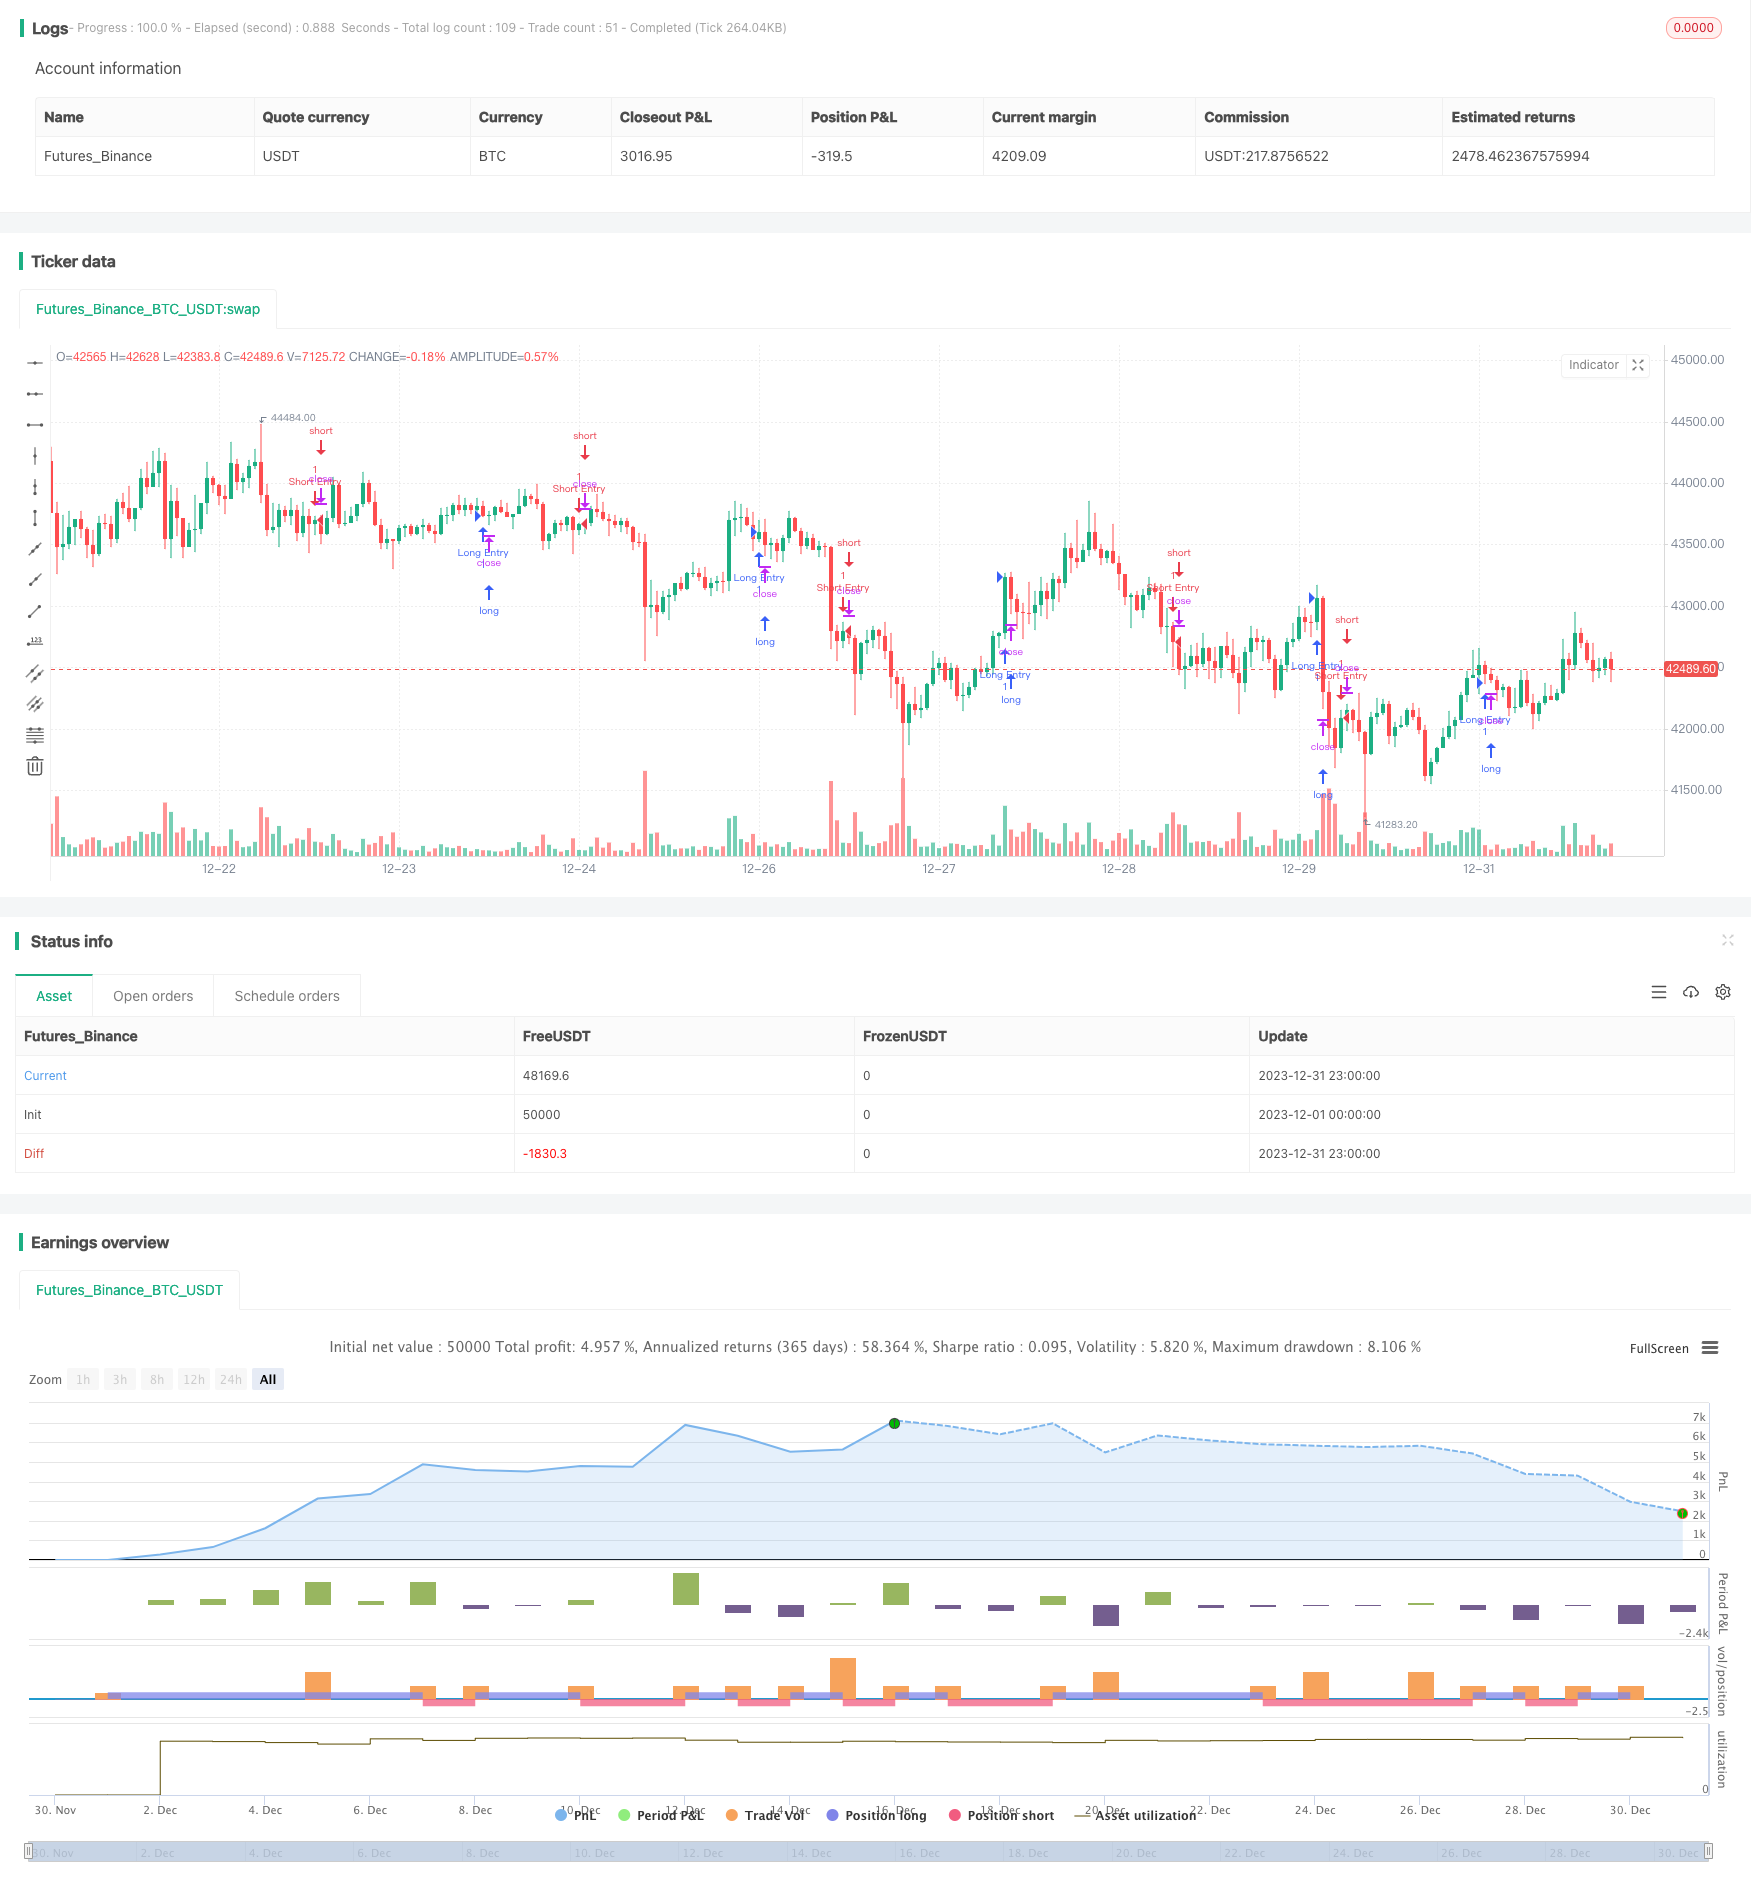
Name
量化W形态高手之路Quant-W-Pattern-Master-Strategy
Author
ChaoZhang
Strategy Description
本策略名称为“量化W形态高手之路”。该策略综合运用W形态与高量能量策略,通过量化指标识别价格W形态与高成交量配合形成的买入时机。
该策略主要基于两个指标进行量化交易信号判断。第一个指标是W形态指标,它通过快速简单移动平均线(10周期)与慢速简单移动平均线(30周期)的多头交叉来识别价格W形态。当快速线从下方上穿慢速线时,判断为W形态底部形成。第二个指标是成交量指标,它将当前成交量与成交量简单移动平均线(20周期)的2倍进行比较。如果当前成交量大于移动平均量的2倍,则判断为高量能量配合。当价格W形态与高量能量同时出现时,产生买入信号。
具体来说,该策略使用以下几个步骤识别交易时机:
- 计算10周期与30周期的简单移动平均线;
- 判断快速线与慢速线的金叉配合一次金叉再次死叉构成W形态;
- 计算20周期成交量的简单移动平均线,当前成交量大于移动平均量的2倍识别高量能量;
- W形态与高量能量同时出现时,产生买入信号。
通过上述多个指标的量化判断,可有效识别价格反转机会,形成具有高胜率的交易策略。
本策略最大的优势在于多指标量化判断,使交易信号更加准确可靠。具体优势如下:
- W形态指标可准确识别价格反转,具有较高的质量;
- 高量能量验证可避免虚假信号,提高信号的可靠性;
- 多指标组合使策略更加全面和立体,胜率更高;
- 参数可调整空间大,可根据不同市场环境进行优化。
总的来说,该策略成功结合技术形态与成交量指标,通过量化手段识别高质量交易机会,可靠性强,适应性广,是一种较为先进的量化交易策略。
本策略也存在一定的风险,主要包含以下几个方面:
- W形态无法百分百预测价格反转,会存在一定的假信号风险;
- 高量验证也可能会漏掉部分机会,无法识别全部买入点位;
- 参数设置如移动平均周期等需要根据市场环境进行调整优化,否则会影响策略表现;
- 任何技术指标都无法完美预测市场,多指标组合也无法完全规避亏损风险。
针对上述风险,我们可以通过以下几点来进一步完善和优化策略:
- 增加止损点位,严格控制单笔亏损;
- 优化参数设置,调整移动平均周期等参数;
- 增加模型Ensemble,结合更多技术指标判断;
- 增加风控模块,根据大市环境调整仓位。
本策略还有进一步优化的空间,主要包含以下几个方面:
1)优化参数设置:可以通过更多数据回测和参数扫描来找到最佳参数组合,如移动平均周期、成交量放大倍数等;
2)Ensemble模型:可以增加更多技术指标,构建Ensemble模型,集成判断交易信号,提高策略稳定性;
3)动态仓位管理:可以根据大盘指标、情绪指标等建立动态仓位管理模型,在高风险环境下降低仓位;
4)止损策略:设定合理的止损点位,严格控制单笔亏损;
5)回测验证:在更多市场环境下进行回测,验证策略在不同行情下的稳健性。
通过上述几个方面的持续优化,可望进一步提升策略的稳定性和盈利能力。
“量化W形态高手之路”策略成功实现价格技术形态与成交量指标的有效结合,通过量化手段识别高质量买入点位。策略优势在于指标组合全面、可靠性高、适应性强。但也存在一定假信号风险,需要通过参数优化、模型Ensemble、动态仓位管理等手段进一步稳定。本策略为代表性的多指标量化交易策略,通过持续优化和改进,必将成为量化交易的一大杀手锏。
||
This strategy is named "Quant W Pattern Master Strategy". It combines the W pattern and high volume energy strategies to identify buying opportunities when the price W pattern coincides with high trading volumes through quantitative indicators.
This strategy mainly relies on two indicators for quantitative trading signals. The first one is the W pattern indicator, which identifies W patterns in price by the bullish crossover of the fast simple moving average (10 periods) crossing above the slow simple moving average (30 periods). The second one is the volume indicator, which compares the current volume to 2 times the simple moving average of volume (20 periods). If current volume is greater than 2 times the average, then high volume energy is identified. The strategy generates buy signals when the price W pattern coincides with high trading volume.
Specifically, the strategy identifies trading opportunities through the following steps:
-
Calculate the 10-period and 30-period simple moving averages;
-
Identify W pattern when the fast line crosses above the slow line, accompanied by a previous crossover in the opposite direction;
-
Calculate 20-period simple moving average of volume, recognize high volume when current volume is greater than 2 times the average;
-
Generate buy signals when W pattern and high volume occur together.
Through quantitative judgments based on multiple indicators, this strategy can effectively identify price reversal opportunities and form profitable trades.
The biggest advantage of this strategy lies in the quantitative judgments based on multiple indicators, making trading signals more accurate and reliable. Specific advantages include:
-
W pattern indicator accurately identifies price reversals with high quality;
-
High volume verification avoids false signals and increases reliability;
-
Combination of multiple indicators makes the strategy more comprehensive and stereoscopic with higher win rate;
-
High flexibility for parameter tuning and optimization for different market environments.
In summary, this strategy successfully combines technical pattern with volume indicator through quantitative techniques to identify high-quality trading opportunities with strong reliability, wide adaptability and advanced concepts.
This strategy also carries some risks, mainly in the following aspects:
-
W pattern cannot perfectly predict price reversals, some false signals may exist;
-
High volume validation may also miss some opportunities and cannot identify all buying points;
-
Parameter settings like moving average periods need adjustments based on changing market environments, otherwise it will affect strategy performance;
-
No technical indicator can perfectly predict the market, and the multiple indicator approach cannot completely avoid losses.
To address the above risks, we can make further improvements from the following perspectives:
-
Add stop loss points to strictly control single trade loss;
-
Optimize parameter settings and adjust moving average periods etc;
-
Increase model ensemble approaches with more technical indicators;
-
Add risk management modules to adjust position sizes based on market regimes.
This strategy has room for further optimizations:
-
Parameter tuning: find optimal parameter combinations through more backtesting and scanning, e.g. moving average periods, volume multiplier etc;
-
Model ensemble: increase more technical indicators and ensemble models to improve stability;
-
Dynamic position sizing: build dynamic position management models based on market indicators to lower position sizes during high-risk environments;
-
Stop loss strategy: set proper stop loss points to control losses;
-
Backtest validation: test this strategy in more market conditions to verify robustness.
With continuous improvements in the above directions, the strategy's stability and profitability could be further enhanced.
The "Quant W Pattern Master Strategy" successfully combines price technical pattern with volume indicators through quantitative techniques to identify high-quality buying opportunities. The advantage lies in its comprehensive indicator combination, high reliability and wide adaptability. But some risks of false signals remain, requiring parameter tuning, ensemble models and dynamic position management to improve stability. As a representative multi-indicator quantitative trading strategy, with continuous optimizations it will become a powerful weapon for algorithmic trading.
[/trans]
Strategy Arguments
| Argument | Default | Description |
|---|---|---|
| v_input_int_1 | 3 | W Bottom Depth |
| v_input_int_2 | 2 | Volume Multiplier |
Source (PineScript)
/*backtest
start: 2023-12-01 00:00:00
end: 2023-12-31 23:59:59
period: 1h
basePeriod: 15m
exchanges: [{"eid":"Futures_Binance","currency":"BTC_USDT"}]
*/

//@version=5
strategy("Combined Strategy", overlay=true)

// Input parameters for the W pattern with high volume
wBottomDepth_W = input.int(3, title="W Bottom Depth", minval=1)
volumeMultiplier_W = input.int(2, title="Volume Multiplier", minval=1)

// Calculate moving averages for the W pattern
maShort = ta.sma(close, 10)
maLong = ta.sma(close, 30)

// Find W pattern
wBottom = ta.crossover(maShort, maLong) and ta.crossover(maShort[1], maLong[1])

// Check for high volume
isHighVolume = volume > volumeMultiplier_W * ta.sma(volume, 20)

// Strategy logic for the W pattern with high volume
if (wBottom and isHighVolume)
    strategy.entry("W Pattern Buy", strategy.long)

// Plot shapes to highlight W pattern and high volume
plotshape(series=wBottom and isHighVolume, title="W Bottom with High Volume", color=color.new(color.green, 0), style=shape.triangleup, location=location.belowbar, size=size.small)

// Strategy logic for the second strategy
longCondition_My = ta.crossover(ta.sma(close, 14), ta.sma(close, 28))
if (longCondition_My)
    strategy.entry("Long Entry", strategy.long)

shortCondition_My = ta.crossunder(ta.sma(close, 14), ta.sma(close, 28))
if (shortCondition_My)
    strategy.entry("Short Entry", strategy.short)
Detail
https://www.fmz.com/strategy/440538
Last Modified
2024-01-31 14:49:56
