Name
金分割回测长仓策略Golden-Ratio-Breakout-Long-Strategy
Author
ChaoZhang
Strategy Description
[trans]
金分割回测长仓策略是一种swing交易策略。它基于过去21天的最高价和最低价的金分割点进行信号生成,具有回测机制,只做多头,具有长线持仓的特点。
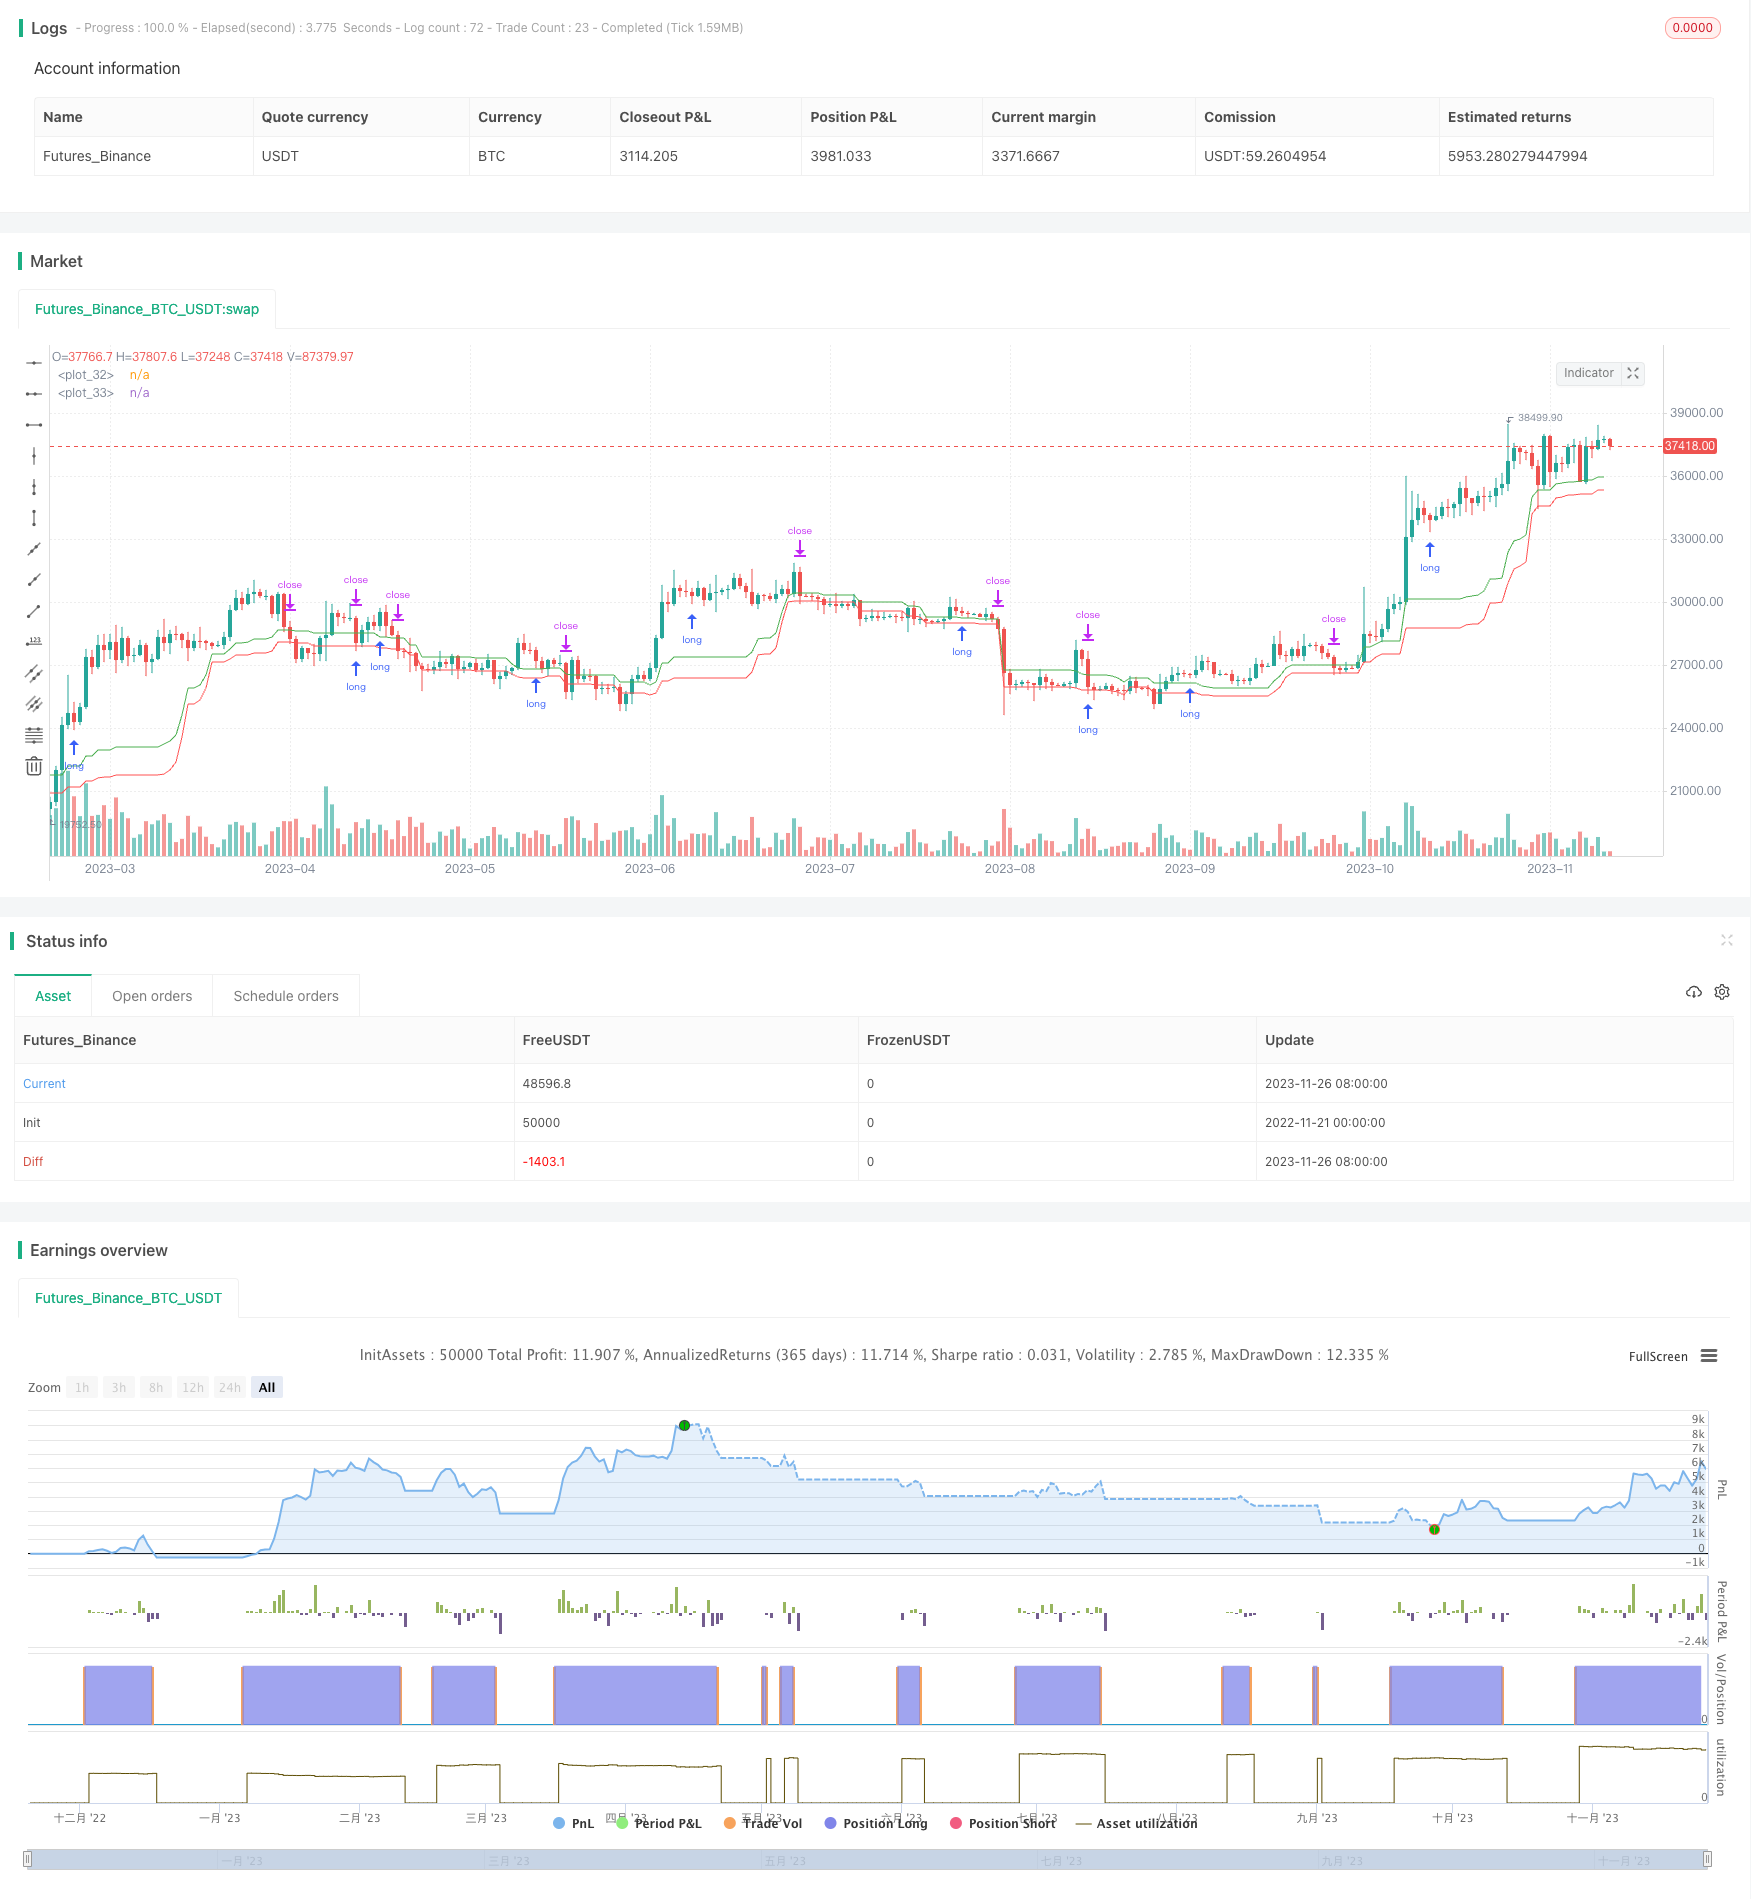
该策略首先计算过去21天的最高价high21和最低价low21,然后计算两者的差价diff。 交易信号是:当前低价高于low21 + diff * 0.382时,并且前一根K线收盘价高于前一根K线的开盘价时,做多。止损线为low21 + diff * 0.236。也就是说,当价格突破最近21天价格范围的38.2%金分割线时,并且有向上的弹性时,做多。止损线设置为23.6%金分割线。
这里使用金分割线作为重要的技术指标,是因为金分割线对应着市场普遍的支撑或阻力点。0.382和0.236作为回调位或反弹位常被监控,可以称得上是自然界中最神奇的数字之一。
这种策略的优势有:
-
使用金分割理论指导交易,这是一种比较成熟的技术分析方法。
-
只做多头,可以降低系统的风险。
-
采用趋势追踪机制,通过向上弹性来确定入场。
-
有清晰的止损线,可以控制风险。
-
回测参数可调,可以测试不同市场环境下的效果。
该策略也存在一些风险:
-
依赖历史数据,可能对市场结构变化不敏感。
-
止损线比较近,可能会被隔夜GAP摇出。
-
如果行情出现剧烈波动,回测周期不当可能导致虚假信号。
-
量化交易本身存在的滑点成本也会对利润造成一定影响。
这些风险可以通过调整回测周期参数、优化止损位置、考虑滑点成本等方法来降低。
这种策略可以从以下几个方面进行优化:
-
基于机器学习算法自动优化参数,使回测周期参数更符合当前市场环境。
-
结合股指期货等金融衍生品,利用杠杆进行放大操作。
-
增加模型对突发事件的处理,如加入跳空缺口的识别机制。
-
优化止损策略,根据市场波动性设置动态滑点止损。
整体来说,这是一个利用金分割线原理,具有清晰入场机制和止损思路的长线多头策略。通过参数调整、模型优化、组合应用等方法,可以将其优化为一个可靠的量化交易策略。
||
The Golden Ratio Breakout Long Strategy is a swing trading strategy based on the golden ratio levels of the highest and lowest prices over the past 21 days. It features a backtesting mechanism, long-only setup, and long-term holding period.
The strategy first calculates the 21-day highest price (high21) and the 21-day lowest price (low21), then computes the difference between them as diff. The trading signal triggers when the current low price breaks above low21 + 0.382 * diff while the previous bar's close is higher than the previous bar's open. The stop loss is set at low21 + 0.236 * diff. In other words, when the price breaks the 38.2% golden ratio line of the recent 21-day price range with upwards elasticity, a long position is initiated. The stop loss line is the 23.6% golden ratio line.
The golden ratio levels are used here as they generally correspond to common market support and resistance areas. 0.382 and 0.236 are watched as retracement and bounce levels, making the golden ratio one of the most intriguing numbers in nature.
The advantages of this strategy are:
-
Guided by mature technical analysis methodology - golden ratio theory.
-
Long-only setup lowers system risk.
-
Trend tracking mechanism identifies accurate entry timing.
-
Clear stop loss controls risk.
-
Customizable backtest parameters suit different market environments.
There are also some risks:
-
Reliance on historical data causes insensitivity to market regime shifts.
-
The tight stop loss may get stopped out by overnight gaps.
-
False signals can happen if violent price swings occur under improper backtest periods.
-
Slippage impacts profitability.
These risks can be reduced by adjusting backtest periods, optimizing stop loss placement, considering slippage cost, etc.
The strategy can be upgraded in the following aspects:
-
Auto-optimize parameters with machine learning algorithms to better fit the current market.
-
Incorporate leverage products like index futures for position amplification.
-
Improve handling of extreme events like price gaps.
-
Optimize stop loss rules, e.g. set dynamic stops based on volatility.
In conclusion, this is a long-only strategy that provides clear entry and stop loss logic based on the golden ratio theory. It can be transformed into a robust quantitative trading strategy through parameter tuning, model optimization, portfolio combination, and other enhancement techniques.
[/trans]
Strategy Arguments
| Argument | Default | Description |
|---|---|---|
| v_input_1 | 21 | High Days |
| v_input_2 | 21 | Low Days |
| v_input_3 | true | Start Date |
| v_input_4 | true | Start Month |
| v_input_5 | 2019 | Start Year |
Source (PineScript)
/*backtest
start: 2022-11-21 00:00:00
end: 2023-11-27 00:00:00
period: 1d
basePeriod: 1h
exchanges: [{"eid":"Futures_Binance","currency":"BTC_USDT"}]
*/

// This source code is subject to the terms of the Mozilla Public License 2.0 at https://mozilla.org/MPL/2.0/
// © omkarkondhekar

//@version=4
strategy("GRBLong", overlay=true)

highInput = input(title = "High Days", type = input.integer, defval = 21, minval = 11)
lowInput = input(title = "Low Days", type = input.integer, defval = 21, minval = 5)

// Configure backtest start date with inputs
startDate = input(title="Start Date", type=input.integer,
     defval=1, minval=1, maxval=31)
startMonth = input(title="Start Month", type=input.integer,
     defval=1, minval=1, maxval=12)
startYear = input(title="Start Year", type=input.integer,
     defval=2019, minval=1800, maxval=2100)

// See if this bar's time happened on/after start date
afterStartDate = (time >= timestamp(syminfo.timezone,
     startYear, startMonth, startDate, 0, 0))

high21 = highest(high, highInput)
low21 = lowest(low, lowInput)

diff = high21 - low21

longEntrySignal = low > low21 + (diff * 0.382) and close[1] > open[1]

strategy.entry("Long", strategy.long, limit = low, when = longEntrySignal and afterStartDate)
strategy.exit("Long Exit", "Long", stop = low21 + (diff * 0.236))

plot(low21 + (diff * 0.382), color= color.green)
plot(low21 + (diff * 0.236), color = color.red)
Detail
https://www.fmz.com/strategy/433538
Last Modified
2023-11-28 13:40:35
