Name
震动宝盒量化交易策略Trending-Darvas-Box-Quantitative-Trading-Strategy
Author
ChaoZhang
Strategy Description
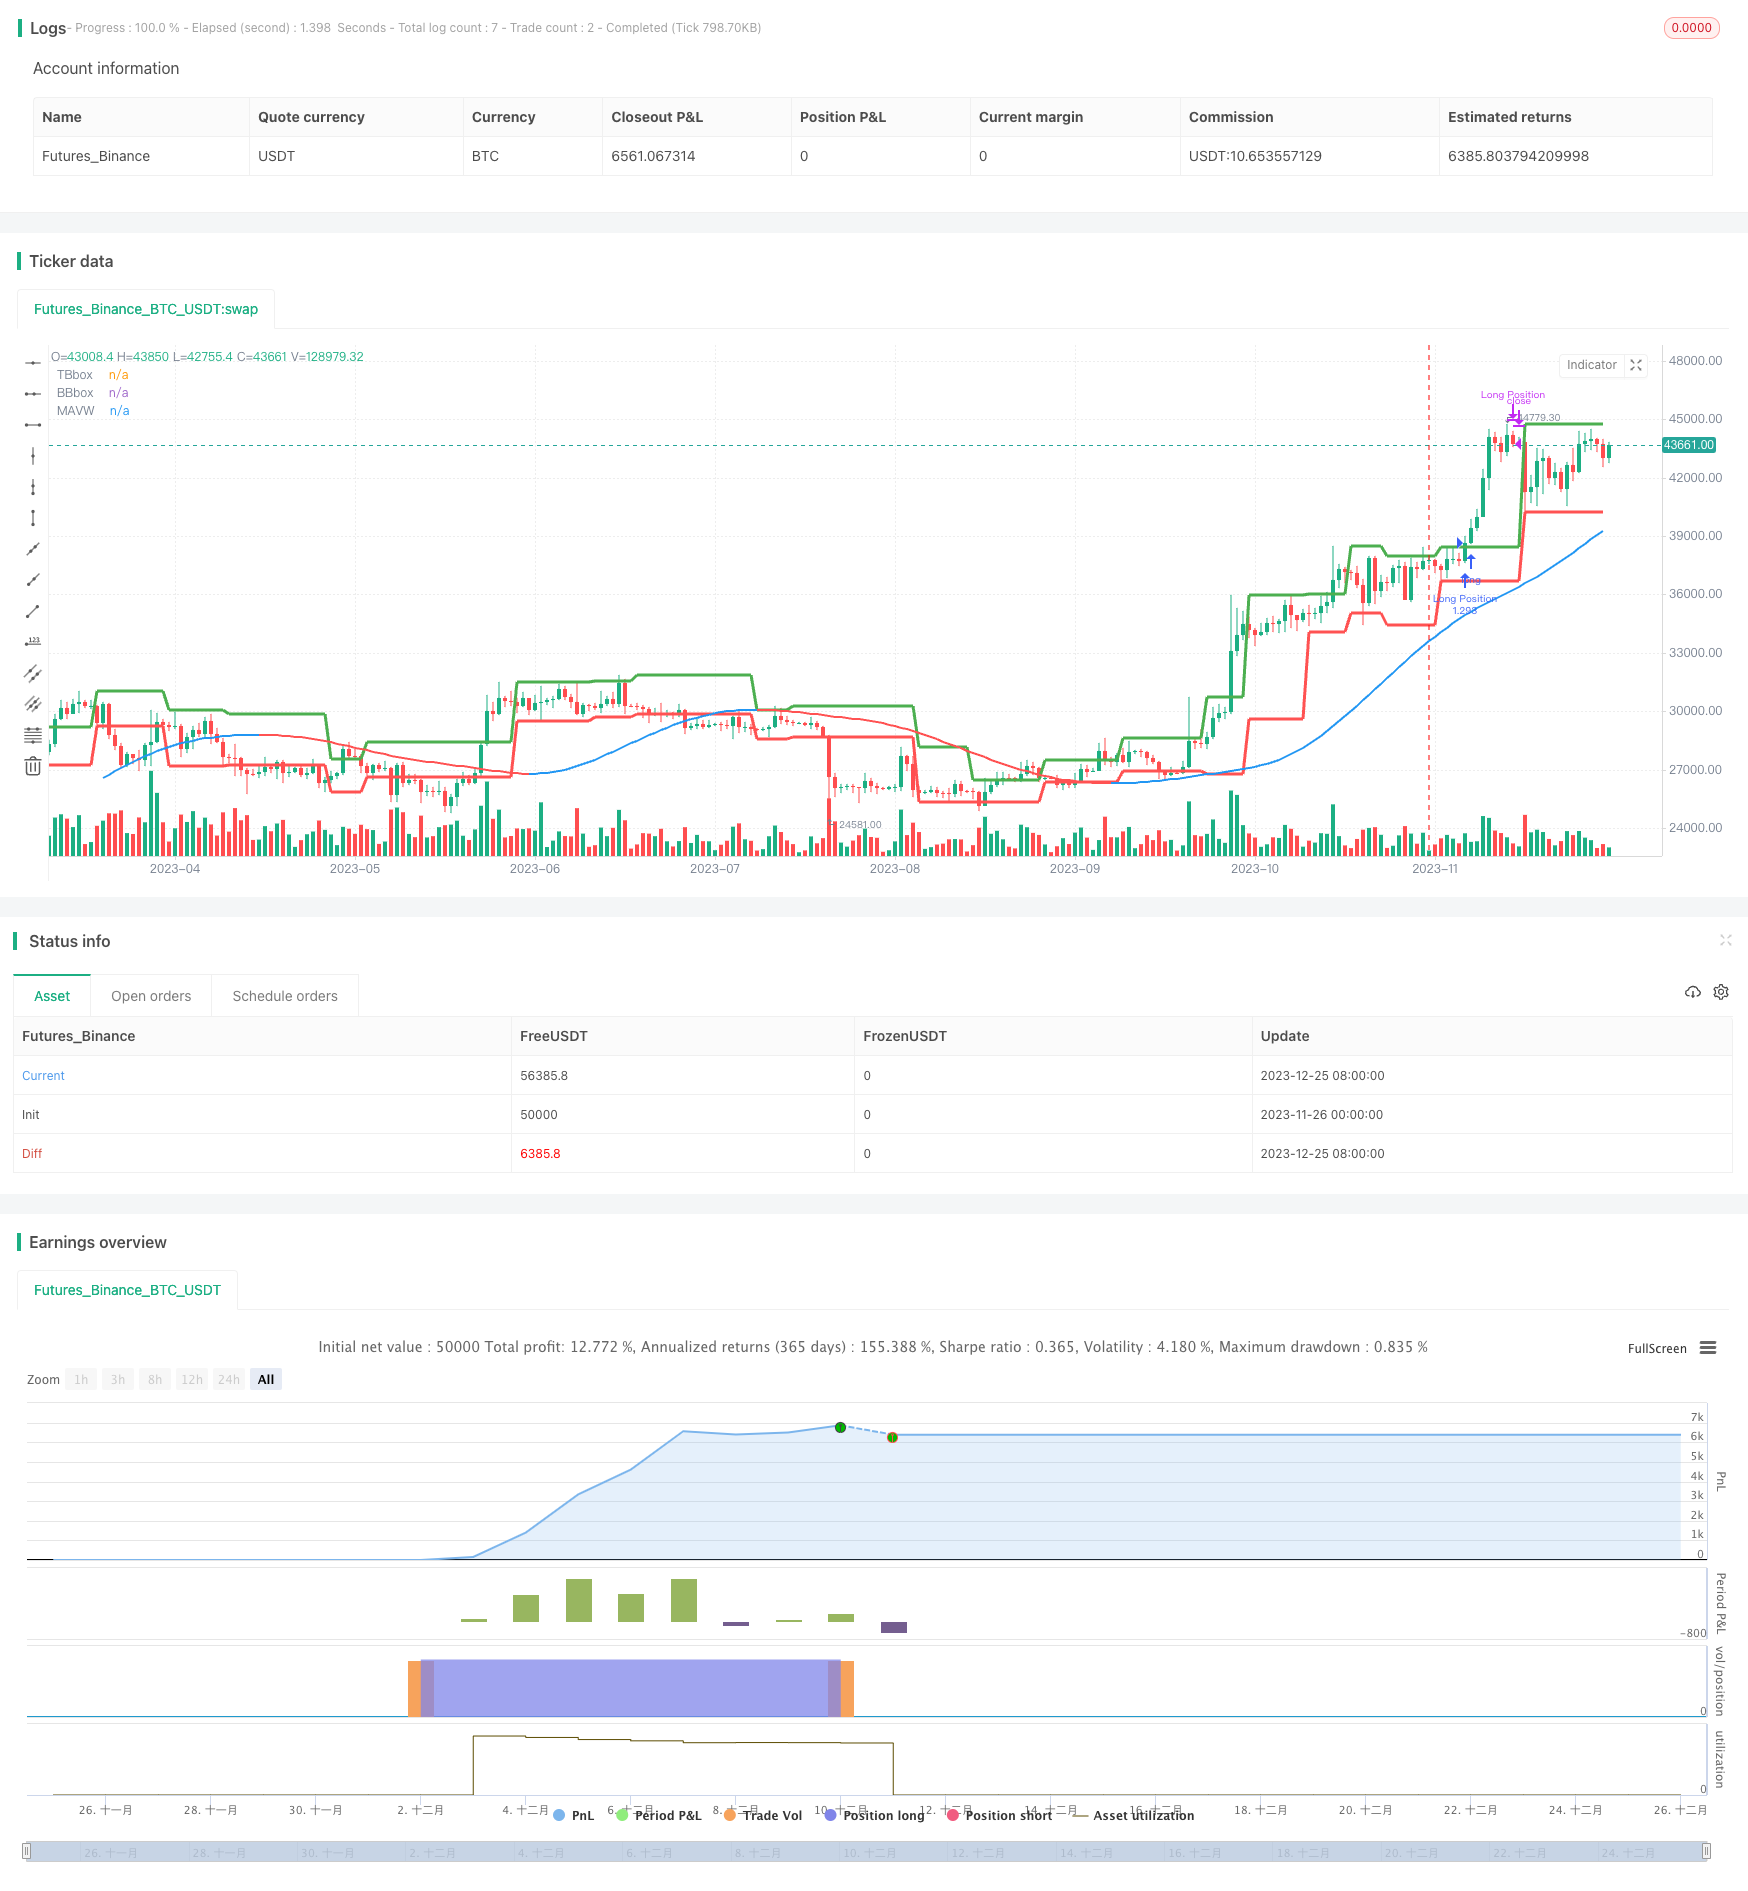
震动宝盒量化交易策略是一个利用 Darvas 箱体通道来捕捉市场趋势的短线交易策略。该策略主要依赖震动宝盒指标来判断市场走势和寻找交易机会。当价格突破宝盒上沿时,做多;当价格跌破宝盒下沿时,做空。同时,该策略还利用多种辅助指标来提高策略的稳定性。
- 利用 length 参数设置震动宝盒的长度。该策略中默认长度为 5 根K线。
- 根据高点突破和低点跌破来判断趋势,并相应做多做空。
- 当价格突破宝盒上沿时会在图表上画出绿色的 TopBox 线。这是做多的信号。
- 当价格跌破宝盒下沿时会在图表上画出红色的 BottomBox 线。这是做空的信号。
- 利用多均线系统作为辅助判断指标。当价格高于均线多头,低于均线空头。
- 利用 RVI 指标判断超买超卖区域。RVI 高于 Signal 线时为超买信号。RVI 低于 Signal 线时为空头信号。
以上多个指标综合判断之后进行入场。止损价格为宝盒的对边。止盈 EXIT 则利用 RVI 的方向性来关闭订单。
- 利用宝盒通道判断市场趋势方向,避免被错漏大趋势的机会。
- 宝盒通道容易形成,获取信号的频率高。
- 宝盒止损位设置合理,能很好控制单笔止损。
- 多均线和 RVI 辅助判断,可以提高决策的准确性。
- 震动宝盒止损位置比较宽,单笔亏损风险较大。
- 多头持仓时,短期调整可能被止损。
- 宝盒通道形成的方向性并不总是正确的,存在错误信号。
- 需要适当调整参数来使辅助指标配合宝盒使用。
可以通过适当收紧止损位来降低风险。另外,辅助指标的参数也需要测试调整,使其起到最好的筛选作用。
- 测试不同长度的宝盒参数,找到最佳长度。
- 优化辅助指标的参数,使其与宝盒配合最佳。
- 尝试其他辅助指标来进一步验证信号。例如 KDJ,MACD 等。
- 对止损位和止盈条件进行测试,使策略更稳定。
震动宝盒量化交易策略总体来说是一种较为活跃的短线交易策略。它能及时捕捉市场的趋势变化,利用宝盒通道开仓;而辅助指标的配合则能提高决策的准确性。该策略风险收益特征积极,值得采用并不断优化。
||
The Trending Darvas Box strategy is a short-term trading strategy that uses Darvas box channel to capture market trends. The core mechanism relies on the Darvas Box indicator to determine market momentum and locate trading opportunities. It goes long when price breaks above box top, and goes short when price breaks below box bottom. In addition, this strategy also utilizes other auxiliary indicators to enhance stability.
- Use length parameter to set the size of the Darvas box, which is 5 bars by default in this strategy.
- Determine trend direction based on high/low breakouts, and take corresponding long/short positions.
- When price breaks above box top, a green TopBox line is plotted. This is the long signal.
- When price breaks below box bottom, a red BottomBox line is plotted. This is the short signal.
- Use Moving Average system as auxiliary indicator. Go long when price is above MAs, and go short when below MAs.
- Use RVI to identify overbought/oversold zone. RVI above Signal line suggests overbought; RVI below suggests oversold.
Entries are taken when all above indicators give consent. The stop loss is set at the opposite band of the Darvas box. Exits are managed with RVI directionality.
- Darvas box channel effectively captures market trend. Reduces missed opportunities.
- Frequent box breakout signals. Good frequency of entries.
- Reasonable box stops loss setting. Well controls single trade risk.
- Auxiliary indicators enhance accuracy.
- Wide stop loss range of the box. Larger risk per trade.
- Long trades may be stopped out during minor pullbacks.
- Box directionality not always correct. Potential bad signals.
- Fine tuning needed for auxiliary indicators to align with box.
Can tighten stop loss to reduce risk. Auxiliary parameters also need optimization to screen signals effectively.
- Test box lengths to find optimum size.
- Optimize auxiliary parameters to best fit the box.
- Try other auxiliary indicators for further signal verification, e.g. KDJ, MACD.
- Test stop loss and take profit settings for higher stability.
In summary, the Trending Darvas Box strategy is an aggressively trading strategy targeting short-term trends. It captures trend changes swiftly with the Darvas box channel, while auxiliary indicators helps improving accuracy. The risk/reward profile is positive for this strategy, worth adopting and continuous optimizations.
[/trans]
Strategy Arguments
| Argument | Default | Description |
|---|---|---|
| v_input_1 | timestamp(7 Mar 2022 00:00 +0000) | (?Backtest Range)From |
| v_input_2 | timestamp(19 Mar 2022 23:59 +0000) | To |
| v_input_3 | 5 | (?Darvas Box)Box Length |
| v_input_4 | 3 | (?MavilimW)First Moving Average length |
| v_input_5 | 5 | Second Moving Average length |
| v_input_int_1 | 10 | (?Relative Vigor Index)Length |
| v_input_int_2 | false | Offset |
Source (PineScript)
/*backtest
start: 2023-11-26 00:00:00
end: 2023-12-26 00:00:00
period: 1d
basePeriod: 1h
exchanges: [{"eid":"Futures_Binance","currency":"BTC_USDT"}]
*/

// This source code is subject to the terms of the Mozilla Public License 2.0 at https://mozilla.org/MPL/2.0/
// © xxy_theone
// https://www.youtube.com/watch?v=YYxlnFOX9sQ
// This strategy script has been made to backtest the strategy explained in the video above


//@version=5
strategy(shorttitle = "Darvas Box Test", title="TradeIQ Darvas Box Test", overlay=true, pyramiding=0, default_qty_type=strategy.percent_of_equity, default_qty_value=100, initial_capital=100, currency=currency.USD)

// === INPUT BACKTEST RANGE ===
var GRP1 = "Backtest Range"
fromDate = input(timestamp("7 Mar 2022 00:00 +0000"), "From", group=GRP1)
toDate = input(timestamp("19 Mar 2022 23:59 +0000"), "To", group=GRP1)
window() =>  true


var GRP3 = "Darvas Box"
boxp=input(5, "Box Length", group=GRP3)

LL = ta.lowest(low,boxp)
k1=ta.highest(high,boxp)
k2=ta.highest(high,boxp-1)
k3=ta.highest(high,boxp-2)

NH =  ta.valuewhen(high>k1[1],high,0)
box1 =k3<k2
TopBox = ta.valuewhen(ta.barssince(high>k1[1])==boxp-2 and box1, NH, 0)
BottomBox = ta.valuewhen(ta.barssince(high>k1[1])==boxp-2 and box1, LL, 0)


plot(TopBox, linewidth=3, color=color.green, title="TBbox")
plot(BottomBox, linewidth=3, color=color.red, title="BBbox")


var GRP4 = "MavilimW"

fmal=input(3,"First Moving Average length", group=GRP4)
smal=input(5,"Second Moving Average length", group=GRP4)
tmal=fmal+smal
Fmal=smal+tmal
Ftmal=tmal+Fmal
Smal=Fmal+Ftmal

M1= ta.wma(close, fmal)
M2= ta.wma(M1, smal)
M3= ta.wma(M2, tmal)
M4= ta.wma(M3, Fmal)
M5= ta.wma(M4, Ftmal)
MAVW= ta.wma(M5, Smal)
col1= MAVW>MAVW[1]
col3= MAVW<MAVW[1]
colorM = col1 ? color.blue : col3 ? color.red : color.yellow

plot(MAVW, color=colorM, linewidth=2, title="MAVW")


var GRP5 = "Relative Vigor Index"
len = input.int(10, title="Length", minval=1, group=GRP5)
rvi = math.sum(ta.swma(close-open), len)/math.sum(ta.swma(high-low),len)
sig = ta.swma(rvi)
offset = input.int(0, "Offset", minval = -500, maxval = 500, group=GRP5)
//plot(rvi, color=#008000, title="RVGI", offset = offset)
//plot(sig, color=#FF0000, title="Signal", offset = offset)


var longStopSet = false

long = ta.crossover(close,TopBox) and close > MAVW ? true : false
longClose = strategy.opentrades.profit(strategy.opentrades-1)>0 and ta.crossunder(rvi,sig) ? true : false
strategy.entry("Long Position", strategy.long, when = long and window() and strategy.position_size==0 and strategy.closedtrades<100)
if(longStopSet==false and strategy.position_size > 0)
    strategy.exit("exit", "Long Position", stop=BottomBox)
    longStopSet := true
if(strategy.position_size==0)
    longStopSet := false
strategy.close("Long Position", when = longClose)

var shortStopSet = false

short = ta.crossunder(close,BottomBox) and close < MAVW ? true : false
shortClose = strategy.opentrades.profit(strategy.opentrades-1)>0 and ta.crossover(rvi,sig) ? true : false
strategy.entry("Short Position", strategy.short, when = short and window() and strategy.position_size==0 and strategy.closedtrades<100)
if(shortStopSet==false and strategy.position_size < 0)
    strategy.exit("exit", "Short Position", stop=TopBox)
    shortStopSet := true
if(strategy.position_size==0)
    shortStopSet := false
strategy.close("Short Position", when = shortClose)
Detail
https://www.fmz.com/strategy/436757
Last Modified
2023-12-27 14:45:41
