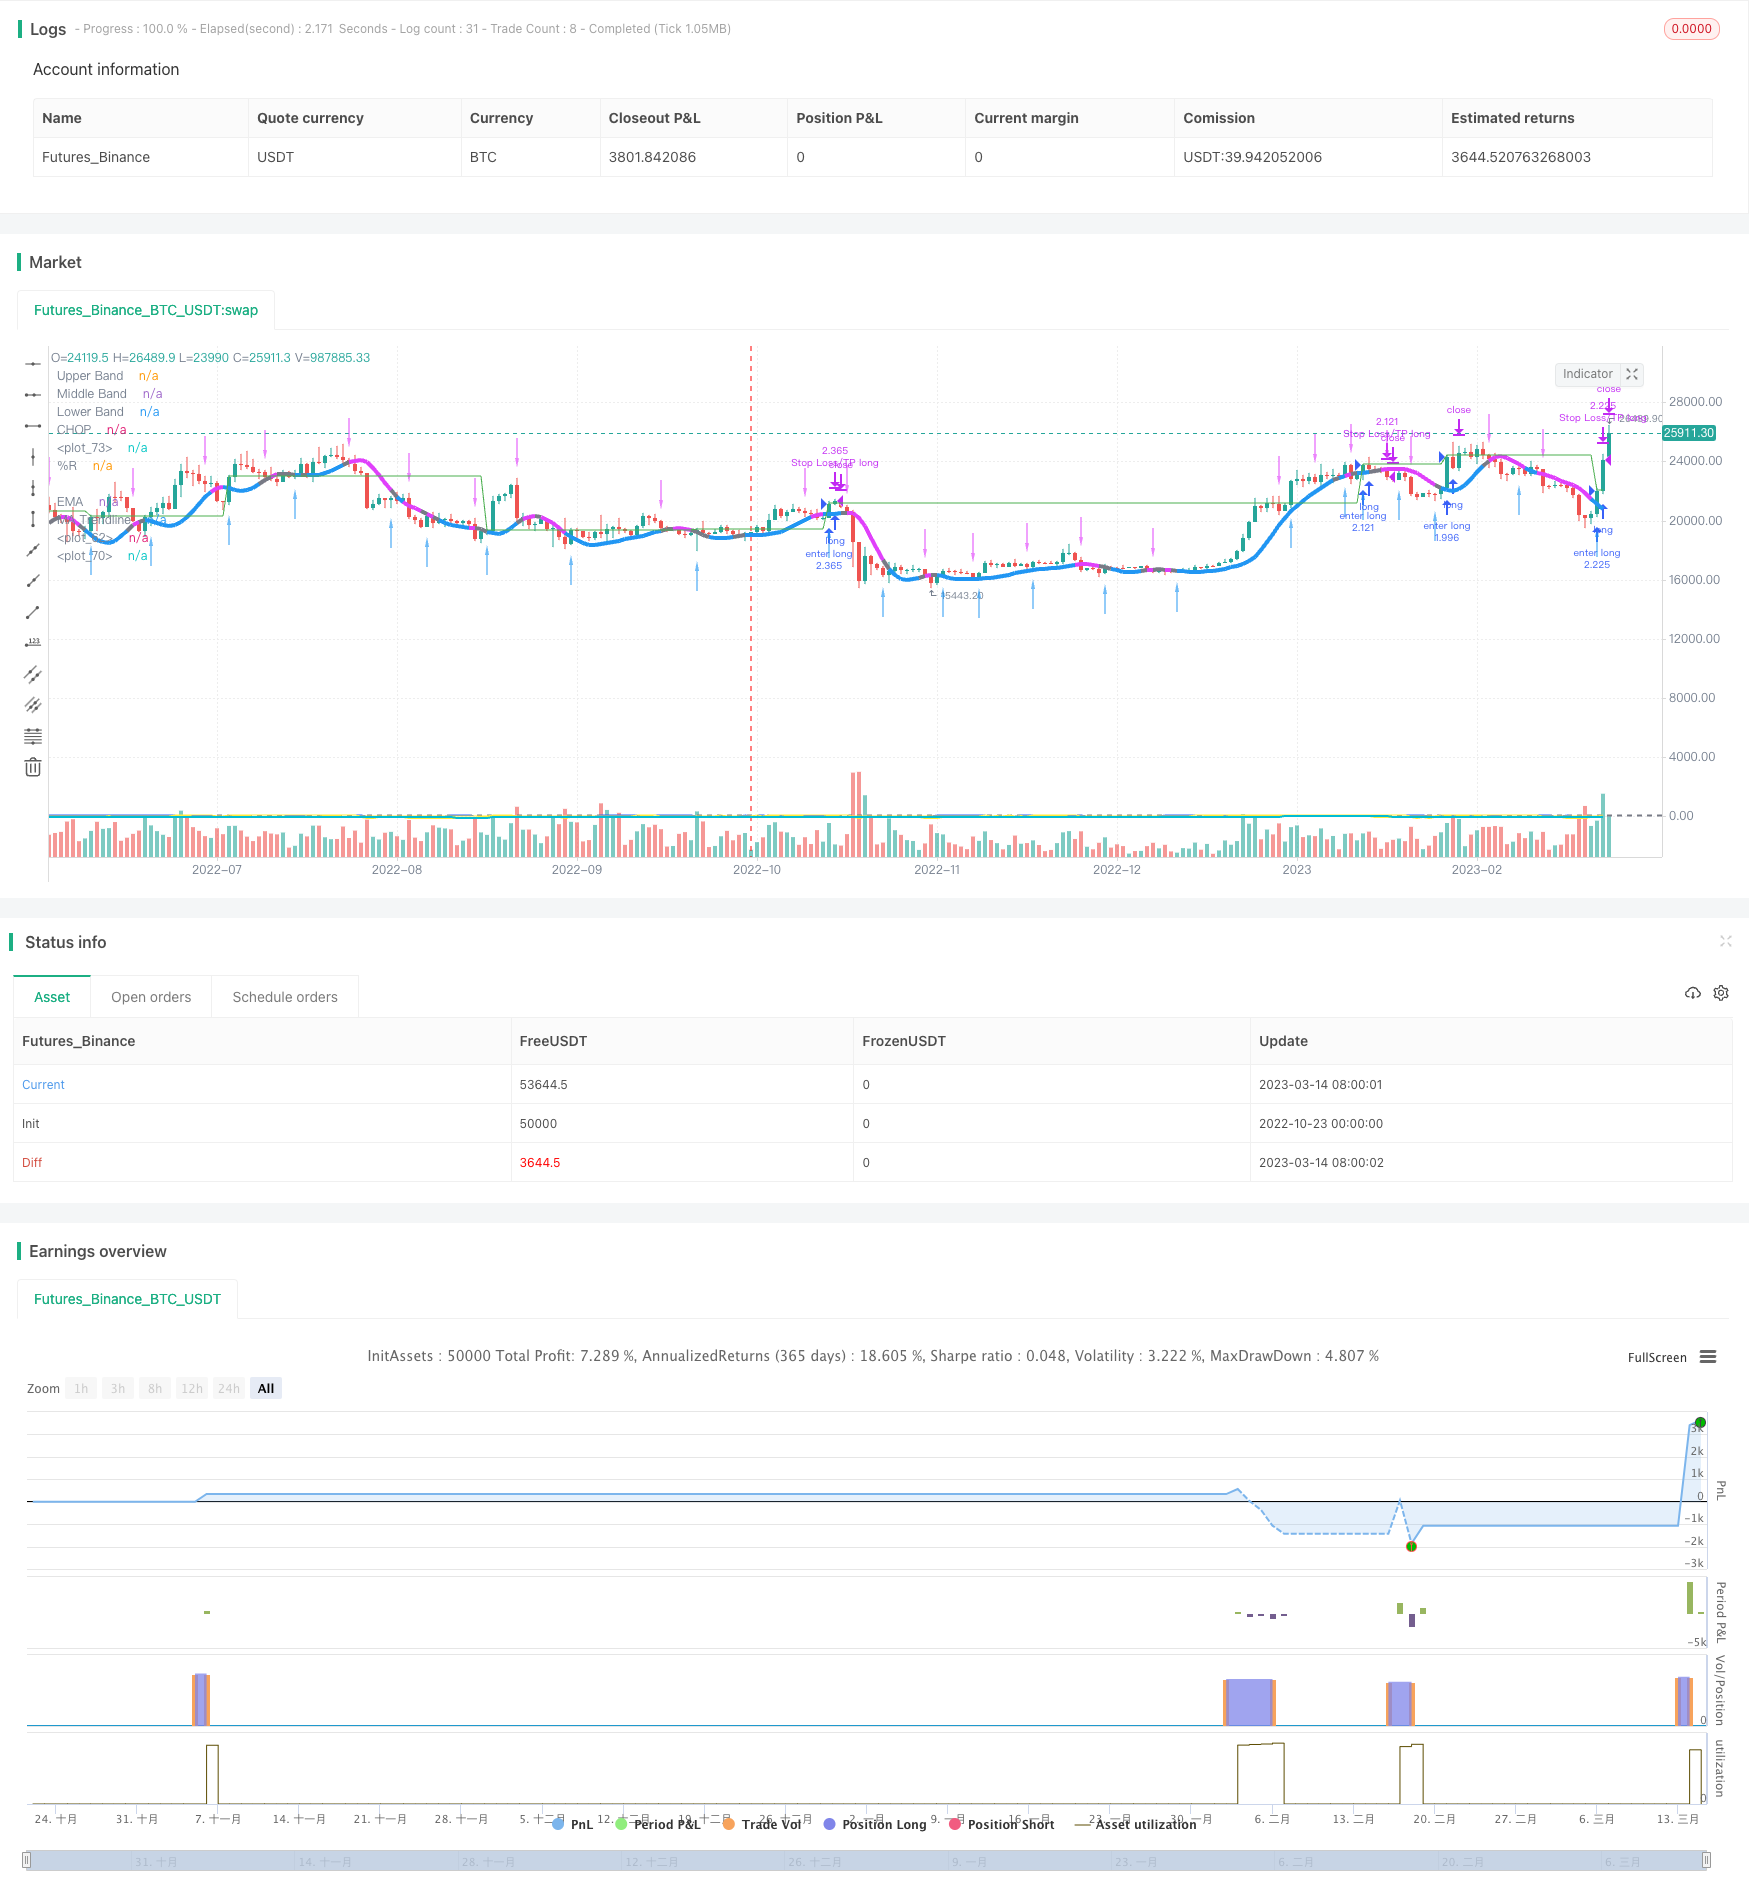
Name
震荡突破均线追踪策略MA-Trendline-Breakthrough-Strategy
Author
ChaoZhang
Strategy Description
[trans]
本策略通过追踪均线的突破,在震荡市实现持续盈利。
该策略主要基于均线的突破原理进行建仓,使用 MA 聚合多重均线,形成主均线。当价格突破主均线时产生交易信号。
具体来说,策略采用 60 周期的 WMA 双滑动平均线作为主均线。同时,计算价格的真实波动范围,并绘制上下通道。价格突破上轨时看涨,突破下轨时看跌。
在突破基础上,策略还引入 RSI 指标和 EMA 指标进行辅助判断,要求 RSI>50 且价格高于 EMA 时做多,RSI<50 且价格低于 EMA 时做空,从而避免假突破。
此外,策略利用三重均线的强弱态势判断结束仓位。当三重均线formations为弱势时(-1),选择退出点为反向突破通道。
- 使用 MA 多重均线,能够有效平滑价格变动,识别趋势方向
- 基于通道突破交易,可在震荡行情中获取较大利润
- 结合 RSI 和 EMA 进行辅助判断,可过滤假突破信号
- 利用三重均线状态判断适当退出点位,可避免衰竭行情
- 大幅震荡行情中,MA 主均线可能产生较多假突破
- 三重均线判断的退出时机可能不精确
- RSI 参数设置不当可能导致交易频率过高
可通过优化 MA 周期参数,调整三重均线设置,谨慎使用 RSI 参数等方法降低风险。
- 优化 MA 周期参数,寻找更合适的主均线周期
- 尝试不同的辅助指标替换 RSI,如 KDJ、MACD 等
- 调整三重均线参数,寻找更准确的反转时机
- 添加止损策略,控制单笔交易风险
本策略整体来说是一个非常适合震荡行情的突破策略。核心思路是基于 MA 突破建仓,辅以趋势指标过滤,在震荡行情中持续盈利。同时结合三重均线判断反转时机提前退出。该策略优化空间较大,可从调整参数、改进入场退出等方面进行优化,在震荡行情中可能获得较好的效果。
||
This strategy realizes continuous profitability in volatile markets by tracking moving average line breakthroughs.
The core logic of this strategy is to open positions based on moving average line breakthroughs. It uses MA to aggregate multiple moving averages to form the main moving average line. Trading signals are generated when the price breaks through the main moving average line.
Specifically, the strategy adopts a 60-period WMA double moving average as the main moving average line. At the same time, it calculates the true range of the price and draws upper and lower bands. Go long when the price breaks through the upper band, and go short when it breaks through the lower band.
On top of the breakthrough signals, the strategy also incorporates RSI and EMA as auxiliary indicators. It requires RSI>50 and price above EMA to go long, and RSI<50 and price below EMA to go short, so as to avoid false breakouts.
In addition, the strategy uses triple moving average formations to determine exit points. When the triple moving averages are in a weak formation (-1), the exit point is chosen as the reverse breakthrough of the channel.
- Using MA to smooth price changes, it can effectively identify trend directions
- Trading based on channel breakouts can generate decent profits in range-bound markets
- Combining RSI and EMA avoids false breakout signals
- Using triple MA formations to determine exit points avoids exhausted trends
- MA lines may generate many false breakouts in wildly fluctuating markets
- Triple MA exit timings may not be very accurate
- Improper RSI parameters can lead to over-trading
These risks can be reduced by optimizing MA periods, tuning triple MA settings, using RSI cautiously etc.
- Optimize MA periods to find better settings for the main moving average line
- Try different auxiliary indicators to replace RSI, e.g. KDJ, MACD etc.
- Adjust triple MA parameters to identify reversal points more precisely
- Add stop loss to control risk per trade
In summary, this is an excellent breakout strategy for range-bound markets. The core idea is to open positions based on MA breakouts, filtered by trend indicators, and realize steady profits in non-trending markets. Exits are determined earlier using triple MA formations. There is ample room for optimizing parameters, improving entry/exit logic etc. to maximize performance in ranging markets.
[/trans]
Strategy Arguments
| Argument | Default | Description |
|---|---|---|
| v_input_1 | 0.1 | Stop Loss % |
| v_input_2 | 0.33 | Take Profit % |
| v_input_3 | 21 | length |
| v_input_int_1 | 14 | lengthChop |
| v_input_int_2 | false | Offset |
| v_input_4 | 13 | EMA |
Source (PineScript)
/*backtest
start: 2022-10-23 00:00:00
end: 2023-03-15 00:00:00
period: 1d
basePeriod: 1h
exchanges: [{"eid":"Futures_Binance","currency":"BTC_USDT"}]
*/


//@version=5

//exapple bot
strategy('RIPO BOT', shorttitle='RIPO BOT', overlay=true, process_orders_on_close=true, calc_on_order_fills=false, default_qty_type=strategy.percent_of_equity, default_qty_value=100)
sl_inp = input(0.1, title='Stop Loss %') / 100
tp_inp = input(0.33, title='Take Profit %') / 100

length = input(defval=21)
upper = ta.highest(length)
lower = ta.lowest(length)

lengthChop = input.int(14, minval=1)
ci = 100 * math.log10(math.sum(ta.atr(1), lengthChop) / (ta.highest(lengthChop) - ta.lowest(lengthChop))) / math.log10(lengthChop)
offset = input.int(0, "Offset",  minval = -500, maxval = 500)
plot(ci, "CHOP", color=#2962FF, offset = offset)
band1 = hline(61.8, "Upper Band", color=#787B86, linestyle=hline.style_dashed)
hline(50, "Middle Band", color=color.new(#787B86, 50))
band0 = hline(38.2, "Lower Band", color=#787B86, linestyle=hline.style_dashed)
fill(band1, band0, color = color.rgb(33, 150, 243, 90), title = "Background")

rsi = ta.rsi(close, 14)

var float entry_price = na

output = 100 * (close - upper) / (upper - lower)
ema = ta.ema(output, input(defval=13, title='EMA'))

ma(src, len) =>
    ta.wma(2 * ta.wma(src, len / 2) - ta.wma(src, len), math.round(math.sqrt(len)))
BBMC = ma(close, 60)
rangema = ta.ema(ta.tr, 60)
upperk = BBMC + rangema * 0.2
lowerk = BBMC - rangema * 0.2
color_bar = close > upperk ? color.blue : close < lowerk ? color.fuchsia : color.gray

ExitHigh = ma(high, 15)
ExitLow = ma(low, 15)
Hlv3 = int(na)
Hlv3 := close > ExitHigh ? 1 : close < ExitLow ? -1 : Hlv3[1]
sslExit = Hlv3 < 0 ? ExitHigh : ExitLow
base_cross_Long = ta.crossover(close, sslExit)
base_cross_Short = ta.crossover(sslExit, close)
codiff = base_cross_Long ? 1 : base_cross_Short ? -1 : na
entry_long = false

entry_short = false


if ta.crossover(close, BBMC) and output > ema
    entry_long := true

if ta.crossunder(close, BBMC) and output < ema
    entry_short := true

if entry_long and strategy.position_size == 0
    entry_price := close
    strategy.entry('enter long', strategy.long, comment='ENTER-LONG_BYBIT_MATICUSDT_BOT-NAME_1M_85915e4dc80fb663')
if strategy.position_size > 0
    strategy.exit('Stop Loss/TP long', 'enter long', limit=entry_price * (1 + tp_inp), stop = color_bar == color.fuchsia ? BBMC : na, comment='EXIT-LONG_BYBIT_MATICUSDT_BOT-NAME_1M_85915e4dc80fb663')
plot(entry_price * (1 + tp_inp), color=color.new(color.green, 0))


//if entry_short and strategy.position_size == 0
    //entry_price := close
    //strategy.entry('enter short', strategy.short, comment='ENTER-SHORT_BYBIT_MATICUSDT_BOT-NAME_1M_85915e4dc80fb663')
if strategy.position_size < 0
    strategy.exit('Stop Loss/TP short', 'enter short', limit=entry_price * (1 - tp_inp), stop = color_bar == color.blue ? BBMC : na, comment='EXIT-SHORT_BYBIT_MATICUSDT_BOT-NAME_1M_85915e4dc80fb663')
plot(entry_price * (1 + tp_inp), color=color.new(color.green, 0))
// plot(entry_price * (1 - sl_inp), color=color.new(color.red, 0))

plot(rsi, color=color.yellow)

plot(output, title='%R', color=color.new(color.yellow, 0), linewidth=2)
plot(ema, title='EMA', color=color.new(color.aqua, 0), linewidth=2)

plotarrow(codiff, colorup=color.new(color.blue, 35), colordown=color.new(color.fuchsia, 35), title='Exit Arrows', maxheight=20, offset=0)
plot(BBMC, color=color_bar, linewidth=4, title='MA Trendline')
Detail
https://www.fmz.com/strategy/430553
Last Modified
2023-10-30 11:39:31
