Name
EMA百分比通道与布林带区间交易策略EMA-Percentage-Channel-with-Bollinger-Band-Range-Trading-Strategy
Author
ChaoZhang
Strategy Description
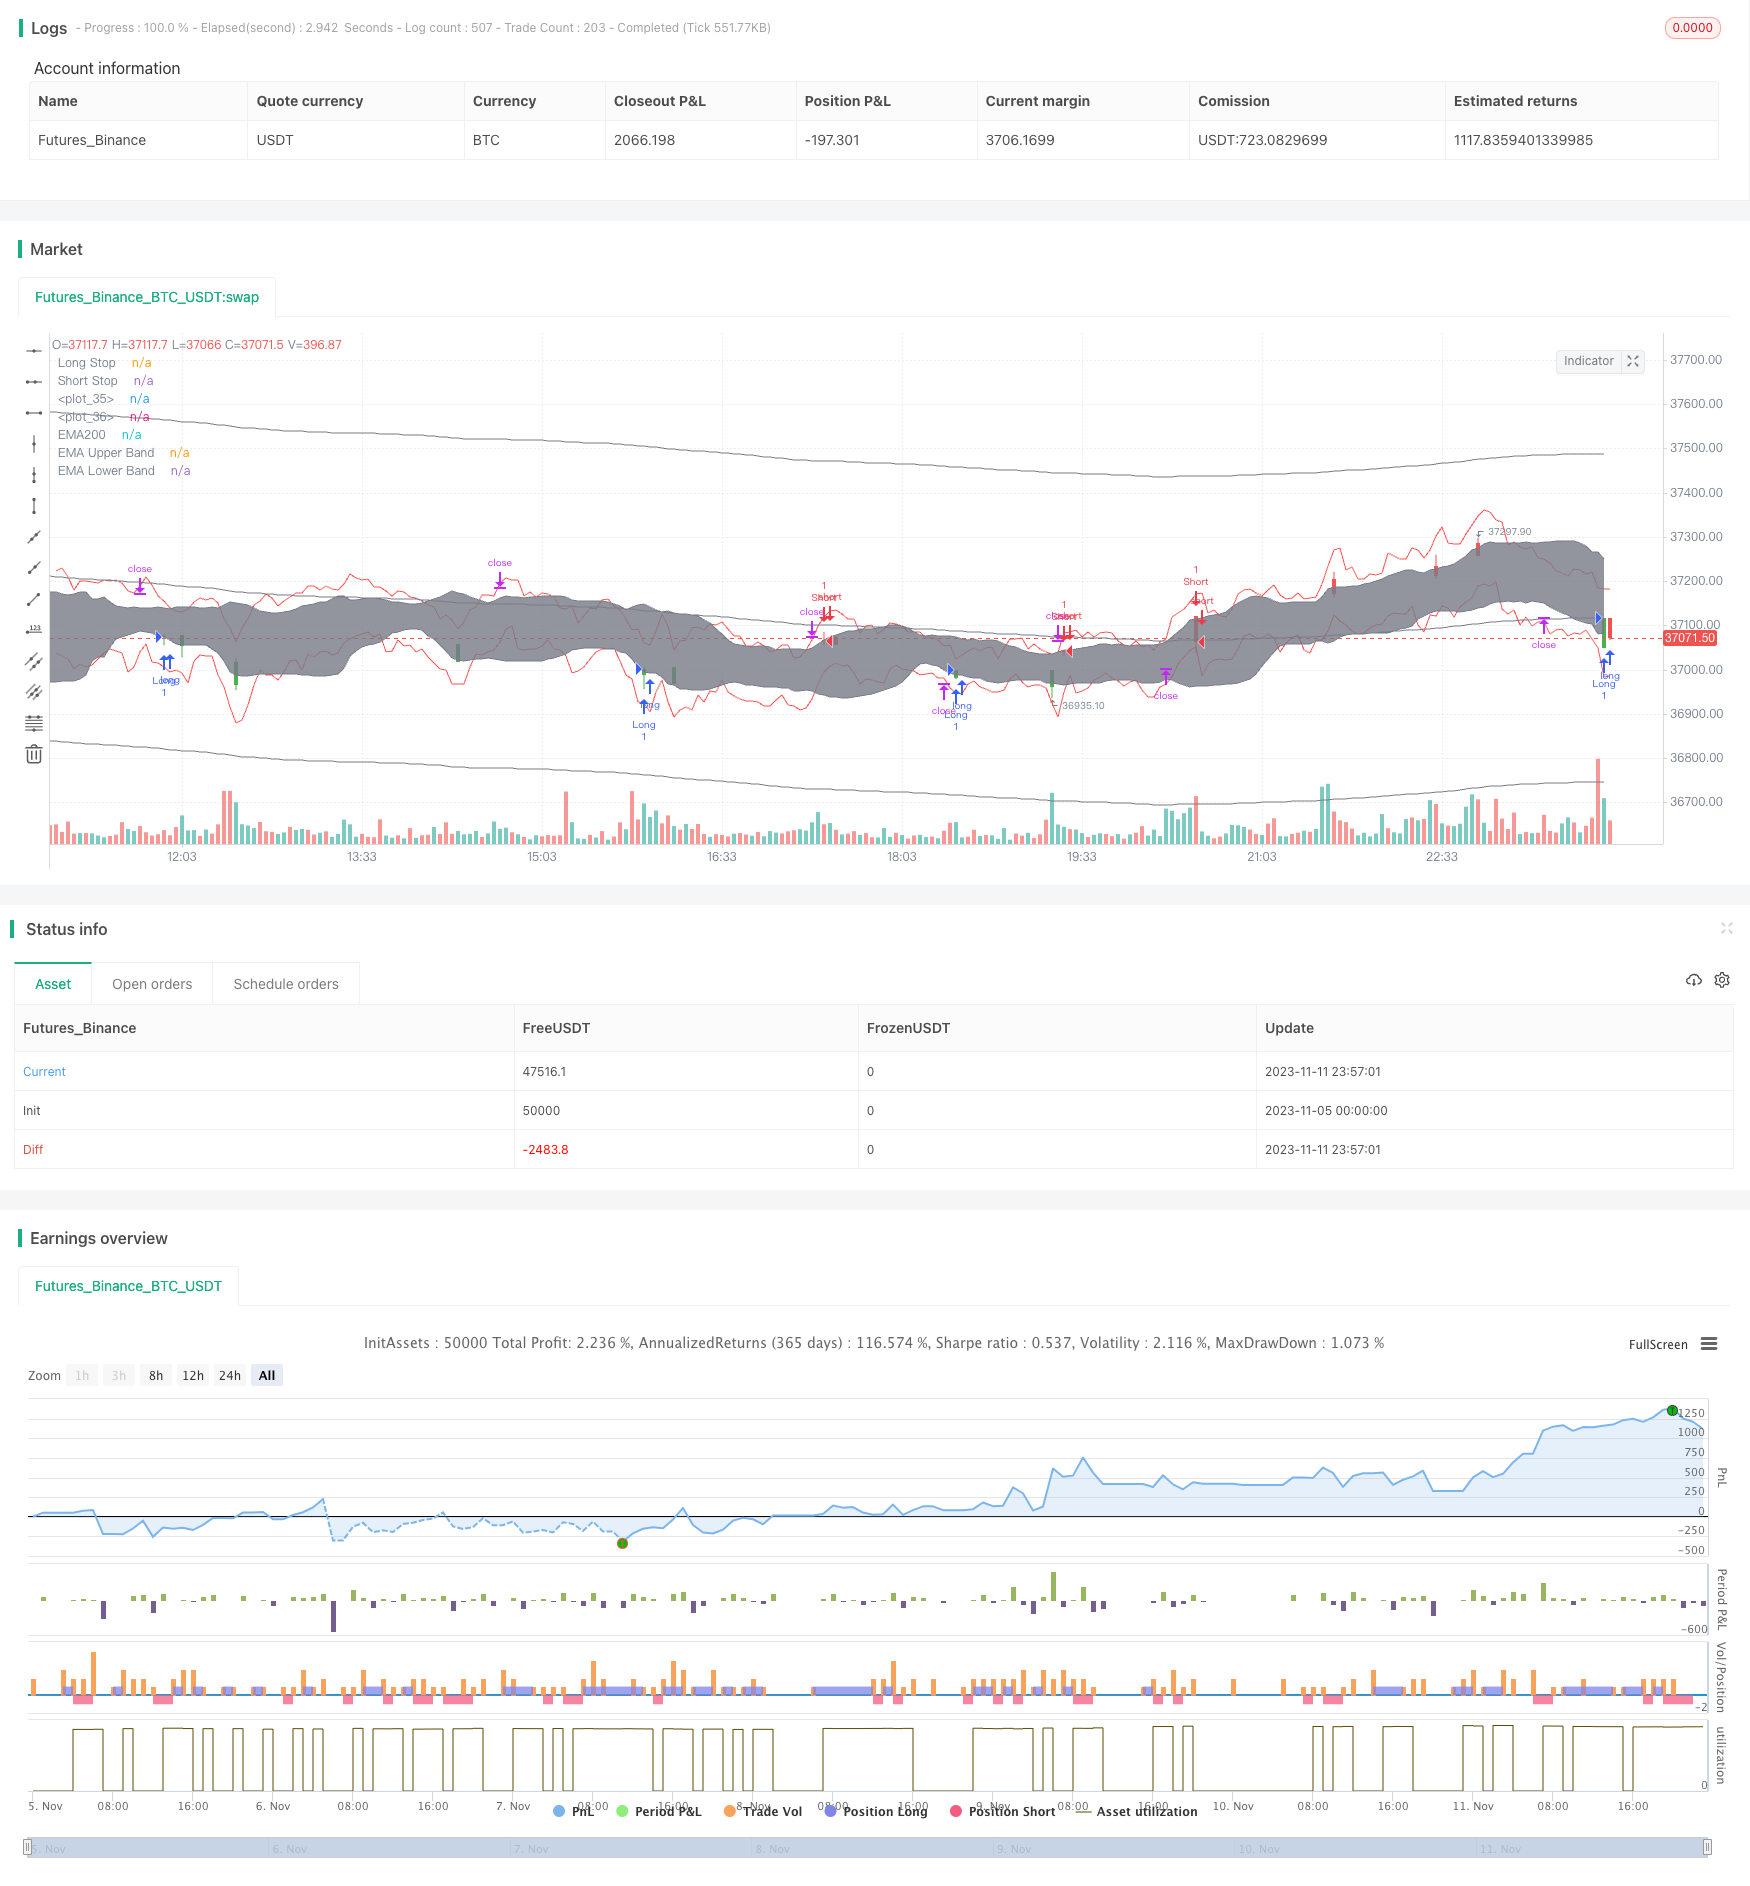
该策略基于用户选择的EMA和定义的百分比通道。当价格低于上轨时,策略做多;当价格高于下轨时,策略做空。如果价格开始趋势交易并突破通道,则平仓所有头寸,以防止损失。
对于趋势性市场,建议使用配套的“EMA百分比通道与布林带趋势交易策略”。
-
计算200周期的EMA作为基准EMA。
-
根据用户设置的百分比,计算上下轨: 上轨 = EMA * (1 + 百分比) 下轨 = EMA * (1 - 百分比)
-
计算20周期的布林带,描绘通道范围。
-
当收盘价由下向上突破布林带下轨时,做多;当收盘价由上向下突破布林带上轨时,做空。
-
使用ATR计算止损位,避免过大亏损。
-
如果价格超出设置的百分比通道范围,则平仓所有头寸,防止进一步损失。
-
使用EMA作为基准,可以更好地捕捉趋势转换点。
-
百分比通道设定合理的交易范围,避免过于频繁交易。
-
布林带提供支撑阻力位,辅助判断进场时机。
-
使用ATR trailing stopdynamically设置止损,有效控制单笔交易风险。
-
价格超出通道则全部平仓,可快速控制损失。
-
可自定义的参数设置灵活,可针对不同市场调整。
-
如果百分比通道范围过宽,可能错过趋势或防止亏损不及时。
-
如果百分比通道范围过窄,可能过于频繁交易,增加交易成本。
-
布林带参数设置不当也可能导致错过交易机会。
-
停损点设定过于宽松可能导致单笔亏损过大。
-
需要适当优化参数以找到最佳交易范围。
-
测试不同的EMA周期参数,找到最适合的均线周期。
-
优化百分比通道参数,寻找最佳通道范围。
-
调整布林带周期参数,优化捕捉波动的效果。
-
调整ATR周期和倍数,进一步优化止损策略。
-
测试仅做多上方或做空下方的条件,看是否能提高胜率。
-
结合趋势指标,判断是否需要提前平仓。
该策略综合利用均线、通道、波动率等多种指标的优势,实现了较为稳定的区间交易策略。关键是找到最适合特定市场的各项参数设置,实现风险和收益的平衡。未来可继续优化参数及策略规则,或与趋势交易策略组合使用。
||
This strategy is based on the user's selection of an EMA and defined percentage channel. It goes long when the price is below the upper band and goes short when the price is above the lower band. If the price starts trending and moves outside the channel, all positions are closed to prevent loss.
For trending markets, the sister "EMA Percentage Channel with Bollinger Band Trend Trading Strategy" should be used instead.
-
Calculate the 200-period EMA as the baseline EMA.
-
Calculate the upper and lower bands based on the user-defined percentage: Upper Band = EMA * (1 + Percentage) Lower Band = EMA * (1 - Percentage)
-
Calculate the 20-period Bollinger Bands to depict the channel range.
-
Go long when the closing price crosses above the lower Bollinger Band from below. Go short when the closing price crosses below the upper Bollinger Band from above.
-
Use ATR to calculate the stop loss to avoid excessive losses.
-
If the price moves outside the defined percentage channel range, close all positions to prevent further losses.
-
The EMA baseline helps better capture trend reversal points.
-
The percentage channel sets a reasonable trading range to avoid overtrading.
-
The Bollinger Bands provide support and resistance levels to aid entry timing.
-
The ATR trailing stop dynamically sets stop loss to effectively control per trade risk.
-
Closing all positions when the price breaches the channel quickly controls losses.
-
The customizable parameters are flexible for different market conditions.
-
A channel range that is too wide may miss trends or delay stopping losses.
-
A channel range that is too narrow may cause overtrading and increase transaction costs.
-
Poor Bollinger Bands parameter settings may cause missed trading opportunities.
-
A stop loss threshold set too loosely can lead to excessive losses per trade.
-
Parameters need to be optimized to find the optimal trading range.
-
Test different EMA periods to find the most suitable moving average.
-
Optimize the percentage channel parameters to determine the optimal channel range.
-
Adjust the Bollinger Bands period to better capture volatility.
-
Tune the ATR period and multiplier to further refine the stop loss strategy.
-
Test long-only above EMA or short-only below EMA conditions and see if it improves win rate.
-
Incorporate trend indicators to determine if early exit is needed.
This strategy combines the strengths of moving averages, channels, volatility and more to create a relatively stable range trading system. The key is finding the most suitable parameter settings for each specific market to balance risk and reward. Future improvements can continue optimizing rules and parameters, or combining with trend strategies.
[/trans]
Strategy Arguments
| Argument | Default | Description |
|---|---|---|
| v_input_1 | 200 | EMA Length |
| v_input_2_close | 0 | EMA Source: close |
| v_input_3 | true | Channel Percentage (%) |
| v_input_4 | 20 | length |
| v_input_5_close | 0 | Close price: close |
| v_input_6 | 2 | mult |
| v_input_7 | 14 | (?ATR Settings)ATR Period |
| v_input_8 | 1.75 | ATR Multiplier Period |
Source (PineScript)
/*backtest
start: 2023-11-05 00:00:00
end: 2023-11-12 00:00:00
period: 3m
basePeriod: 1m
exchanges: [{"eid":"Futures_Binance","currency":"BTC_USDT"}]
*/

//@version=4
strategy(title="[mdeacey] EMA% Channel + BB Range Strategy", shorttitle="[mdeacey] EMA% Channel + BB Range Strategy", overlay=true)

//EMA 200

len = input(title="EMA Length", type=input.integer, defval=200)
srce = input(title="EMA Source", type=input.source, defval=close)

ema1= ema(srce,len)

percent = input(title="Channel Percentage (%)", type=input.float, defval= 1)
valuee = (percent*ema1)/100
upperbande = ema1 + valuee
lowerbande = ema1 - valuee


plot(ema1, title='EMA200', color=color.gray, linewidth=1, style=plot.style_line )
plot(upperbande, title='EMA Upper Band', color=color.gray, linewidth=1, style=plot.style_line )
plot(lowerbande, title='EMA Lower Band', color=color.gray, linewidth=1, style=plot.style_line )

length = input(20, minval=2)
src = input(close, title="Close price")
mult = input(2.0, minval=0.001, maxval=50)

MA2 = sma(src, length)
dev = mult * stdev(src, length)
upper = MA2 + dev
lower = MA2 - dev

signalColor = crossunder(close, upper) ? color.red : crossover(close, lower) ? color.green : color.white

barcolor(color=signalColor)


upperBand = plot(upper, color=color.gray, linewidth=1)
lowerBand = plot(lower, color=color.gray, linewidth=1)
fill(upperBand, lowerBand,color=color.gray)
strategy.entry("Long",true,when = crossover(close,lower)  and close <upperbande and close>lowerbande)
strategy.close("Long",when = crossunder(close,lowerbande))
strategy.entry("Short",false,when = crossunder(close,upper)  and close <upperbande and close>lowerbande)
strategy.close("Short",when = crossover(close,upperbande))

//Inputs
atrPeriod = input(defval=14, title="ATR Period",group='ATR Settings', type=input.integer) // Adjust this to change the ATR calculation length
multiplierPeriod = input(defval=1.75, title="ATR Multiplier Period",group='ATR Settings',  type=input.float)// Adjust this to change the distance between your candles and the line

//ATR Calculation
pine_rma(x, y) =>
    alpha = y
    sum = 0.0
    sum := (x + (alpha - 1) * nz(sum[1])) / alpha

true_range() =>
    max(high - low, max(abs(high - close[1]), abs(low - close[1])))

//Long SL
plot(low - pine_rma(true_range() * multiplierPeriod, atrPeriod), "Long Stop", color=color.red, offset = 1)
// Short SL
plot(high +pine_rma(true_range() * multiplierPeriod, atrPeriod), "Short Stop", color=color.red, offset = 1)
strategy.exit("Exit Long","Long",limit=upper ,stop = low - pine_rma(true_range() * multiplierPeriod, atrPeriod)  )
strategy.exit("eExit Short","Short",limit=lower ,stop =high +pine_rma(true_range() * multiplierPeriod, atrPeriod)  )
Detail
https://www.fmz.com/strategy/431967
Last Modified
2023-11-13 17:38:01
