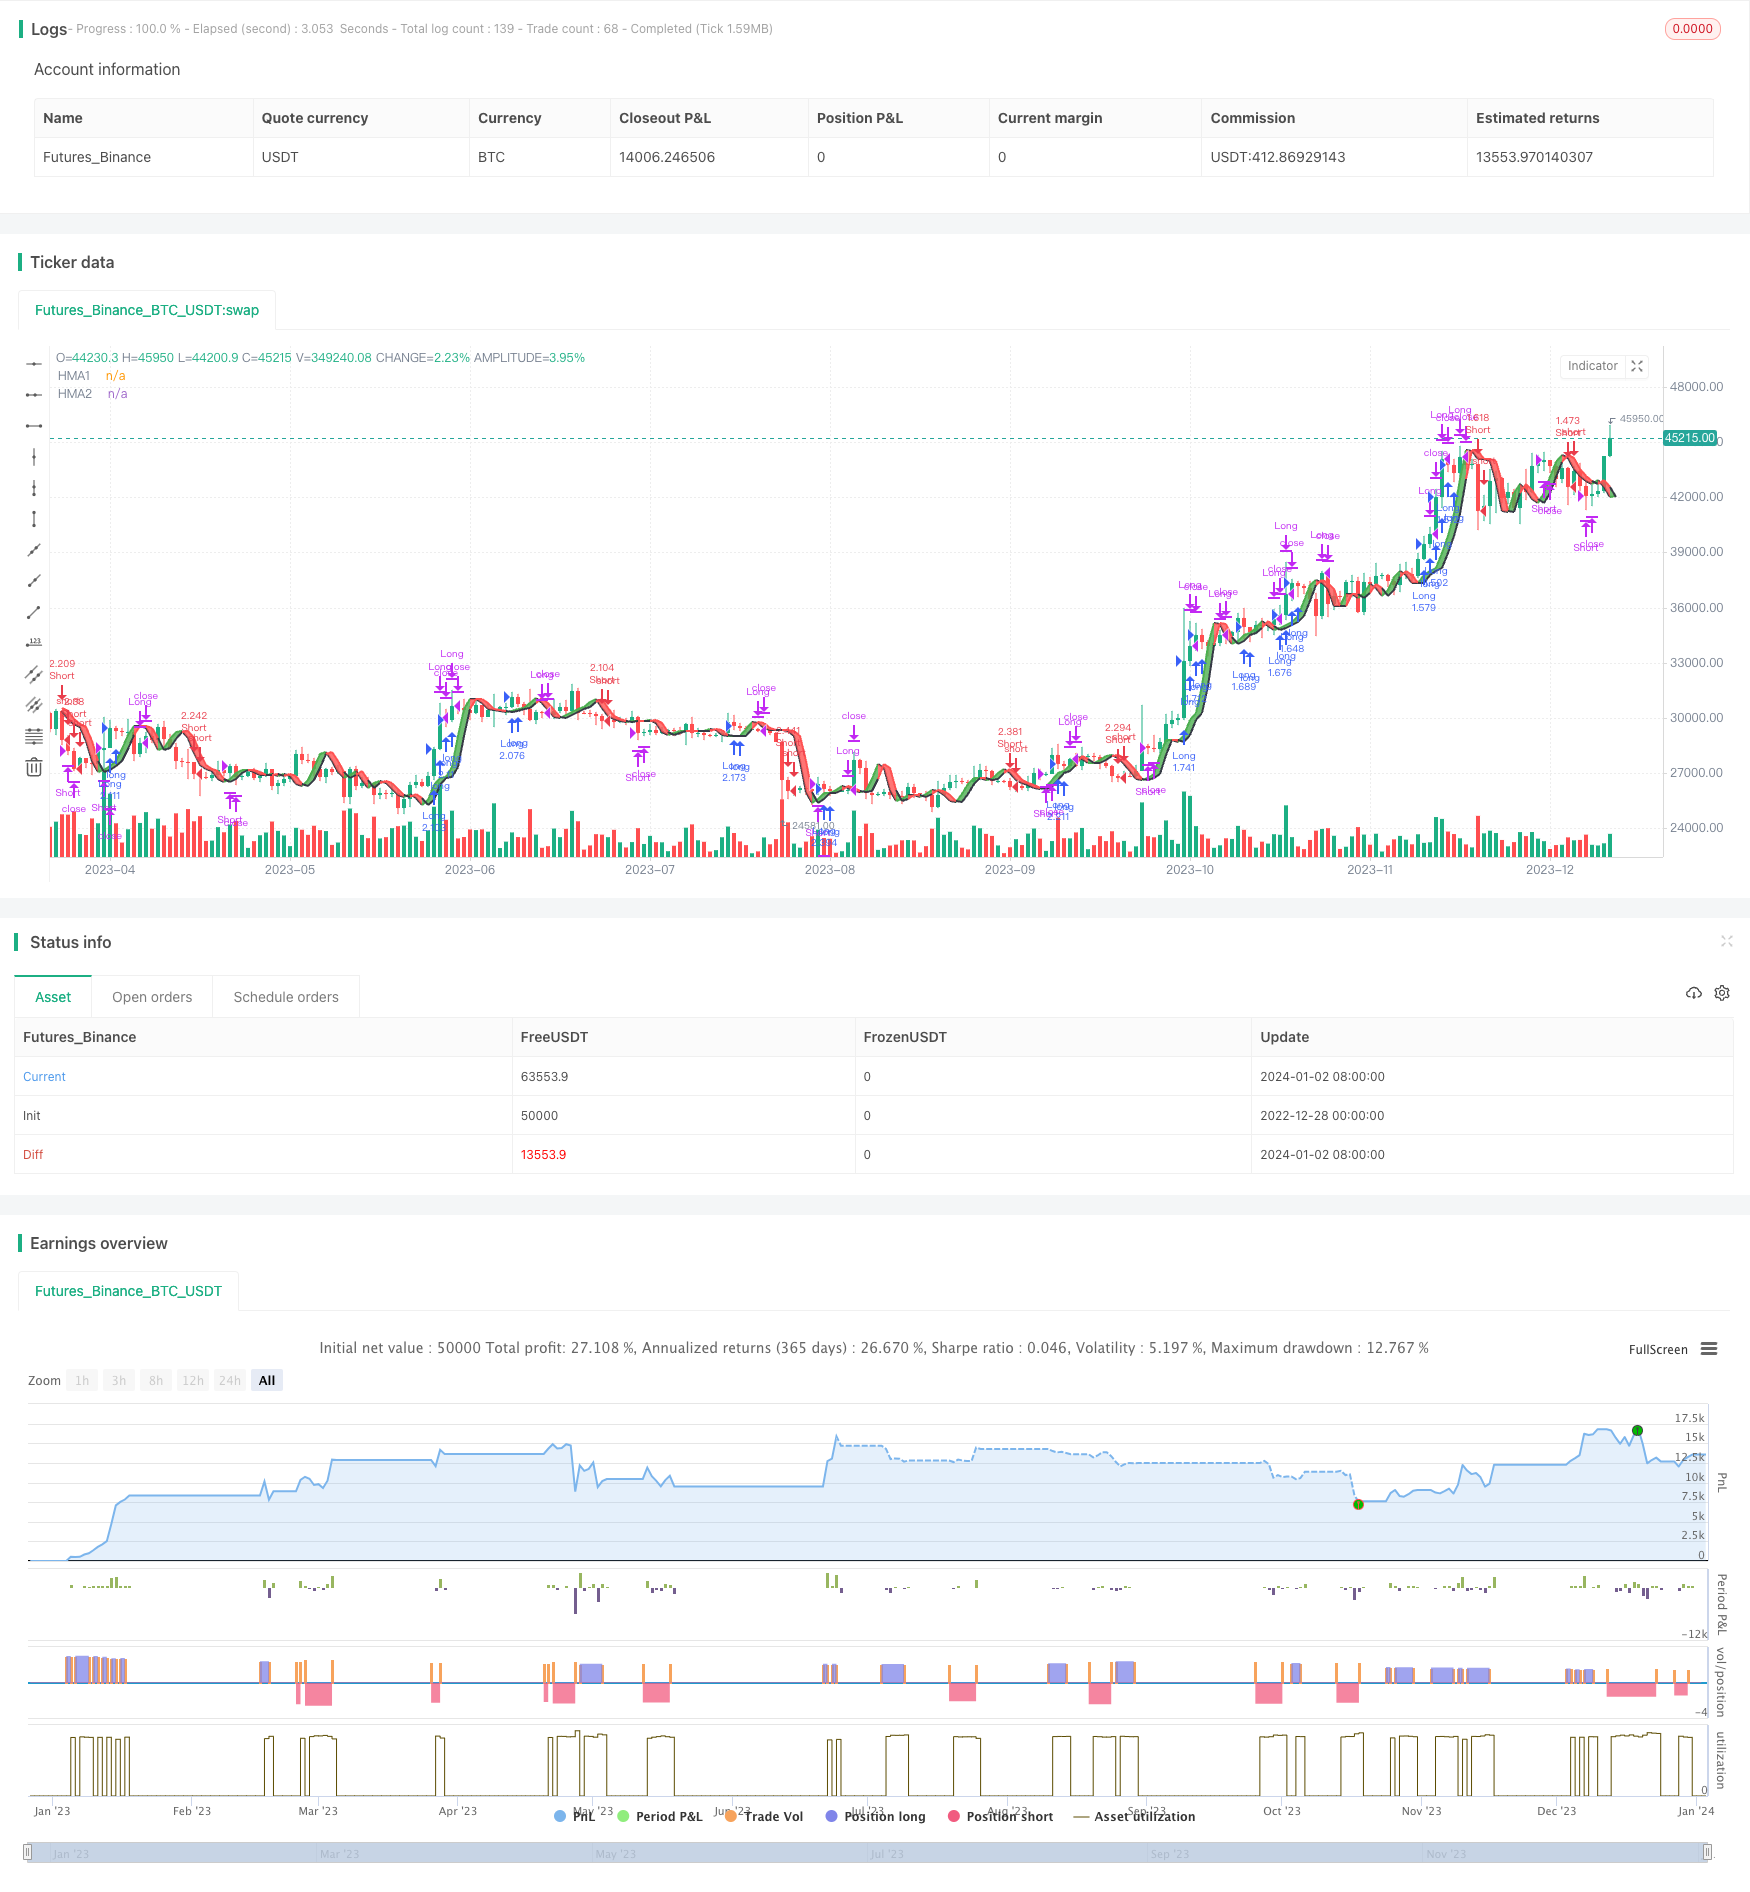
Name
HMA动能指标突破策略HMA-Momentum-Breakthrough-Strategy
Author
ChaoZhang
Strategy Description
[trans]
本策略运用HMA(Hull Moving Average)指标以及K线的技术分析,实现对价格的动能判断和突破操作。
- HMA指标的原理
HMA指标由Alan Hull于2005年创建,目标是创造一种既敏感又平滑的移动平均线。其计算方法是:
(1) 计算一半周期的Double Smoothing平均线DMA
(2) 计算全周期的平均线SMA
(3) 计算DMA和SMA的差值DIFF
(4) 计算DIFF的SQRT(周期)周期平均线,得到HMA
- 交易策略
策略以HMA指标的向上突破和向下突破为信号,结合K线实体部分的突破,产生买入和卖出信号。同时设置止损和止盈原则,实时监控盈亏情况,实现盈利保护。
-
HMA指标的『convergence』特性,使其对价格变化极为敏感,同时保持了平均线的平滑性,避免了假信号。
-
双重突破机制,提高信号的可靠性,避免被套。
-
动态止损止盈与盈利保护,使风险和收益控制到最优。
-
全自动交易,简化操作。
-
市场剧烈波动时,止损被击出的概率较大。
-
交易频率较高,手续费成本增加。
-
参数设置不当可能产生大量假信号。
-
优化止损止盈条件,设置合理回撤。
-
调整交易频率,降低手续费影响。
-
对HMA周期和突破条件进行测试优化,确定最佳参数。
-
结合趋势判断指标,避免逆势交易。
-
增加数据源切换的自动判断,适应更多市场环境。
-
增加机器学习算法,实现参数的自动优化。
-
增加部署在服务器,实现24小时实盘验证。
HMA动能指标突破策略运用Hull移动平均线的独特优势,实现对市场动能的精准捕捉。双重突破过滤机制提高信号质量,动态止盈止损保障了效益。本策略使用简单,效果明显,是一种非常实用的量化交易工具,值得推广应用。
||
This strategy uses the HMA (Hull Moving Average) indicator and technical analysis of K-line to realize momentum judgment and breakthrough operations on prices.
- HMA Indicator Principle
The HMA indicator was created by Alan Hull in 2005 to create a moving average that is both sensitive and smooth. Its calculation method is:
(1) Calculate the Double Smoothing average DMA of half cycle
(2) Calculate the full cycle average SMA
(3) Calculate the difference DIFF between DMA and SMA
(4) Calculate the SQRT(period) cycle average line of DIFF to get HMA
- Trading Strategy
The strategy uses the upward and downward breakthroughs of the HMA indicator as signals, combined with the breakthrough of the entity part of the K-line, to generate buy and sell signals. At the same time, set stop loss and take profit principles to monitor the profit and loss situation in real time to protect profits.
-
The "convergence" characteristic of the HMA indicator makes it extremely sensitive to price changes while maintaining the smoothness of the moving average to avoid false signals.
-
The double breakthrough mechanism improves the reliability of signals and avoids being trapped.
-
Dynamic stop loss and profit protection optimize risk and return.
-
Fully automated trading simplifies operations.
-
In violent market fluctuations, the probability of stop loss being hit is greater.
-
High trading frequency increases commission costs.
-
Improper parameter settings can generate a lot of false signals.
-
Optimize stop loss and take profit conditions and set reasonable retracements.
-
Adjust trading frequency to reduce commission impact.
-
Test and optimize HMA cycle and breakthrough conditions to determine optimal parameters.
-
Incorporate trend judgment indicators to avoid countertrend trading.
-
Increase automatic judgment of data source switching to adapt to more market environments.
-
Increase machine learning algorithms to achieve automatic parameter optimization.
-
Deploy on server to achieve 24-hour live trading verification.
The HMA momentum breakout strategy utilizes the unique advantages of the Hull moving average to accurately capture market momentum. The dual breakout filtration mechanism improves signal quality, and dynamic stop profit and stop loss protect income. This strategy is easy to use, effective, and a very practical quantitative trading tool that is worth promoting.
[/trans]
Strategy Arguments
| Argument | Default | Description |
|---|---|---|
| v_input_1 | 5 | HullMA |
| v_input_2 | -10000 | Stop Loss in $ |
| v_input_3 | 500 | Target Point in $ |
| v_input_4_ohlc4 | 0 | Price data: ohlc4 |
Source (PineScript)
/*backtest
start: 2022-12-28 00:00:00
end: 2024-01-03 00:00:00
period: 1d
basePeriod: 1h
exchanges: [{"eid":"Futures_Binance","currency":"BTC_USDT"}]
*/

//@version=3
//SeaSide420
strategy("Hull Moving Average and Daily Candle Crossover", shorttitle="Hull&D", overlay=true, default_qty_type=strategy.percent_of_equity, max_bars_back=720, default_qty_value=100, calc_on_order_fills= true, calc_on_every_tick=true, pyramiding=0)
// settings----------------------
q=input(title="HullMA",defval=5)
SL = input(defval=-10000.00, title="Stop Loss in $", type=float, step=1)
TP = input(defval=500.00, title="Target Point in $", type=float, step=1)
price=input(ohlc4,title="Price data")
ot=1
p=price[1]
// Daily candle crossover---------
dt = 0.0010
Daily=(p-p[1])/p[1]
//--------------------------------
// Hull MA's----------------------
n2ma=2*wma(p,round(q/2))
nma=wma(p,q)
diff=n2ma-nma
sqn=round(sqrt(q))
n2ma1=2*wma(p[1],round(q/2))
nma1=wma(p[1], q)
diff1=n2ma1-nma1
sqn1=round(sqrt(q))
n1=wma(diff,sqn)
n2=wma(diff1,sqn)
//---------------------------------
// Plotting------------------------
z1e=n1>n2?green:black
z2e=n1>n2?black:red
z3e=n1>n2?green:red
n1e=plot(n1, title="HMA1", color=z1e, linewidth=2, offset=2)
n2e=plot(n2, title="HMA2", color=z2e, linewidth=2, offset=2)
fill(n1e, n2e, color=z3e, transp=80)
// Order controls-------------------
closelong = n1<n2 and n1[1]<n2[1] and n1[2]<n2[2] or strategy.openprofit<SL or strategy.openprofit>TP
if (closelong)
    strategy.close("Long")
closeshort = n1>n2 and n1[1]>n2[1] and n1[2]>n2[2] or strategy.openprofit<SL or strategy.openprofit>TP
if (closeshort)
    strategy.close("Short")
longCondition = n1>n2 and n1[1]>n2[1] and n1[2]>n2[2] and strategy.opentrades<ot and Daily>dt and close>n1
if (longCondition)
    strategy.entry("Long",strategy.long)
shortCondition = n1<n2 and n1[1]<n2[1] and n1[2]<n2[2] and strategy.opentrades<ot and Daily<dt and close<n1
if (shortCondition)
    strategy.entry("Short",strategy.short)
Detail
https://www.fmz.com/strategy/437653
Last Modified
2024-01-04 15:34:52
