Name
Ichimoku云带动量均线交叉策略Ichimoku-Cloud-with-Dual-Moving-Average-Crossover-Strategy
Author
ChaoZhang
Strategy Description
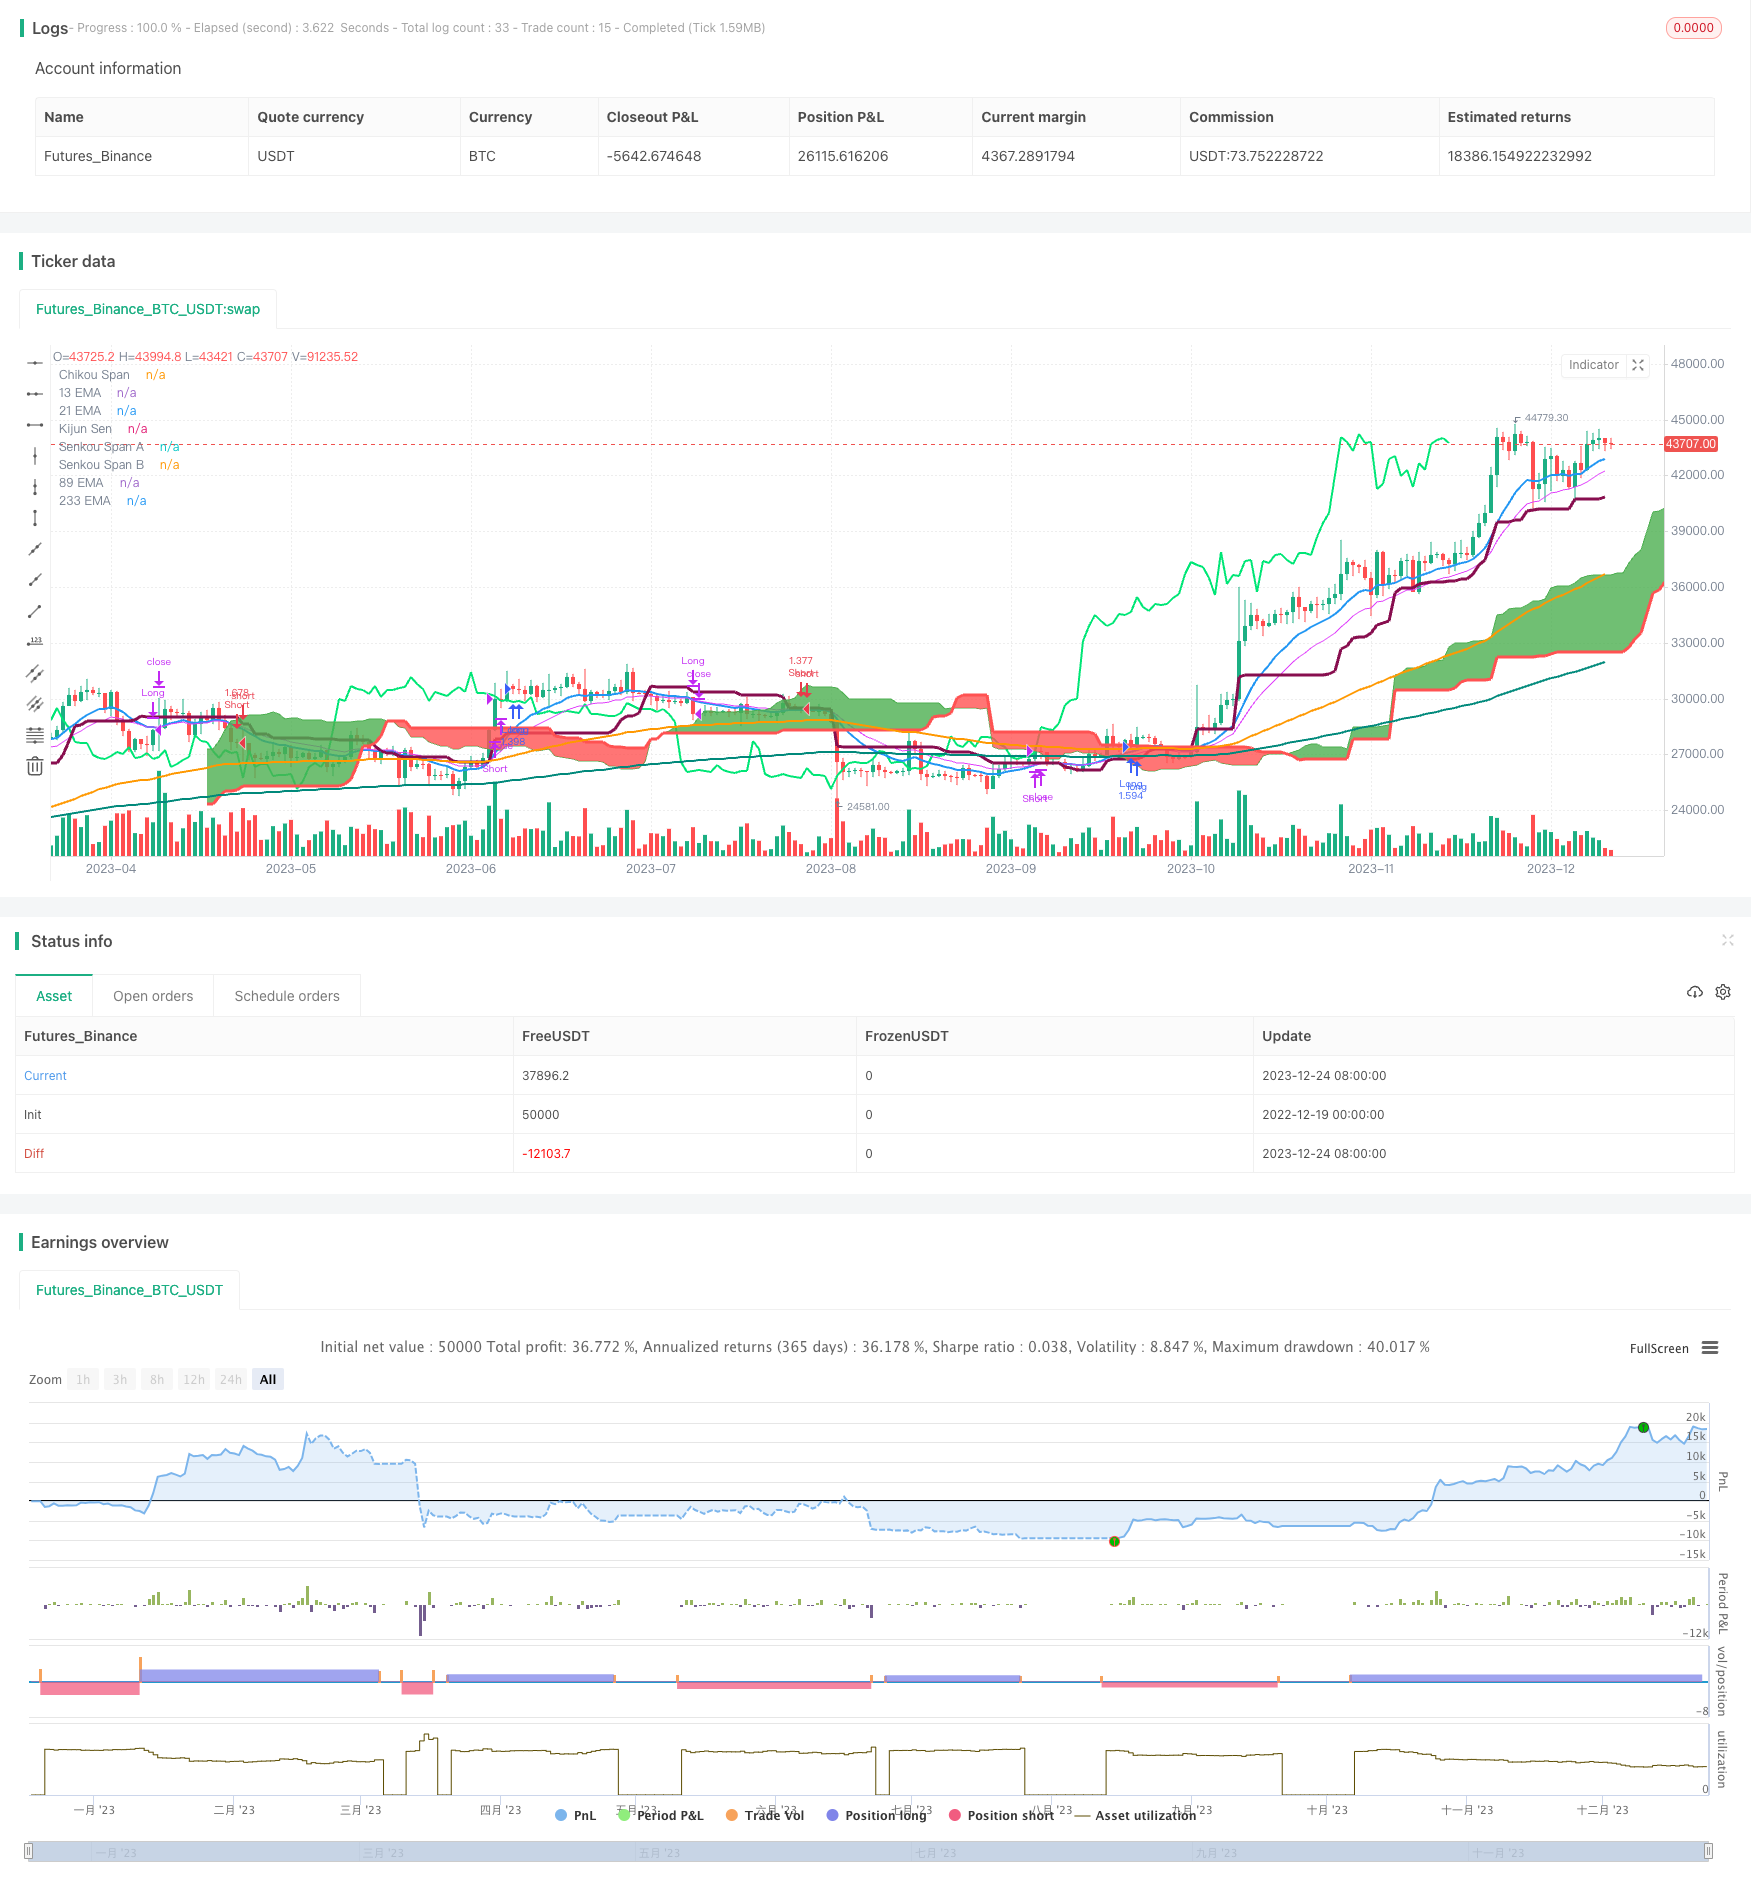
该策略通过Ichimoku云带指标与双均线指标的组合,形成长短期动量判断,实现高精度的趋势判断与交易信号产生。其中,Ichimoku云带由转向线,基准线,先导线组成,判断价格动能和未来走势。双均线部分由13周期与21周期指数移动平均线组成,判断短期价格动量变化。两者的组合,实现了多时间维度的综合判断,过滤假突破,提高信号质量。
该策略主要由Ichimoku云带指标和双指数移动平均线指标组成。
Ichimoku云带中,基准线代表中期趋势,转向线代表短期趋势,云带代表支撑阻力。具体来说,基准线为26周期最高最低价中点,转向线为9周期最高最低价中点,而云带的上轨线和下轨线分别为转向线和基准线的中点,以及52周期最高最低价中点。当价格在云带上方时为多头行情,下方为空头行情。
双指数移动平均线部分,13周期指数移动平均线代表短期趋势,21周期指数移动平均线代表中期趋势。当13EMA在21EMA之上时为多头行情,之下为空头行情。
根据Ichimoku云带与双EMA的组合判断,可以实现比较准确的趋势判断。具体交易策略为,多头入场时,要求价格高于延迟线,13EMA高于基准线和21EMA,并且价格位于云带之上。空头入场要求则为价格低于延迟线,13EMA低于基准线和21EMA,价格位于云带之下。
通过云带判断大趋势,双EMA判断短期动量,延迟线Used as a filter against whipsaws. 这样多重条件综合判断,可以有效过滤假突破,确保交易信号的可靠性。
该策略具有以下几个优势:
-
多时间框架综合判断。云带判断中长期趋势,双EMA判断短期动量,实现了多时间维度的组合,提高判断准确性。
-
有效过滤假突破。入场条件较为严格,需要价格、云带、延迟线、双EMA多个指标同向发出信号,可以过滤掉大部分噪音。
-
策略参数经过优化。如9周期转向线和26周期基准线等参数选择,使信号更加可靠。
-
适用于高波动的股票和数字货币。Ichimoku云带对跳空缺口等价格异常不敏感,更适合波动较大的交易品种。
-
绘制清晰的支撑阻力。云带可以清楚地显示关键的支撑和阻力区域。
该策略也存在一些风险:
-
在震荡行情中可能产生错乱交易信号。当价格在中期无明确趋势时,云带将发散,此时信号可靠性较差。
-
延迟线可能错过价格反转时点。当快速反转发生时,延迟线检测可能慢半拍,导致损失扩大。
-
需要判断多个指标,增加了交易难度。这要求交易者需要对各个指标都有深入的理解,否则难以准确判断。
-
首次突破云带容易被套。当价格长期被云带限制后首次突破时,容易形成套牢的局面。
-
回测数据拟合风险。当前参数经过多次优化拟合,可能对特定回测数据过于依赖。实盘中SIGNALS MAY DETERIORATE.
这些风险可以通过以下几点得到缓解:
-
在震荡趋势中降低仓位。根据ATR和波动率评估市场波动率,必要时考虑仅做轻仓交易。
-
结合其他指标过滤延迟线信号。可以引入MACD,RSI等辅助指标对延迟线信号进行二次校验。
-
做好持续回测。修改回测时间和品种,检查策略稳健性。同时引入滑点、手续费等真实交易因素。
-
实盘连续跟踪,记录异常情况。实盘观察云带与价格运动的匹配情况,记录策略表现,作为后续改进参考。
该策略可以从以下几个方面进行优化:
-
引入止损策略。建议引入滑点止损、突破新高(新低)止损等策略,严格控制风险。
-
优化移动均线参数。可以测试更多的EMA周期参数组合,找到更匹配的多空周期。
-
增加其他指标过滤。可以测试引入MACD,KD,RSI等指标,对交易信号进行过滤,排除更多假信号。
-
根据市况调整仓位。可以建立波动率模型,在高波动时降低仓位;低波动时加大仓位。
-
测试不同品种参数健壮性。修改回测品种和时间段,检查策略在不同市场中的稳定性。
通过这些优化,可以进一步提升策略的稳定性和信号质量,减少曲线拟合风险,使策略的参数和规则更加健壮。
该Ichimoku云带与双EMA交叉策略,融合了 Ichimoku云带的趋势判断能力与EMA的短期预测能力,形成了一套较为完整的多时间框架交易体系。在多空条件判断上比较严格,包含价格本身、云带位置、延迟线、双EMA多种指标,可以有效过滤假信号。但也应注意震荡行情下的风险,此时应结合更多指标二次校验。总体而言,该策略成功结合了趋势跟踪和短期预测两大核心能力,值得深入研究与运用。
||
This strategy combines the Ichimoku cloud with a dual moving average crossover system to form judgments on both long-term and short-term momentum, enabling highly accurate trend identification and trade signals. The Ichimoku cloud is formed by the conversion line, base line, and leading lines to determine price energy and future movements. The dual moving average portion consists of 13 and 21 period exponential moving averages (EMA) to determine short-term price momentum shifts. Together, multiple timeframes are synthesized to improve accuracy and filter out false breaks.
The strategy primarily consists of the Ichimoku cloud and dual EMA indicators.
Within the Ichimoku cloud, the base line represents medium-term trends, conversion line for short-term trends, and cloud bands for support/resistance. Specifically, base line is 26 period midprice, conversion is 9 period midprice, cloud borders are midpoints of base/conversion lines and 52 period midprice. Prices above the cloud signal uptrend while below show downtrends.
For dual EMAs, 13 period EMA tracks short-term trends and 21 period EMA for medium-term trends. 13EMA above 21EMA signals uptrend and vice versa for downtrends.
Combining Ichimoku and EMA judgments enables fairly accurate trend detection. Specific entry rules require price above lagging line, 13EMA over base line and 21EMA, and price within cloud for longs. Short entries need the reverse.
The cloud identifies major trends, EMAs short-term momentum, and lagging line filters whipsaws. Together they reliably filter false breaks.
The strategy has these main advantages:
-
Multi-timeframe synthesis. Cloud for medium/long-term, EMAs for short-term combine multiple dimensions for better accuracy.
-
Effective false break filtering. Strict entry rules requiring price, cloud, lagging line, EMAs alignment filter out noise.
-
Optimized parameters. Inputs like 9 period conversion line, 26 period base line reliably generate signals.
-
Applicable for high volatility assets. Ichimoku cloud robust against gaps, fitting for volatile stocks and crypto.
-
Clear support/resistance levels. Cloud bands clearly show critical S/R zones.
There are also some risks to consider:
-
Whipsaws possible during rangbound markets. Clouds diverge and signal reliability lower when no clear trends.
-
Lagging line may miss reversal points. Rapid flips could mean losses from lagging line detections.
-
Multiple indicators increase complexity. Traders need strong grasp of all indicators for accurate judgments.
-
Break failures possible on initial cloud penetrations. Long contained prices can whip on first breakouts.
-
Backtest overfitting risks. Current optimized parameters may overfit specific backtest data. Live performance may deteriorate.
Some mitigations for these risks include:
-
Reduce position sizing during choppy/whipsaw conditions based on volatility.
-
Additional indicators like MACD, RSI to filter lagging line signals.
-
Robust backtesting across various periods and instruments to verify stability. Incorporate real trading factors like slippage, commissions.
-
Track live performance to log anomalies vs expected behaviors as reference for improvements.
The strategy can be improved in several aspects:
-
Incorporate stop loss mechanisms like volatility or high/low based stops to strictly limit risks.
-
Optimize EMA periods for better trend/counter-trend sensitivity.
-
Add additional indicators like MACD, RSI to filter signals, removing false positives.
-
Adapt position sizing based on volatility models, increase size in calm low volatility environments.
-
Test parameter robustness across different instruments and time periods for stability.
These enhancements can further improve stability, signal quality, robustness against curve fitting, and parameter resilience across various market conditions.
The integrated Ichimoku cloud and dual EMA crossover strategy complements Ichimoku’s trending capabilities with EMA’s short-term predictive skills into a robust system across multiple timeframes. Strict multi-indicator entry conditions effectively filter out false signals but whipsaw risks in choppy periods should be noted, warranting additional confirmation indicators in those cases. Overall it successfully combines core competencies of trend following and short-term forecasting, worthy of further research and application.
[/trans]
Strategy Arguments
| Argument | Default | Description |
|---|---|---|
| v_input_1 | 9 | Tenkan Sen Periods |
| v_input_2 | 26 | Kijun Sen Periods |
| v_input_3 | 52 | Senkou Span B Periods |
| v_input_4 | 26 | Displacement |
Source (PineScript)
/*backtest
start: 2022-12-19 00:00:00
end: 2023-12-25 00:00:00
period: 1d
basePeriod: 1h
exchanges: [{"eid":"Futures_Binance","currency":"BTC_USDT"}]
*/

//@version=3
strategy("13/21 EMA + Ichimoku Kinko Hyo Strategy", shorttitle="EMI", overlay=true, default_qty_type=strategy.percent_of_equity, max_bars_back=1000, default_qty_value=100, calc_on_order_fills= true, calc_on_every_tick=true, pyramiding=0)

TenkanSenPeriods = input(9, minval=1, title="Tenkan Sen Periods")
KijunSenPeriods = input(26, minval=1, title="Kijun Sen Periods")
SenkouSpanBPeriods = input(52, minval=1, title="Senkou Span B Periods")
displacement = input(26, minval=1, title="Displacement")
donchian(len) => avg(lowest(len), highest(len))
TenkanSen = donchian(TenkanSenPeriods)
KijunSen = donchian(KijunSenPeriods)
SenkouSpanA = avg(TenkanSen, KijunSen)
SenkouSpanB = donchian(SenkouSpanBPeriods)
ChikouSpan = close[displacement-1]

Sema = ema(close, 13)
Mema = ema(close, 21)
Lema = ema(close, 89)
XLema = ema(close, 233)

plot(Sema, color=blue, title="13 EMA", linewidth = 2)
plot(Mema, color=fuchsia, title="21 EMA", linewidth = 1)
plot(Lema, color=orange, title="89 EMA", linewidth = 2)
plot(XLema, color=teal, title="233 EMA", linewidth = 2)
plot(KijunSen, color=maroon, title="Kijun Sen", linewidth = 3)
plot(close, offset = -displacement, color=lime, title="Chikou Span", linewidth = 2)
sa=plot (SenkouSpanA, offset = displacement, color=green,  title="Senkou Span A", linewidth = 1)
sb=plot (SenkouSpanB, offset = displacement, color=red,  title="Senkou Span B", linewidth = 3)
fill(sa, sb, color = SenkouSpanA > SenkouSpanB ? green : red)

longCondition = close>ChikouSpan and Sema>KijunSen and Sema>Mema and SenkouSpanA>SenkouSpanB
strategy.entry("Long",strategy.long,when = longCondition)
strategy.close("Long", when = (close<KijunSen and close<ChikouSpan and Sema<Mema))

shortCondition = close<ChikouSpan and Sema<KijunSen and Sema<Mema and SenkouSpanA<SenkouSpanB
strategy.entry("Short",strategy.short, when = shortCondition)
strategy.close("Short", when = (close>KijunSen and close>ChikouSpan and Sema>Mema))
Detail
https://www.fmz.com/strategy/436651
Last Modified
2023-12-26 16:10:24
